CGA - WE car market - May update
•
1 like•90 views

Automotive Research - WE car demand in April 2017 Focus on Germany, France, Italy, Spain and UK

Recommended
More Related Content
What's hot
What's hot (20)
Similar to CGA - WE car market - May update
Similar to CGA - WE car market - May update (20)
Recently uploaded
Recently uploaded (20)
CGA - WE car market - May update
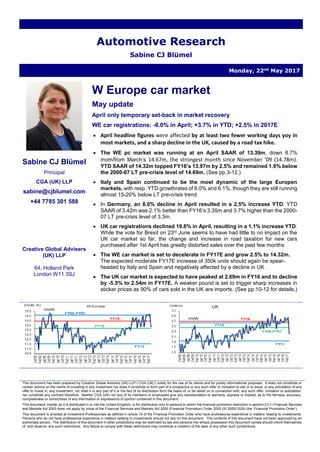
- 1. This document has been prepared by Creative Global Advisers (UK) LLP (‘CGA (UK)’) solely for the use of its clients and for purely informational purposes. It does not constitute or contain advice on the merits of investing in any investment nor does it constitute or form part of a prospectus or any such offer or invitation to sell or to issue, or any solicitation of any offer to invest in, any investment, nor shall it or any part of it or the fact of its distribution form the basis of, or be relied on in connection with, any such offer, invitation or solicitation, nor constitute any contract therefore. Neither CGA (UK) nor any of its members or employees give any representation or warranty, express or implied, as to the fairness, accuracy, completeness or correctness of any information or expressions of opinion contained in this document. This document, insofar as it is distributed in or into the United Kingdom, is for distribution only to persons to whom the financial promotion restriction in section 21(1) Financial Services and Markets Act 2000 does not apply by virtue of the Financial Services and Markets Act 2000 (Financial Promotion) Order 2005 (SI 2005/1529) (the ‘Financial Promotion Order’). This document is directed at Investment Professionals as defined in article 19 of the Financial Promotion Order who have professional experience in matters relating to investments. Persons who do not have professional experience in matters relating to investments should not rely on this document. The contents of this document have not been approved by an authorised person. The distribution of this document in other jurisdictions may be restricted by law and persons into whose possession this document comes should inform themselves of, and observe, any such restrictions. Any failure to comply with these restrictions may constitute a violation of the laws of any other such jurisdictions. Automotive Research Sabine CJ Blümel Monday, 22nd May 2017 Sabine CJ Blümel Principal CGA (UK) LLP sabine@cjblumel.com +44 7785 301 588 Creative Global Advisers (UK) LLP 64, Holland Park London W11 3SJ W Europe car market May update April only temporary set-back in market recovery WE car registrations: -8.0% in April; +3.7% in YTD; +2.5% in 2017E • April headline figures were affected by at least two fewer working days yoy in most markets, and a sharp decline in the UK, caused by a road tax hike. • The WE pc market was running at an April SAAR of 13.39m, down 8.7% mom/from March’s 14.67m, the strongest month since November ’09 (14.78m). YTD SAAR of 14.32m topped FY16’s 13.97m by 2.5% and remained 1.9% below the 2000-07 LT pre-crisis level of 14.69m. (See pp.3-12.) • Italy and Spain continued to be the most dynamic of the large Europen markets, with resp. YTD growthrates of 8.0% and 6.1%, though they are still running almost 15-20% below LT pre-crisis trend. • In Germany, an 8.0% decline in April resulted in a 2.5% increase YTD. YTD SAAR of 3.42m was 2.1% better than FY16’s 3.35m and 3.7% higher than the 2000- 07 LT pre-crisis level of 3.3m. • UK car registrations declined 19.8% in April, resulting in a 1.1% increase YTD. While the vote for Brexit on 23rd June seems to have had little to no impact on the UK car market so far, the change and increase in road taxation for new cars purchased after 1st April has greatly distorted sales over the past few months • The WE car market is set to decelerate in FY17E and grow 2.5% to 14.32m. The expected moderate FY17E increase of 350k units should again be spear- headed by Italy and Spain and negatively affected by a decline in UK . • The UK car market is expected to have peaked at 2.69m in FY16 and to decline by -5.5% to 2.54m in FY17E. A weaker pound is set to trigger sharp increases in sticker prices as 90% of cars sold in the UK are imports. (See pp.10-12 for details.)
- 2. Sabine CJ Blümel – Automotive Research 22/05/2017 CGA (UK) LLP sabine@cjblumel.com +44 7785 301 588 Page 2 Table of Contents Western Europe car market ..............................................................................................................................................3 Germany........................................................................................................................................................................6 France............................................................................................................................................................................7 Italy ................................................................................................................................................................................8 Spain..............................................................................................................................................................................9 UK update....................................................................................................................................................................10
- 3. Sabine CJ Blümel – Automotive Research 22/05/2017 CGA (UK) LLP sabine@cjblumel.com +44 7785 301 588 Page 3 Western Europe car market -8.0% in April +3.7% in YTD +5.8% to 13.97m in FY16 In April, WE passenger car registrations declined 8.0% yoy to 1.12m, after a 10.3% increase in March, resulting in a 3.7% increase to 5.06m YTD. This follows increases of 7.4% in 1Q17 and 5.8% to 13.97m in FY16. Headline figures in April were affected by at least two fewer working days yoy in most markets, whereas March benefitted from at least one additional working day yoy in most markets. YTD SAAR of 14.32m In April, the SAAR weakened again to 13.39m, down 8.7% mom/from March’s 14.67m, the strongest month since November ’09 (14.78m). YTD SAAR of 14.32m topped FY16’s 13.97m by 2.5% and was 1.9% below the 2000-07 LT pre-crisis level of 14.69m. All Big 5 advance strongly in YTD Germany +2.5% France +2.0% UK +1.1% Italy +8.0% Spain +6.1% Germany, Western Europe’s largest car market declined 8.0% in April and grew 2.5% to 1.14m units YTD. YTD SAAR of 3.42m was 2.1% better than FY16’s 3.35m and 3.7% higher than the 2000-07 LT pre-crisis level of 3.3m. French car registrations declined 6.0% in April and grew 2.0% to 0.71m YTD. YTD SAAR of 2.11m was up 4.5% on FY16’s 2.02m and 1.0% on the 2000-07 LT pre-crisis level of 2.09m. In the UK, the car market declined 19.8% in April, resulting in an 1.1% increase to 0.97m units YTD. YTD SAAR of 2.64m was 1.9% below FY16’s 2.69m and 8.0% above pre-crisis LT level of 2.45m by 13.6%. YTD, Italian car registrations increased 8.0% increase to 0.74m and the SAAR of 1.99m was 8.9% higher than FY16’s 1.82m, but remained 15.0% below the 2000-07 LT pre-crisis level of 2.34m. YTD, Spanish car registrations increased 6.1% to 0.41m and the SAAR of 1.19m was up 4.0% from FY16’s 1.15m and remained 19.3% below the 2000-07 level of 1.45m. (See discussion of the Big Five on pp. 4-12.) Economic indicators continue to improve… …Eurozone economy Market set to decelerate sparply… …to 2.5% to 14.32m in FY17E In the Eurozone, GDP growth remained stable at 0.5 % qoq in 4Q16 and 1Q17, and GDP is expected to grow by at least 1.7% in FY17E, at the same rate as in FY16 and barely decelerate thereafter. Indeed, consumer and business indicators have continued to improve, with the former hitting a 10-year high in May and the latter a six-year high in April. However, in 2017 and beyond, we see considerable downside risks for the Eurozone economy related to Brexit (weak sterling and economic slow-down in the UK), elections in several countries (France, UK, Germany and Italy) and possible disruptions to international trade, mainly due to president Trump. In addition, a pick-up in inflation (base effect, recovery in commodity prices) should have a dampening effect on disposable income and thus on private consumption, to date a main driver of GDP. For the UK, GDP growth is expected to decelerate from 2.0% in FY16 to 1.6% in FY17E and 1.3% in 2018E. We expect that the WE car market is set to decelerate sharply from FY16’s 5.8% to 2.5% to 14.32m in FY17E. While in FY16 the increase of 770k vehicles was spearheaded by Italy, Germany and Spain, the expected moderate increase of 350k units should be spear-headed by Italy and Spain and affected by a decline in the UK. Competitive pressures set to intensify as the markets slows During the four-year recovery, the WE car market remained overshadowed by tough competition and pricing pressures. Indeed, as the market is heading for a considerable slow-down, discounts have reportedly increased to some 20% in core markets, fleet sales are taking over momentum from retail sales and HH leverage is increasing. In addition to record discounts, special deals and cheap financing, OEMs and dealers have increasingly resorted to tactics such as pre-registering. Since July‘16, the OEMs’ woes have been exacerbated by a weaker pound and the prospect of a declining UK market. Polarisation in demand The trend of polarisation in demand into premium and discount brands and products has been intact for the past 20 years. Driving forces have been the downsizing on the part of the premium brands and an improvement in quality of discount branded products. This has dramatically eroded the market position and share of European mainstream brands such as GM’s Opel/Vauxhall and Ford, and local champions such as Renault, Peugeot, Citroen and Fiat. The mainstream brands of the VW group have incurred a reversal in their market outperformance since the break of the diesel scandal in September ‘15.
- 4. Sabine CJ Blümel – Automotive Research 22/05/2017 CGA (UK) LLP sabine@cjblumel.com +44 7785 301 588 Page 4 W Europe – monthly SAAR1 vs. trend (Oct’08–Apr’17) W Europe – pc registrations (1998-2019E) (1) SAAR according to calculations by LMC Automotive. Source: ACEA, LMC Automotive, CGA (UK) calculations Source: LMC Automotive and CGA (UK) estimates W Europe – pc registrations (1961-2020E) Eurozone – real GDP and priv. consumption (2007-19E) Source: ACEA, LMC Automotive and CGA (UK) estimates Source: Oxford Economics, IMFand CGA (UK) estimates W Europe – depth of recession – 2008-20E volume decline vs. 2007 W Europe – current recession in historic context Depth1 Duration Trend growth rate (Units m) (%) (years) (%) 1970 - oil shock -1.15 -12.4 < 3 5 Early 1980s recession -0.75 -7.0 ~ 6 3-4 1993 recession -2.26 -16.8 ~ 5 2-3 Current crisis (E) -3.26 -22.0 ~13 1-2 Source: LMC Automotive and CGA (UK) estimates Source: LMC Automotive and CGA (UK) estimates
- 5. Sabine CJ Blümel – Automotive Research 22/05/2017 CGA (UK) LLP sabine@cjblumel.com +44 7785 301 588 Page 5 Premium brands, Japanese and discount brands – WE market share (’92-’17*) Mainstream brands: VW group (excl. Audi & Porsche), Opel/Vauxhall, Ford, FCA – WE share (’92-’17*) (1) Premium brands: BMW, Mini, Mercedes-Benz, Smart, Audi, Lexus, Porsche, Jaguar, Land Rover, Volvo, SAAB, DS and super-premium brands. (3) Discount brands: Kia, Hyundai, GM’s Chevrolet, and Renault’s Dacia & LADA. (2) Exl. Lexus (*) YTD=Jan-Apr. Source: Association Auxiliaire de l'Automobile, ACEA, CGA (UK) calcs (1) VW mainstream brands: VW, Seat, Skoda. (2) FCA: Fiat, Lancia & Alfa Romeo. Since 2012 also Chrysler & Jeep. (*)YTD=Jan-Apr. Source: Association Auxiliaire de l'Automobile, ACEA, CGA (UK) calculations PSA & GME – WE share (’92-17*) PSA and Renault group – WE share (’92-’17*) (1) (1) PSA: Peugeot, Citroën & DS brands (2) GM Europe: Opel, Vauxhall, Chevrolet and other US GM brands. (*)YTD=Jan-Apr. Source: Association Auxiliaire de l'Automobile, ACEA, CGA (UK) calculations (1) PSA: Peugeot, Citroën & DS brands; (2) Renault group: Renault and Dacia brands. (*)YTD=Jan-Apr. Source: Association Auxiliaire de l'Automobile, ACEA, CGA (UK) calculations W Europe – pc market by OEM (FY16) W Europe – pc market by OEM (Jan-Apr’17) (*) VW group incl. Porsche. (**) Fiat group incl. Chrysler and Jeep. Source: Association Auxiliaire de l'Automobile, ACEA and CGA (UK) calculations (*) VW group incl. Porsche. (**) Fiat group incl. Chrysler and Jeep. Source: ACEA and CGA (UK) calculations
- 6. Sabine CJ Blümel – Automotive Research 22/05/2017 CGA (UK) LLP sabine@cjblumel.com +44 7785 301 588 Page 6 Germany – monthly SAAR1 vs. trend (Oct’08-Apr’17) Germany – pc registrations (1998-2019E) (1) SAAR according to LMC Automotive. Source: KFBA, LMCA and CGA (UK) calculations Source: KFBA, LMC Automotive and CGA (UK) estimates Germany -8.0% in April +2.5% in YTD YTD SAAR of 3.42m In April, the German pc market declined 8.0% yoy to 290.7k units, after having increased 11.4% in March, resulting in a 2.5% increase to 1.14m units in YTD. This follows increases of 8.2% in 1Q17 and 4.5% to 3.35m in FY16. Headline figures were affected by three fewer working days yoy in April and two additional working days yoy in March’17. Underlying demand declined again in April, to a SAAR of 3.20m, 7.5% down mom/from a SAAR of 3.45m in March and was thus 10.4% weaker than January’s 3.57m, the strongest month since the subsidy boosted October ’09 (3.65m). YTD SAAR of 3.42m was 2.1% better than FY16’s 3.35m and 3.7% higher than the 2000-07 LT pre- crisis level of 3.3m. +2.0% to 3.42m in FY17E The combination of a tight labour market, rising wages and disposable income have kept consumer confidence stable at a 10-year high and should ensure that consumption will remain a key macro-economic driver. In 2017E-18E, the German economy is therefore expected to decelerate only moderately from FY16’s 1.9%. GDP growth even accelerated in 1Q17, to 0.6% qoq, from 0.4% in 4Q17, driven by domestic and foreign demand and investments. However, the danger of a disruption to international trade poses a downside risk. After a 4.5% increase in FY16, the German car market is set to grow another 2.0% to 3.42m in FY17E. Replacement demand from the incentive- driven boom in 2009, when 3.81m cars had been sold should be a supporting factor. Past 11 months saw some reversal of retail share decline… ..driven by aggressive marketing During its solid recovery over the past four years, the pricing improvement has been only moderate with discounts reportedly above 20% and the quality of the market poor. Accounting for more than 30% of car sales, pre-registrations are sold by dealers as ‘used’ cars at considerable discounts. With the market back at pre-crisis level and growth slowing, aggressive marketing to private customers has intensified and explains why, over the past 11 months, against LT trend, retail sales have outperformed fleet sales, up 3.9% to a 33.8% share in YTD, compared to 33.3% in YTD16 and 35.0% in FY16. Germany – pc market shares (2010,13,15,16) Germany – real GDP and priv. consumption (2007-19E) (*) VW group incl. Porsche. Source: KFBA and CGA (UK) calculations Source: Oxford Economics, IMF and CGA (UK) estimates
- 7. Sabine CJ Blümel – Automotive Research 22/05/2017 CGA (UK) LLP sabine@cjblumel.com +44 7785 301 588 Page 7 France – monthly SAAR1 vs. trend (Oct’08-Apr’17) France – pc registrations (1998-2019E) (1) SAAR according to calculations by LMC Automotive. Source: CCFA, LMC Automotive and CGA (UK) calculations Source: CCFA, LMC Automotive and CGA (UK) estimates France -6.0% in April +2.0% in YTD In April, French car registrations declined 6.0% to 171.9k units, after having increased 7.0% in March, resulting in a 2.0% increase to 0.71m YTD, This follows increases of 4.8% in 1Q17.and 5.1% to 2.02m in FY16. Adjusted for the number of working days, the market was up 3.9% in April, 2.0% in YTD and 1.6% in 1Q17. YTD SAAR of 2.11m In April, underlying demand weakened again to a SAAR of 2.01m, 7.5% down mom/from March’s SAAR of 2.17m and remained 8.1% below January’s 2.19m that had been the strongest month since February ‘11. YTD SAAR of 2.11m was up 4.5% on FY16’s 2.02m and 1.0% on the 2000-07 LT pre-crisis level of 2.09m. Economy underperforming,… …but not fragile France’s macro-economic credentials have remained mixed as GDP growth decelerated again from 1.3% in FY15 to 1.2% in FY16, and more recently from (a revised) 0.5% qoq in 4Q16 to 0.3% in 1Q17. Private consumption should remain a key economic driver as consumer confidence has steadily improved throughout the past four years to pre-crisis levels, helped by low inflation and a (slow) improvement in the labour market. Macron’s scope for reform determined by the June parliamentary election France’s economic performance from 2018 onwards will greatly depend on the progress pro-business president Macron will be able to make in tackling France’s many structural problems; top of his list is reform and deregulation of the rigid, two-tier labour market. The outcome of the forthcoming parliamentary elections in June will determine Macron’s scope of manoeuvre for his domestic reforms. +1.7% to 2.05m in FY17E With a medium-term outlook for the French pc market of 2.1-2.2m units, we expect a 2.5% increase to 2.07 in FY17E, after 5.1% in FY16. France – pc market shares (2010,13,15,16) France – real GDP and priv. consumption (2007-19E) (*) VW group incl. Porsche. Source: CCFA and CGA (UK) calculations Source: Oxford Economics, IMF and CGA (UK) estimates
- 8. Sabine CJ Blümel – Automotive Research 22/05/2017 CGA (UK) LLP sabine@cjblumel.com +44 7785 301 588 Page 8 Italy – monthly SAAR1 vs. trend (Oct’08-Apr’17) Italy – pc registrations (1998-2019E) (1) SAAR according to calculations by LMC Automotive. Source: ANFIA, UNRAE, LMC Automotive and CGA (UK) calculations Source: ANFIA, UNRAE, LMC Automotive and CGA (UK) estimates Italy -4.6% in April +8.0% in YTD YTD SAAR of 1.99m In April, the Italian pc market incurred the first yoy decline after 34 consecutive months of growth due to two fewer working days yoy. The 4.6% decline to 160.7k units in April followed a 18.2% increase in March, resulting in a 8.0% increase to 0.74m YTD This follows increases of 11.9% in 1Q17 and 15.8% to 1.82m in FY16. Underlying demand weakened again in April, to a SAAR of 1.81m, down 14.6% mom/from March’s SAAR of 2.12m that had been the strongest month since December 2010 (2.15m). YTD SAAR of 1.99m was 8.9% higher than FY16’s 1.82m, but remained 15.0% below the 2000-07 LT pre-crisis level of 2.34m. Economic recovery remains anemic Banking sector danger to eonomy Italy’s recovery from a three-year, triple-dip recession has struggled to gain any momentum and GDP growth remained anaemic at 0.8% in FY15 and 0.9% in FY16. Private consumption, the main driver of Italy’s recovery so far, is set to decelerate from 1.6% in FY15 and 1.3% in FY16, to well below 1% in 2017E-18E, as employment growth eases and energy prices and inflation pick up. This is supported by consumer confidence that has weakened since the beginning of 2016, though remained at levels not seen since 2002. In 1Q17, GDP growth failed to accelerate from 4Q16’s 0.2%. The extraordinarily weak banking sector, together with a multitude of structural problems, are set to continue to keep economic growth to well below 1% in 2017E-18E. The political stabilisation process has continued Since Matteo Renzi’s resignation as PM (in December’16), national politics have remained relatively calm under a care-taker government with former foreign minister Paolo Gentiloni at the helm. However, the government is facing challenging decisions on next year’s budget, the banking sector crisis and the future of Alitalia, raising the possibility of early parliamentary elections before February 2018. +9.0% to 1.99m in FY17E In view of the economic recovery, modest as it may be, a large car parc and considerable pent-up demand, the Italian car market is set to continue to recover strongly. We expect that the market will grow 9.0% to 1.99m units in FY17E, after 15.8% in FY16. Italy – pc market shares (2010,13,15,16) Italy – real GDP and priv. consumption (2007-19E) (*)VW group incl. Porsche. Source: Anfia and CGA (UK) calculations Source: Oxford Economics, IMF and CGA (UK) estimates
- 9. Sabine CJ Blümel – Automotive Research 22/05/2017 CGA (UK) LLP sabine@cjblumel.com +44 7785 301 588 Page 9 Spain – monthly SAAR1 vs. trend (Oct’08-Apr’17) Spain – pc registrations (1998-2019E) (1) SAAR according to calculations by LMC Automotive. Source: ANFAC, LMC Automotive and CGA (UK) calculations Source: ANFAC, LMC Automotive and CGA (UK) estimates Spain +1.1% in April +6.1% in YTD YTD SAAR of 1.19m In April, Spanish car registrations grew 1.1% yoy to 101.4k units, after 12.6% in March, resulting in a 6.1% increase to 0.41m YTD. This follows increases of 7.9% in 1Q17 and 10.9% to 1.15m in FY16. Spain was the only large WE market that reported a yoy increase in April headline sales, despite two fewer selling days; while retail sales fell 14.0% yoy, sales to rental companies jumped 36.0%, ahead of the summer holiday season. In April, the SAAR strengthened again to 1.25m, up 10.8% mom/from March’s 1.13m and remained just 1.7% below September’s record 1.27m. YTD SAAR of 1.19m was up 4.0% from FY16’s 1.15m and remained 19.3% below the 2000-07 level of 1.45m. Government incentive scheme allowed to expire after 46ms… …as the economy has accelerated The strong recovery in the Spanish car market with the SAAR more than doubling between September’12 (0.56m) and September’16 (1.27m), was initially primarily driven by the PIVE scrappage scheme. First introduced in October ‘12, the Spanish government topped up the scheme seven times, but let PIVE 8 expire as scheduled. During the 46ms of stimulus, the economic recovery has gained momentum and has together with replacement demand become the main driver. Buoyant fleet and rental sales have prevented a dramatic pay-back in the Spanish market following the expiry of the PIVE scrappage scheme at the end of July. On this basis, the Spanish pc market is set to grow 6.3% to 1.22m in FY17E, after 10.9% to 1.15m in FY16. +6.3% to 1.22m in FY17E Spain has become one of the fasted growing economies in the Eurozone, with GDP growing at 3.2% in FY15 and FY16. The recovery has been driven by domestic demand and more recently, also by net exports. The economic outlook remains positive, GDP and private consumption are expected to decelerate only moderately in 2017E-18E. In 1Q17, GDP growth even accelerated to a (prel) 0.8% qoq, from 0.7% in 4Q16. Consumer confidence has stabilised at pre-crisis levels. However, unemployment, though having eased considerably to a 7-year low in 4Q16-1Q17, at just below 19% has remained the second highest in the EU, behind Greece and should remain a drag for years to come Spain – pc market by OEM (2010,13,15,16) Spain – real GDP and priv. consumption (2007-2019E) (*) VW group incl. Porsche. Source: ANFAC and CGA (UK) calculations Source: Oxford Economics, IMF and CGA (UK) estimates
- 10. Sabine CJ Blümel – Automotive Research 22/05/2017 CGA (UK) LLP sabine@cjblumel.com +44 7785 301 588 Page 10 UK – monthly SAAR1 vs. trend (Oct’08-Apr’17) UK – pc market by OEM (2010,13,15,16) (1) SAAR according to calculations by LMC Automotive. Source: SMMT, LMC Automotive and CGA (UK) calculations (*) VW group incl. Porsche. Source: SMMT and CGA (UK) calculations UK update -19.8% in April +1.1% in YTD In April, UK car registrations declined 19.8% yoy to 152.1k units, after having increased 8.4% in March, resulting in a 1.1% increase to 0.97m units YTD. This follows increases of 6.3% in 1Q17 and 2.3% to a record 2.69m in FY16, Increase in road tax for new cars purchased after 1st April… …has greatly distorted sales over the past few months While the vote for Brexit on 23rd June seems to have had little to no impact on the UK car market so far, the change and increase in road taxation for new cars purchased after 1st April has greatly distorted sales over the past few months. From 1st April, under the new system all new cars, except those with zero emissions (i.e. BEVs and hydrogen cars), are subject to a new vehicle excise duty (VED), an annual flat road tax. As expected, sales of new and pre-registered cars spiked and reached record levels in March and 1Q17 as buyers brought forward their car purchases, leading to a pay-back in April. YTD SAAR of 2.64m Indeed, in April, the SAAR fell sharply to 2.23m, down 21.1% mom/from March’s 2.83m and down 19.6% from 1Q17’s 2.78m; it thus remained 25.3% below December 2015’s all-time record SAAR of 2.99m. As a result, YTD SAAR of 2.64m was 1.9% below FY16’s 2.69m and 8.0% above pre-crisis LT level of 2.45m by 13.6%. The economy remained resilient in 2H16…. The UK economy remained resilient following the EU referendum and failed to decelerate in 2H16, from 0.6% in 2Q16 thanks to buoyant private consumption that was driven by a sharp increase in consumer borrowing. As a result, the FY16 GDP growth rate of 2.0% was in line with pre-referendum estimates, and only slightly lower than FY15’s 2.2%. Short-term outlook Short-term economic outlook: Economic indicators remain mixed but point to an economic slowdown; this is particularly true for the consumer sector. GDP growth decelerated in 1Q17, to 0.3% qoq, from 0.7% in 4Q16, due to a weakness in consumer-facing service-sector companies A weaker sterling set to bite UK economy from 2017 onwards Although having strengthened recently (due to hopes for a softer Brexit), sterling’s current trading position vs. pre-referendum level is still down 10% on a trade-weighted basis, 10% against the euro and 13% against the dollar. A weaker sterling together with firming energy prices is expected to continue to fuel consumer price inflation and squeeze disposable income and thus hamper private consumption. CPI is expected to continue to rise over the next 12 months, to average more than 3% in 2017, exceeding the BoE target of 2%. Indeed, the inflation rate rose from less than 0.5% in 1H16 and 0.8% in 2H16, to 2.7% in April. 1.8% in FY17E 1.3% in 2018E Market consensus forecast is that UK GDP growth will decelerate from +2.0% in FY16 to +1.8% in FY17E and 1.3% in 2018E and that private consumption will decelerate even more drastically, from 2.8% in FY16 to +1.9% in FY17E and 1.0% in 2018E.
- 11. Sabine CJ Blümel – Automotive Research 22/05/2017 CGA (UK) LLP sabine@cjblumel.com +44 7785 301 588 Page 11 UK – real GDP and priv. consumption (2007-19E) UK – pc registrations (1998-2019E) Source: Oxford Economics, IMF and CGA (UK) estimates Source: SMMT, LMC Automotive and CGA (UK) estimates UK – Consumer confidence (Jan’08-Apr’17) UK – Busines confidence (2Q14-2Q17) Source: GfK NOP (UK) through Trading Economics Source: CBI through Trading Economics Car market has decelearted since 2014… Even before the EU referendum, the UK car market had been approaching the end of its longest growth period on record. It had been driven by pent-up demand, easy credit, aggressive marketing and a continuing economic recovery, with GDP up 2.9% in 2014 and 2.2% in FY15. Falling petrol prices, zero inflation and accelerating earnings growth had turbo-charged consumer confidence to record levels and private consumption accelerated from 2.5% in FY14 to 2.9% in FY15. ...and is expected to have peaked in FY16 The slowdown in the UK market was heralded throughout 2015 by the fact that fleet/business sales have taken over from retail as market driver; a trend that intensified during 2016. Indeed, in FY16, retail sales dipped -0.2% and their share declined to 44.8%, down from 45.9% in FY15. In 1Q17, retail sales were up only 3.6%, reducing the 1Q17 retail share to 47.1% share, vs. 48.3% in 1Q16. In April, retail sales declined - 28.4% yoy to a 39.4% share. Weaker pound set to trigger hike in sticker prices Going forward, in addition to private consumption decelerating sharply, the UK car market is set to be affected by a weaker pound and the ensuing hike in car prices. Indeed, the UK car market is uniquely vulnerable to a weaker sterling as almost 90% of LVs/cars sold in the UK are imported. Even locally produced vehicles have a comparatively low domestic content. -5.5% to 2.54m in FY17E We expect that the UK car market will start to decline, by -5.5% to 2.54m in FY17E, after five years of growth. The change of road taxes for new cars is expected to continue to hamper car sales in the short term. In the medium term, challenges include Brexit and possibly tighter rules for car financing such as PCP (Personal Contract Purchasing). The FCA (Financial Conduct Authority) stated its intension to launch a review into finance packages offered to car buyers, due to concerns that there might be ‘irresponsible lending in the motor finance industry.
- 12. Sabine CJ Blümel – Automotive Research 22/05/2017 CGA (UK) LLP sabine@cjblumel.com +44 7785 301 588 Page 12 UK – Retail sales (Jan’08-Apr’17) UK – Manufacturing PMI (Jan’08-Apr17) Source: Office for National Statistics (UK) through Trading Economics Source: Markit/CIPS through Trading Economics GBP/USD (since 1/1/2016) GBP/EUR (since 1/1/2016) Source: Bank of England Source: Bank of England GBP trade-weighted index (since 1/1/2016) UK gilt - 10-year yield (%) (since 1/1/2016) Source: Bank of England Source: Bank of England This document has been prepared by Creative Global Advisers (UK) LLP (‘CGA (UK)’) solely for the use of its clients and for purely informational purposes. It does not constitute or contain advice on the merits of investing in any investment nor does it constitute or form part of a prospectus or any such offer or invitation to sell or to issue, or any solicitation of any offer to invest in, any investment, nor shall it or any part of it or the fact of its distribution form the basis of, or be relied on in connection with, any such offer, invitation or solicitation, nor constitute any contract therefore. Neither CGA (UK) nor any of its members or employees give any representation or warranty, express or implied, as to the fairness, accuracy, completeness or correctness of any information or expressions of opinion contained in this document. This document, insofar as it is distributed in or into the United Kingdom, is for distribution only to persons to whom the financial promotion restriction in section 21(1) Financial Services and Markets Act 2000 does not apply by virtue of the Financial Services and Markets Act 2000 (Financial Promotion) Order 2005 (SI 2005/1529) (the ‘Financial Promotion Order’). This document is directed at Investment Professionals as defined in article 19 of the Financial Promotion Order who have professional experience in matters relating to investments. Persons who do not have professional experience in matters relating to investments should not rely on this document. The contents of this document have not been approved by an authorised person. The distribution of this document in other jurisdictions may be restricted by law and persons into whose possession this document comes should inform themselves of, and observe, any such restrictions. Any failure to comply with these restrictions may constitute a violation of the laws of any other such jurisdictions.