More Related Content
Similar to CFS-OP01 pdf (20)
CFS-OP01 pdf
- 1. o
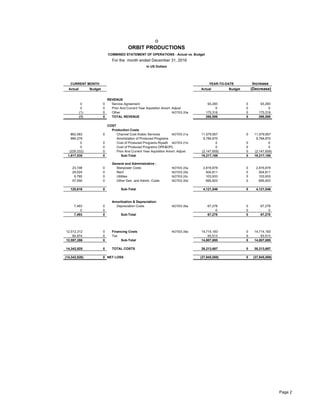
ORBIT PRODUCTIONS
COMBINED STATEMENT OF OPERATIONS - Actual vs. Budget
For the month ended December 31, 2016
In US Dollars
CURRENT MONTH YEAR-TO-DATE Increase
Actual Budget Actual Budget (Decrease)
REVENUE
0 0 Service Agreement 93,283 0 93,283
0 0 Prior And Current Year Aquisition Amort. Adjust 0 0 0
(1) 0 Other NOTES 20a 175,316 0 175,316
(1) 0 TOTAL REVENUE 268,599 0 268,599
COST
Production Costs
862,583 0 Channel Cost Arabic Services NOTES 21a 11,579,957 0 11,579,957
984,279 Amortization of Produced Programs 9,784,870 9,784,870
0 0 Cost of Produced Programs Riyadh NOTES 21b 0 0 0
0 0 Cost of Produced Programs OPE&OPL 0 0 0
(229,332) 0 Prior And Current Year Aquisition Amort. Adjust (2,147,659) 0 (2,147,659)
1,617,530 0 Sub-Total 19,217,168 0 19,217,168
General and Administrative :
23,748 0 Manpower Costs NOTES 25a 2,816,879 0 2,816,879
29,524 0 Rent NOTES 25b 504,811 0 504,811
9,795 0 Utilities NOTES 25c 103,933 0 103,933
57,550 0 Other Gen. and Admin. Costs NOTES 20d 695,923 0 695,923
120,616 0 Sub-Total 4,121,546 0 4,121,546
Amortization & Depreciation:
7,493 0 Depreciation Costs NOTES 26a 67,278 0 67,278
0 0 0 0 0
7,493 0 Sub-Total 67,278 0 67,278
12,512,312 0 Financing Costs NOTES 28a 14,714,183 0 14,714,183
84,974 0 Tax 93,513 0 93,513
12,597,286 0 Sub-Total 14,807,695 0 14,807,695
14,342,925 0 TOTAL COSTS 38,213,687 0 38,213,687
(14,342,926) 0 NET LOSS (37,945,089) 0 (37,945,089)
Page 2
- 2. o
ORBIT PRODUCTIONS
COMBINED STATEMENT OF OPERATIONS
For the month ended December 31, 2016
In US Dollars
ACTUAL
YEAR-TO-DATE CURRENT MONTH Increase
Notes ACTUAL 31-12-2016 30-11-2016 (Decrease)
REVENUE
Service Agreement NOTES 20a 93,283 0 44,223 (44,223)
Prior And Current Year Aquisition Amort. Adjust 0 0 0 0
Other NOTES 20b 175,316 (1) (1) 0
TOTAL REVENUE 20 268,599 (1) 44,222 (44,223)
COST
Production Costs
Channel Cost Arabic Services NOTES 21a 11,579,957 862,583 949,853 (87,270)
Amortization of Produced Programs 9,784,870 984,279 555,571 428,708
Cost of Produced Programs Riyadh NOTES 21b 0 0 0 0
Cost of Produced Programs OPE&OPL 0 0 0 0
Prior And Current Year Aquisition Amort. Adjust (2,147,659) (229,332) (147,025) (82,307)
Sub-Total 21 19,217,168 1,617,530 1,358,399 259,131
General and Administrative :
Manpower Costs NOTES 25a 2,816,879 23,748 220,516 (196,768)
Rent NOTES 25b 504,811 29,524 33,763 (4,240)
Utilities NOTES 25c 103,933 9,795 15,038 (5,244)
Other Gen. and Admin. Costs NOTES 20d 695,923 57,550 54,640 2,910
Sub-Total 25 4,121,546 120,616 323,958 (203,341)
Amortization & Depreciation:
Depreciation Costs NOTES 26a 67,278 7,493 6,983 510
Sub-Total 26 67,278 7,493 6,983 510
Financing Costs 14,714,183 12,512,312 (102,932) 12,615,244
Tax 93,513 84,974 3,069 81,905
Sub-Total 28 14,807,695 12,597,286 (99,863) 12,697,149
TOTAL COSTS 38,213,687 14,342,925 1,589,477 12,753,448
NET LOSS (37,945,089) (14,342,926) (1,545,255) (12,797,671)
Page 3
- 3. o
ORBIT PRODUCTIONS
COMBINED BALANCE SHEET
For the month ended December 31, 2016
In US Dollars
Increase
31-Dec-15 Notes 31-Dec-16 30-Nov-16 (Decrease)
CURRENT ASSETS:
986,688 CASH 1 517,899 156,697 361,202
ACCOUNTS RECEIVABLE
1,572,044 PREPAYMENTS & OTHER RECEIVABLES 3 2,894,549 3,037,496 (142,948)
90,355,418 INTERCOMPANY & AFFILIATES-(OCC) 4 85,277,718 84,563,979 713,739
21,471,532 DUE FROM / (TO) AFFILIATES & RELATED PARTIES 5 21,496,248 21,494,885 1,364
0 NOTES AND ADVANCES PAYABLE TO AFFILIATE 7 0 0 0
2,373 INVENTORY - NET 1,534 1,883 (349)
753,734 PROGRAM RIGHTS INVENTORY - MG 8 300,302 311,460 (11,158)
0 PROGRAM RIGHTS INVENTORY - NET 9 0 0 0
115,141,789 TOTAL CURRENT ASSETS 110,488,251 109,566,400 921,851
257,459 FIXED ASSETS - NET 10 1,313,208 1,126,528 186,680
1,023 DEFERRED COSTS & OTHERS - NET 11 9,535 10,141 (606)
115,400,272 TOTAL ASSETS 111,810,994 110,703,069 1,107,925
LIABILITIES & SHAREHOLDERS' DEFICIT
CURRENT LIABILITIES:
3,560,007 ACCOUNTS PAYABLE 12 3,749,199 3,995,246 (246,047)
3,566,226 ACCRUED EXPENSES AND OTHER LIABILITIES 13 5,477,988 4,995,936 482,052
0 LIABILITY FOR PROGRAM RIGHTS 15 0 0 0
250,492,839 INTERCOMPANY PAYABLE - (OCC) 4 261,255,767 259,271,268 1,984,499
55,336,251 DUE TO AFFILIATES & RELATED PARTIES 5 60,853,893 60,399,929 453,963
312,955,322 TOTAL CURRENT LIABILITIES 331,336,847 328,662,379 2,674,468
NON CURRENT LIABILITIES:
4,176,681 SERVICE INDEMNITY 13 3,743,056 4,080,284 (337,228)
15,000,000 Restrcturing Provision 15,000,000 15,000,000 0
83,514,741 NOTES AND ADVANCES PAYABLE TO AFFILIATE 16 83,631,574 83,631,574 0
102,691,422 TOTAL NON CURRENT LIABILITIES 102,374,631 102,711,859 (337,228)
SHAREHOLDERS' DEFICIT:
40,000 SHARE CAPITAL 40,000 40,000 0
708 LEGAL RESERVE 708 708 0
2,953,631 Foreign Currency Translation Adjustment 19,244,706 6,131,098 13,113,608
0 PRIOR YEAR ADJUSTEMNT 0 0 0
(262,843,463) ACCUMULATED DEFICIT (303,240,811) (303,240,811) 0
(40,397,349) CURRENT YEAR LOSS (37,945,089) (23,602,163) (14,342,926)
(300,246,472) TOTAL SHAREHOLDERS' DEFICIT (321,900,486) (320,671,168) (1,229,318)
115,400,272 TOTAL LIABILITIES & SHAREHOLDERS' DEFICIT 111,810,991 110,703,069 1,107,922
Page 4