Download to read offline


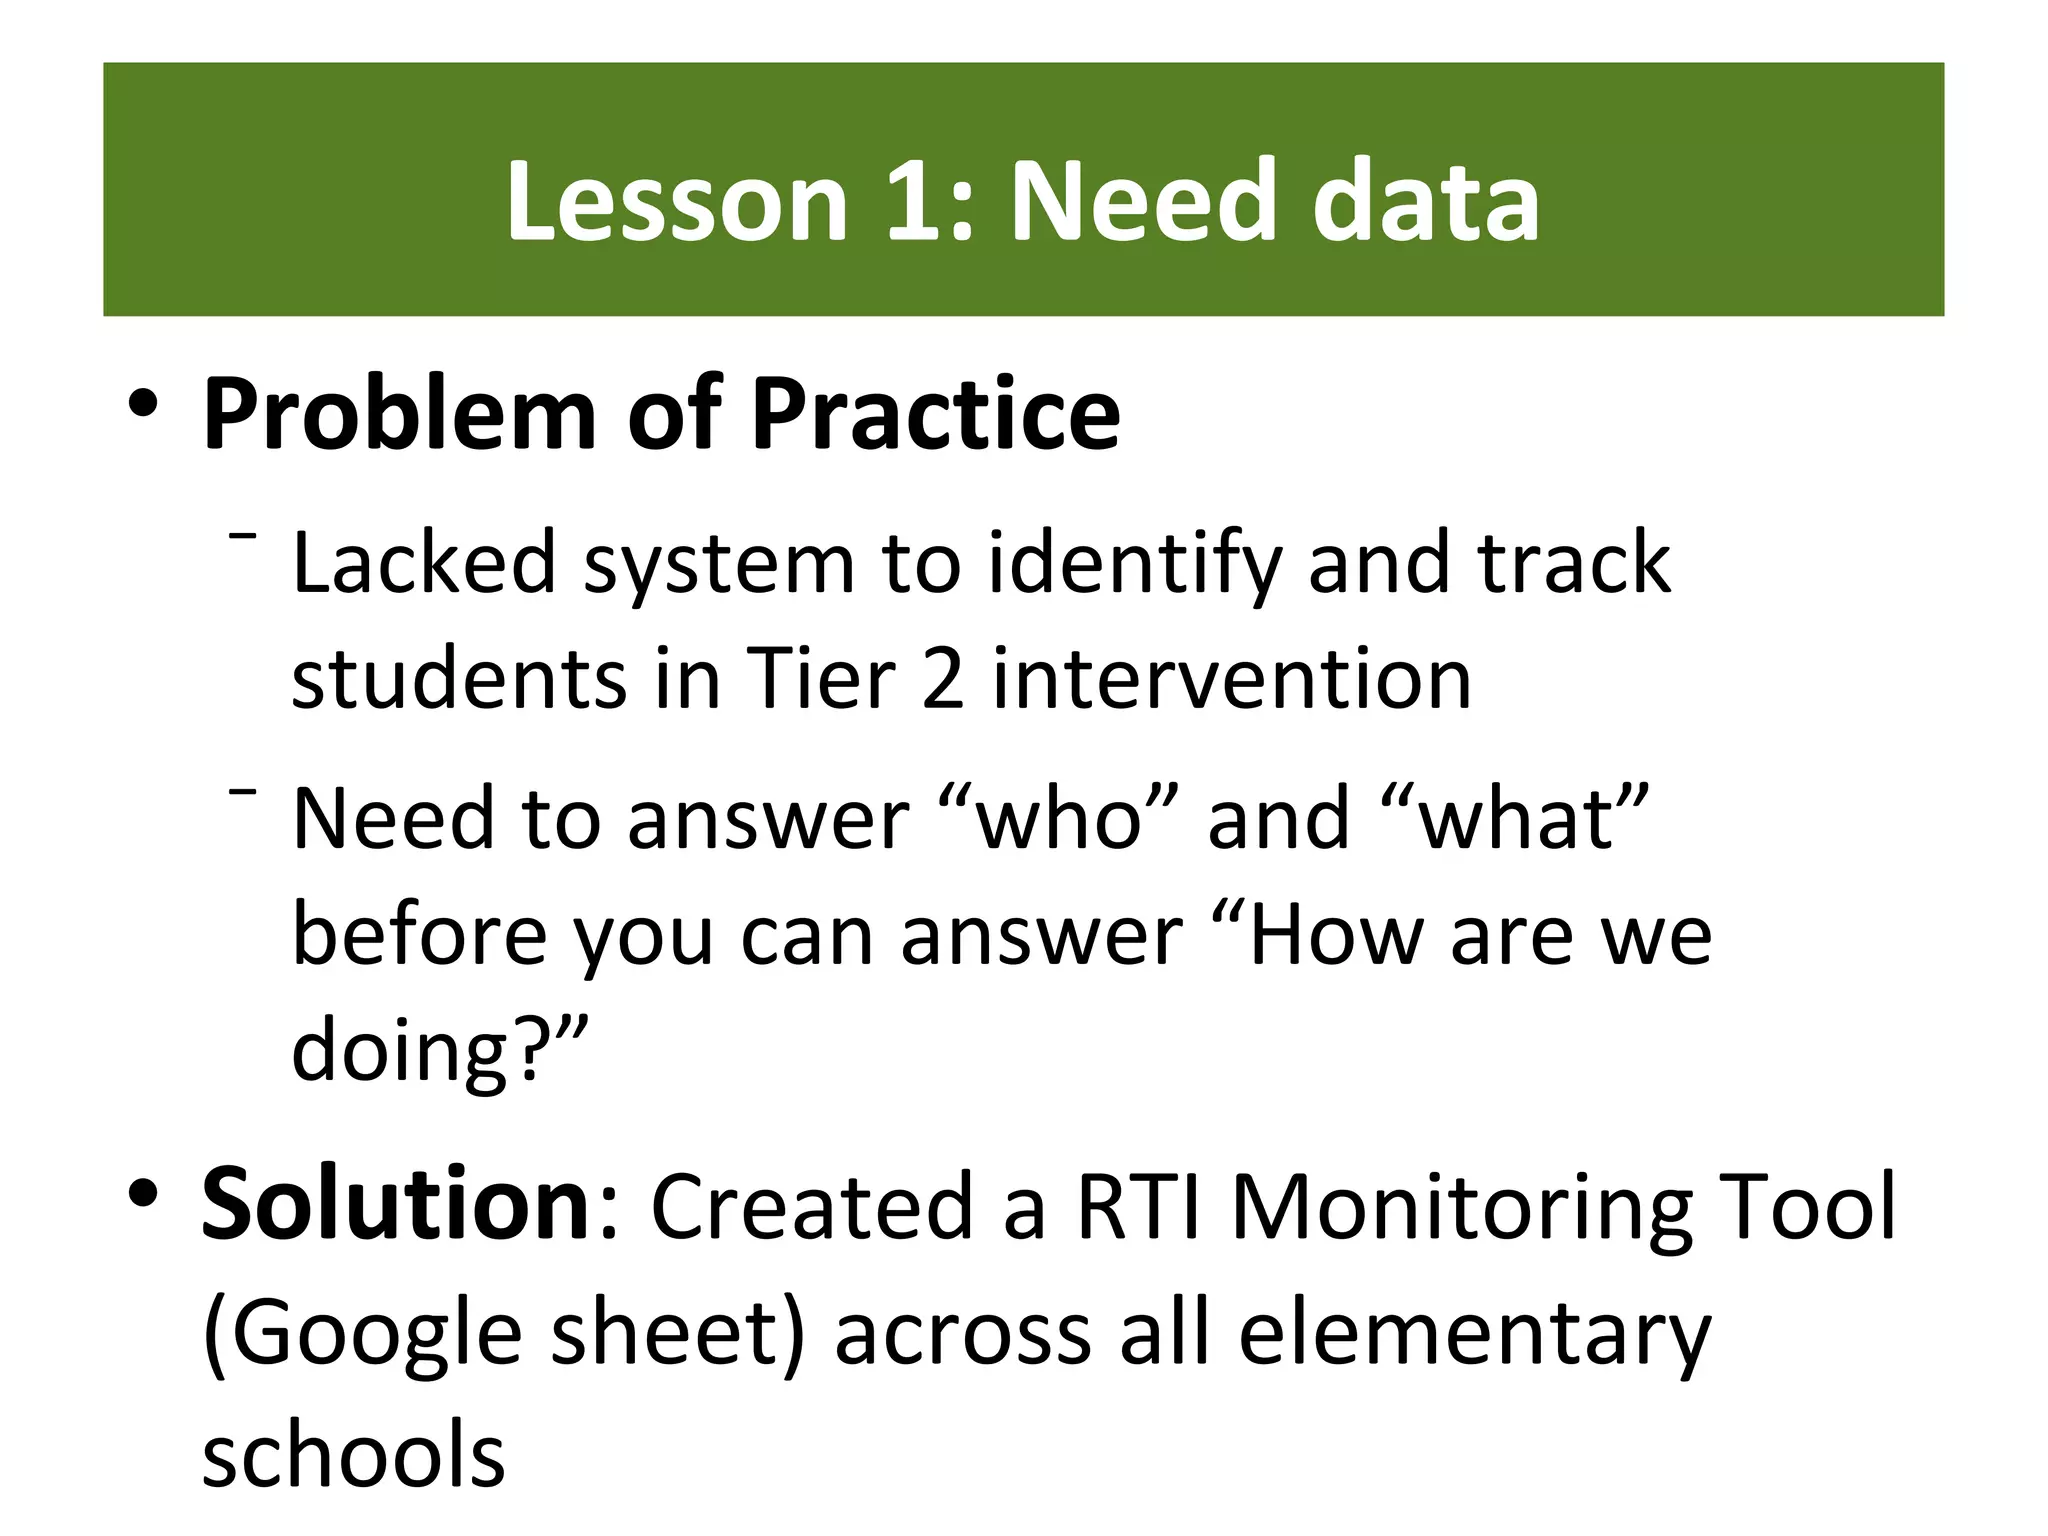


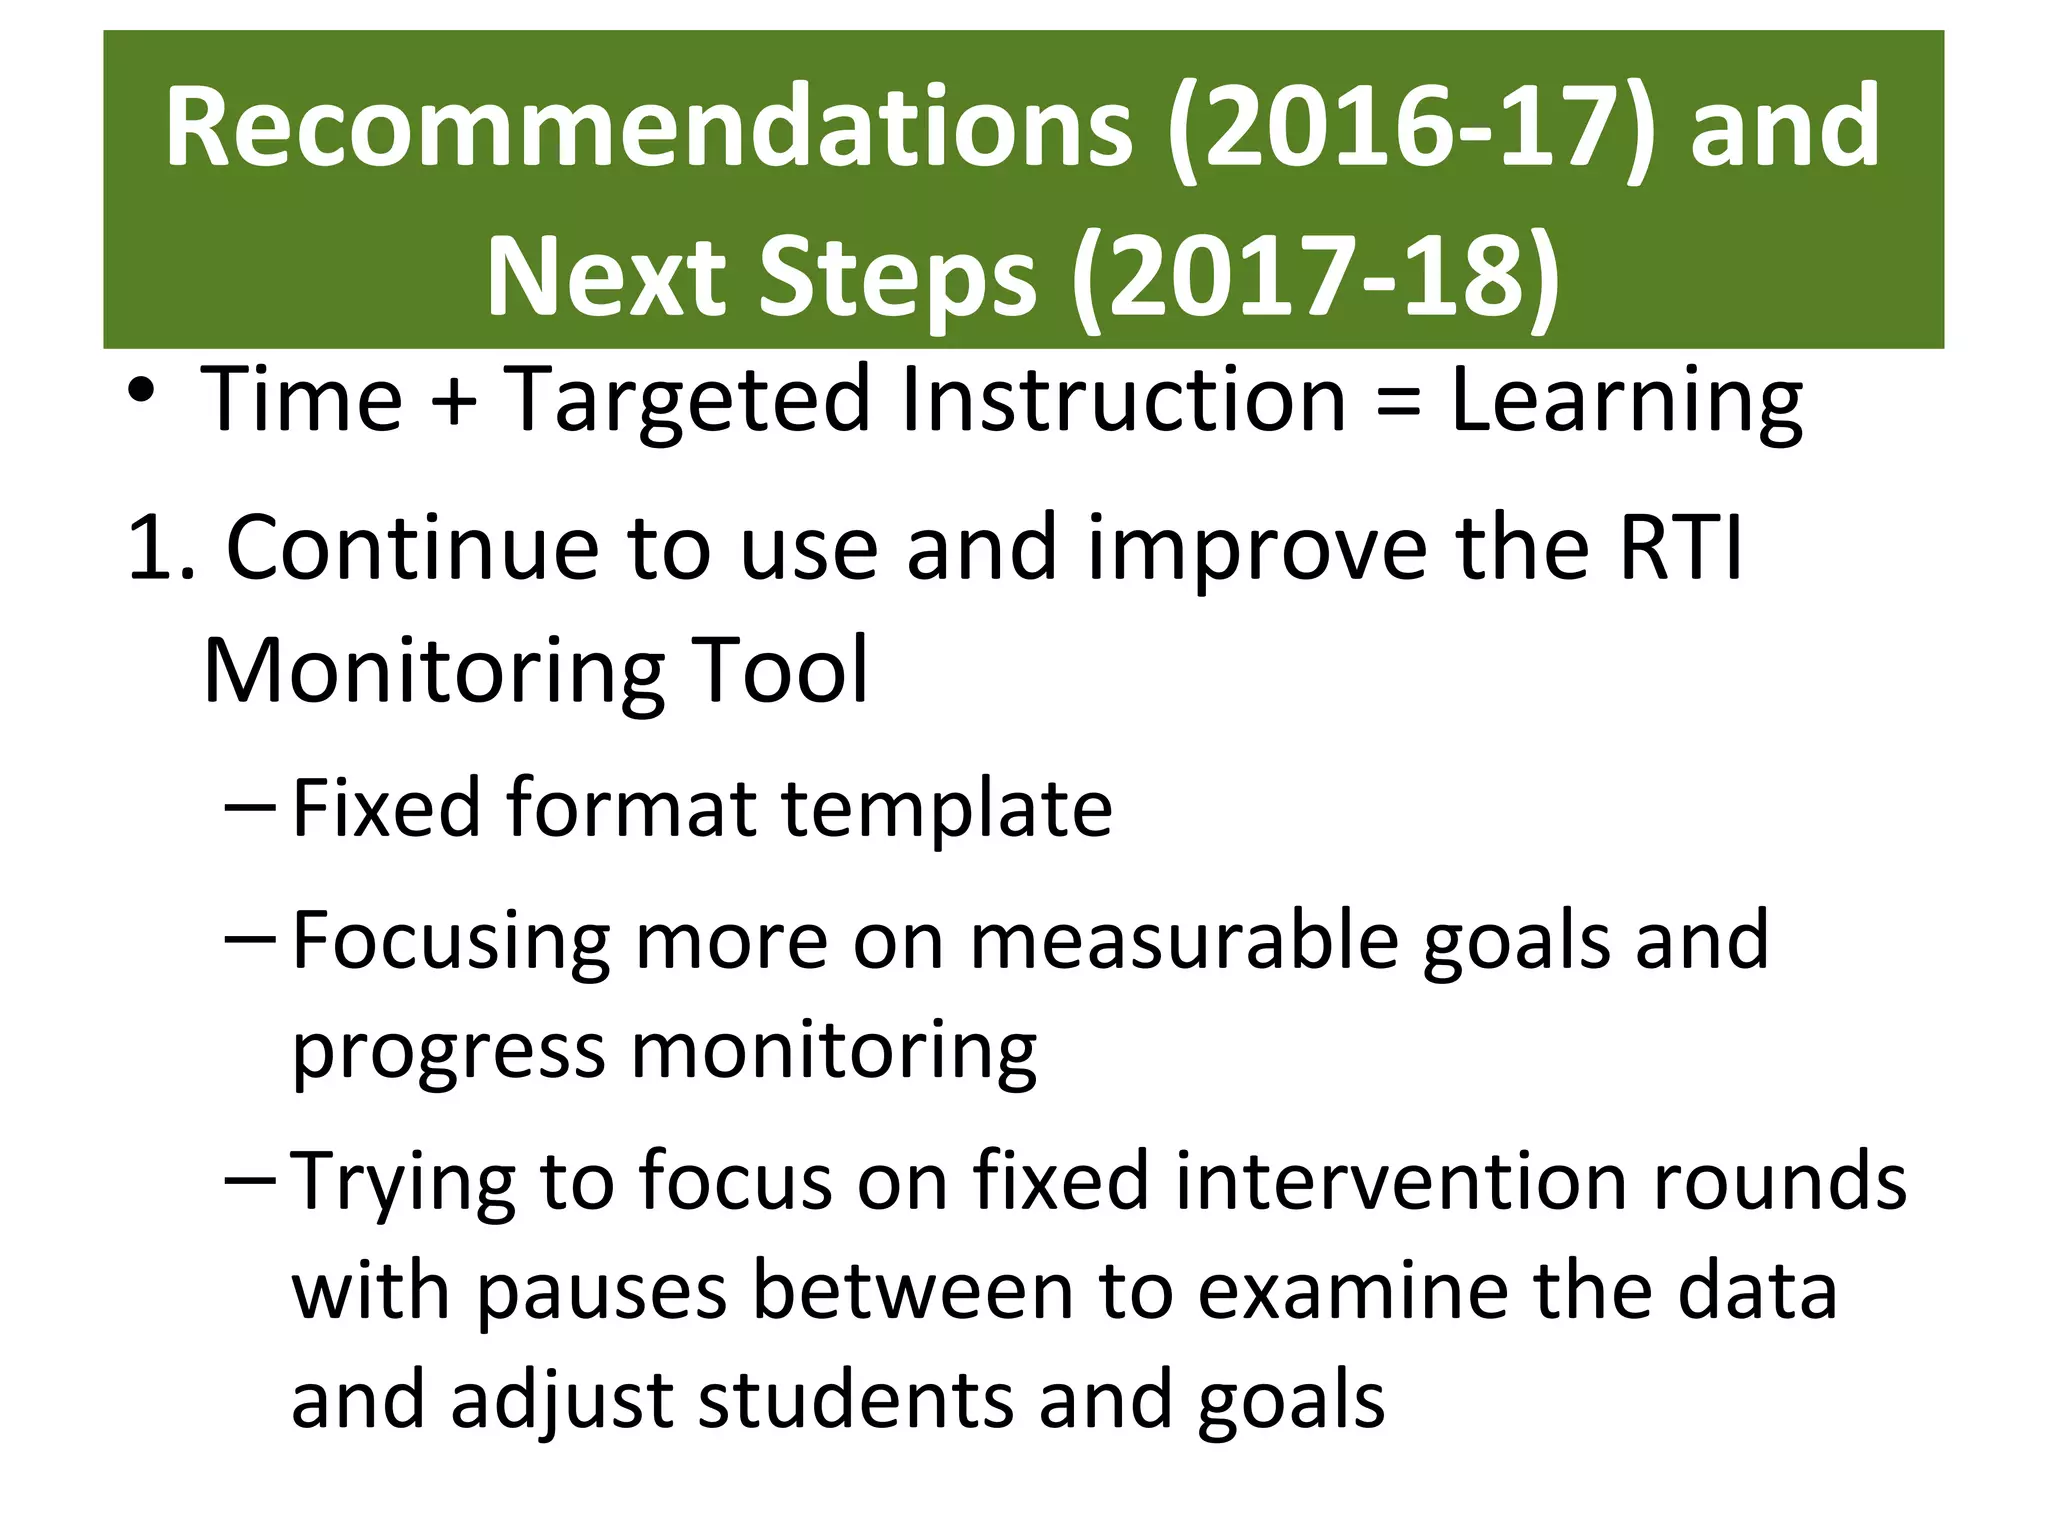


The document summarizes the findings of a program evaluation conducted by the Palo Alto Unified School District (PAUSD) to evaluate and improve their Response to Intervention (RTI) and Multi-Tiered System of Support (MTSS) programs. Some key findings included: (1) the need for better data collection tools to track students receiving RTI services, (2) variability in eligibility criteria that has led to more standardized criteria, and (3) implementation challenges around staffing, transportation, and intervention fidelity. Recommendations focused on continuing to improve data tools, prioritizing students below benchmarks, supporting intervention quality, and expanding MTSS district-wide with the goal of improving student outcomes.


![Response to intervention presentation 9 9-14 [autosaved]](https://cdn.slidesharecdn.com/ss_thumbnails/responsetointerventionpresentation9-9-14autosaved-140928104040-phpapp01-thumbnail.jpg?width=640&height=640&fit=bounds)


