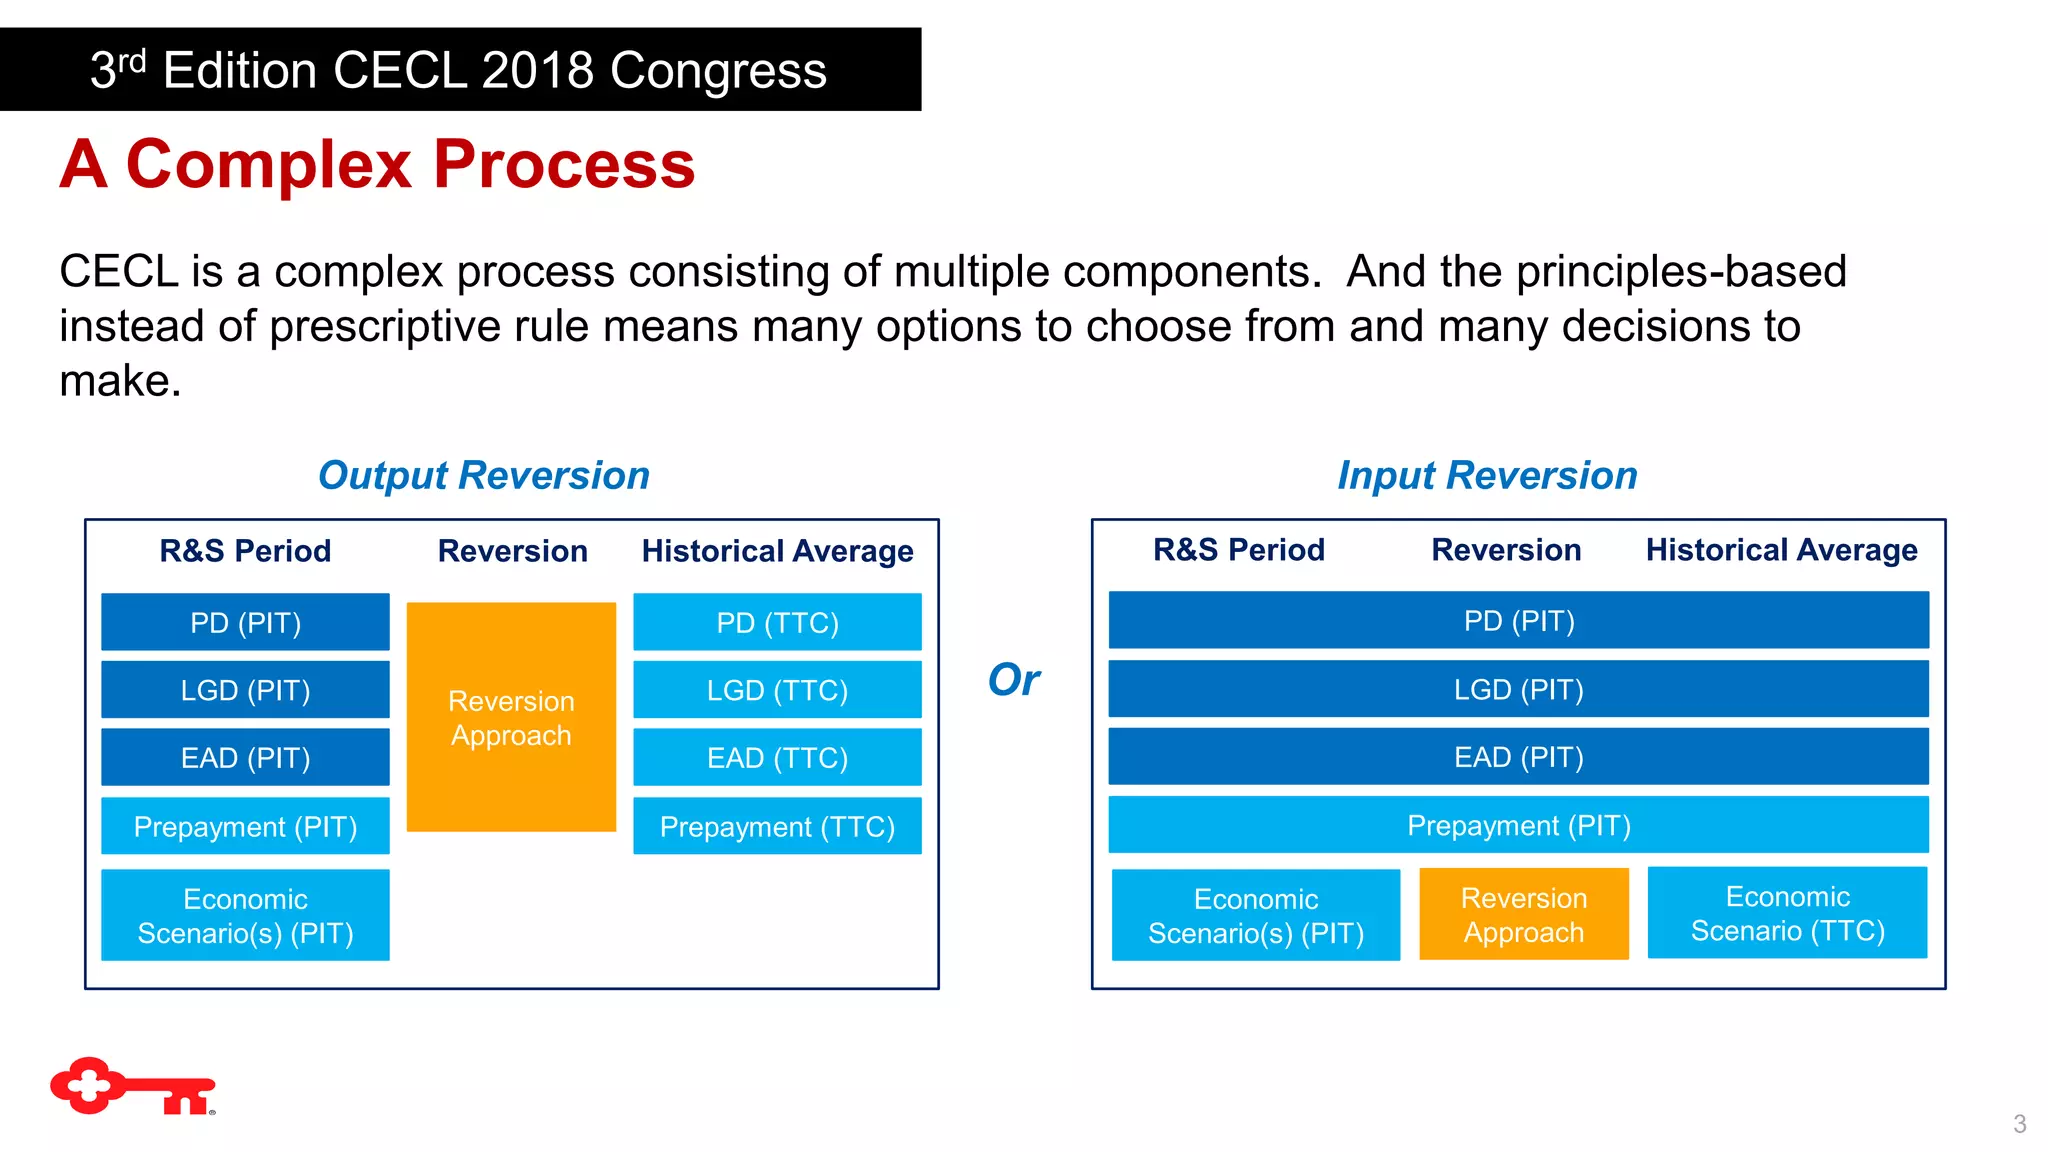
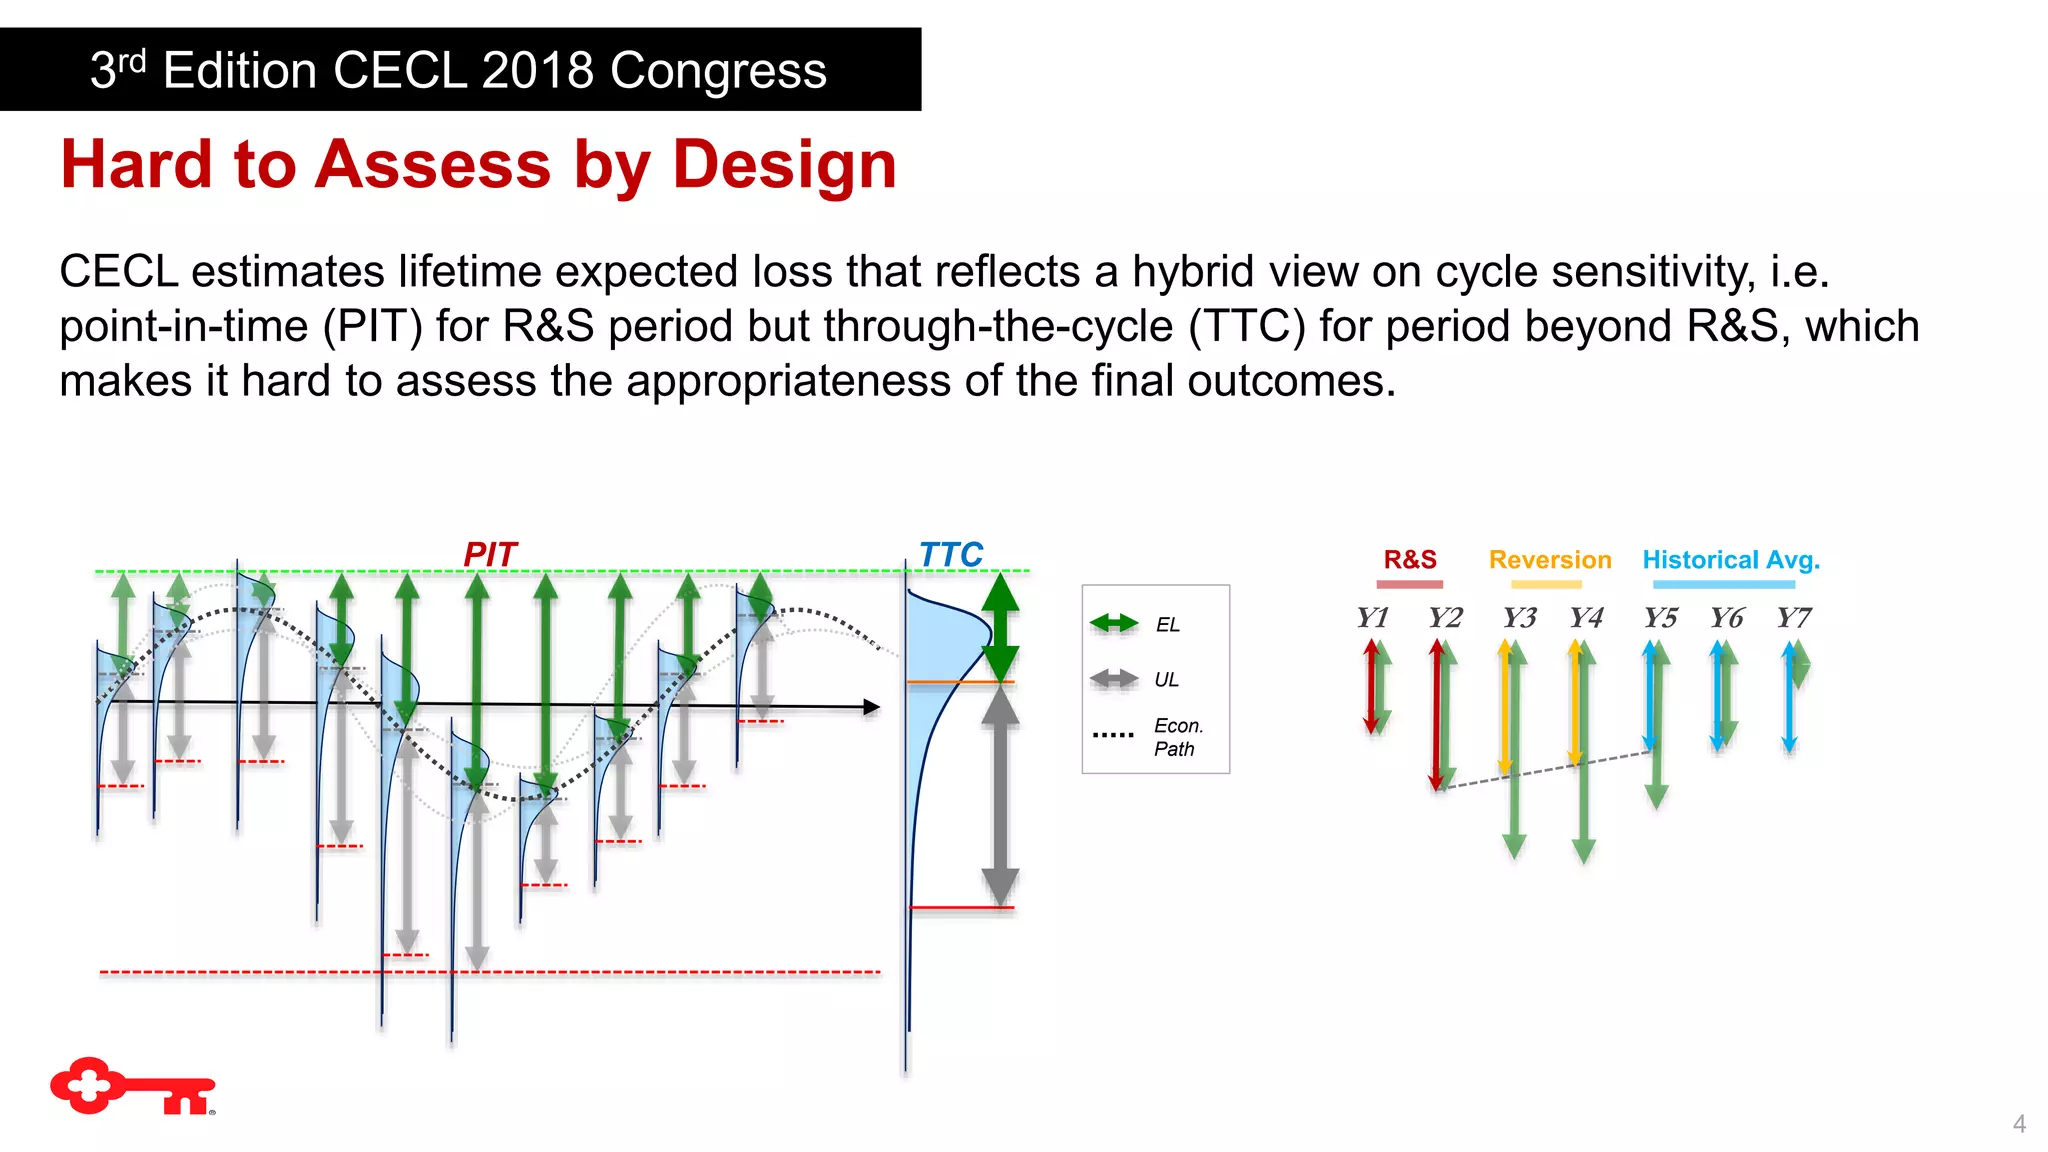
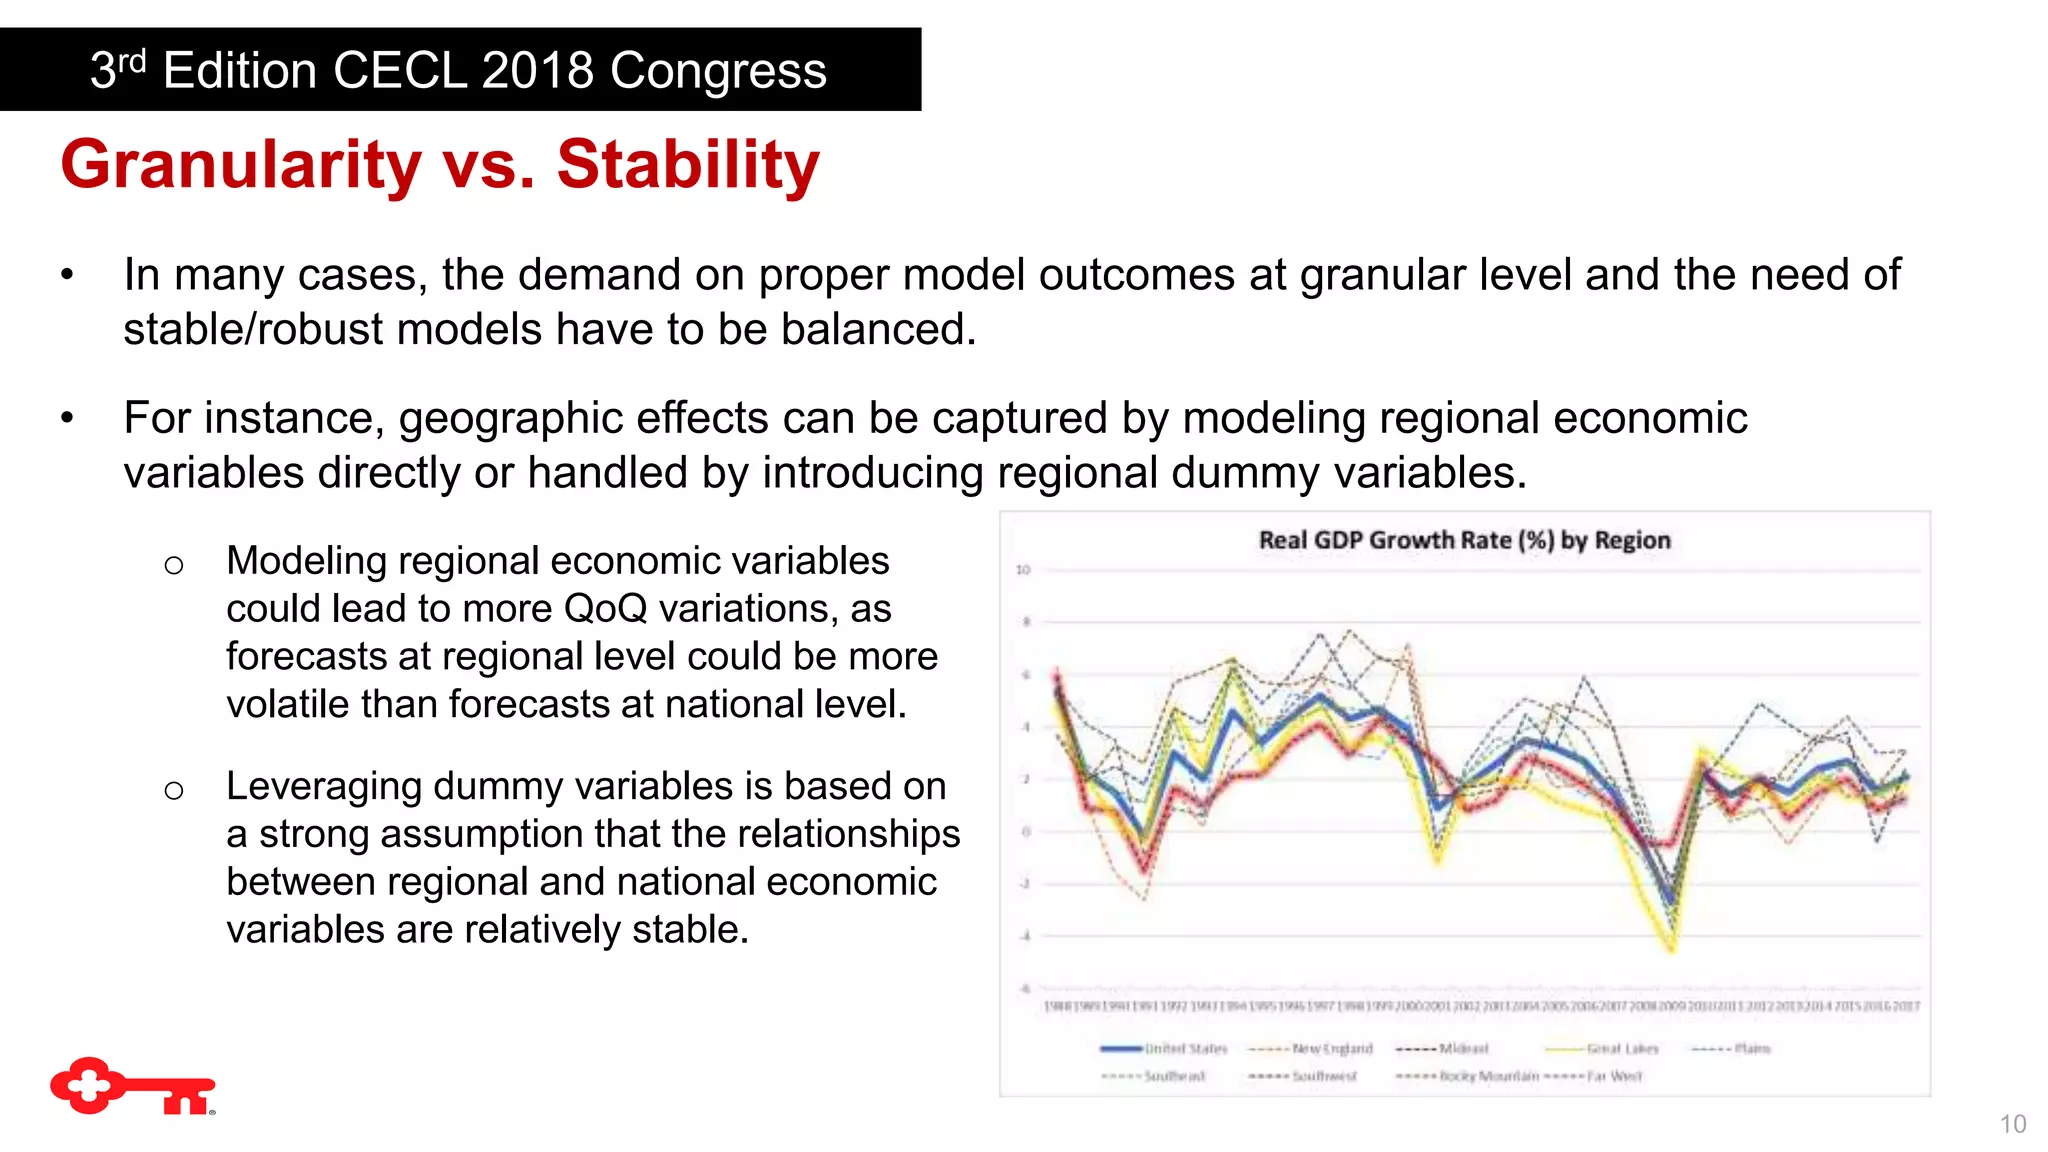
Current Expected Credit Loss (CECL)
Performance Assessment
October 24th, 2018
Xiaoling (Sean) Yu
SVP, Director of Model Validation
KeyBank
3rd Edition CECL 2018 Congress
2
Disclaimer
The views expressed in this presentation are those of the
speaker and do not necessarily reflect the views of
KeyCorp or its subsidiaries in all respects.
3rd Edition CECL 2018 Congress
3
A Complex Process
CECL is a complex process consisting of multiple components. And the principles-based
instead of prescriptive rule means many options to choose from and many decisions to
make.
3rd Edition CECL 2018 Congress
Output Reversion
PD (PIT)
LGD (PIT)
EAD (PIT)
Prepayment (PIT)
Economic
Scenario(s) (PIT)
R&S Period Reversion Historical Average
Reversion
Approach
PD (TTC)
LGD (TTC)
EAD (TTC)
Prepayment (TTC)
PD (PIT)
LGD (PIT)
EAD (PIT)
Prepayment (PIT)
Reversion
Approach
Economic
Scenario(s) (PIT)
Economic
Scenario (TTC)
R&S Period Reversion Historical Average
Input Reversion
Or
4
Hard to Assess by Design
3rd Edition CECL 2018 Congress
PIT TTC
EL
UL
Econ.
Path
R&S
Y1 Y2 Y3 Y4 Y5 Y6 Y7
Reversion Historical Avg.
CECL estimates lifetime expected loss that reflects a hybrid view on cycle sensitivity, i.e.
point-in-time (PIT) for R&S period but through-the-cycle (TTC) for period beyond R&S, which
makes it hard to assess the appropriateness of the final outcomes.
5
Components: Back-testing
• While focusing on ensuring proper conservativeness during stress periods for CCAR
models, back-testing for CECL models focuses on whether outcomes are reasonable
and unbiased through the cycle.
• Within R&S period, back-testing of credit loss models and prepayment assumptions are
conducted to understand the potential ranges of errors or any delays in capturing the
trends.
• If leveraging the input reversion approach, back-testing is conducted to assess whether
feeding TTC economic scenario into the PIT credit loss models and prepayment
assumptions will give reasonable outcomes (i.e. the non-linearity concern).
• When the input reversion approach is leveraged, should the PIT credit loss models and
prepayment assumptions be tested over the lifetime of the loans?
3rd Edition CECL 2018 Congress
6
Components: Back-testing (cont’d)
• The Federal Open Market Committee
(FOMC)’s Summary of Economic
Projections (SEP) reports the root mean
squared errors (RMSEs) of real-time
forecasts over the past 20 years made by a
group of leading private and public sector
forecasters.
• Shaded bands show median SEP forecasts
(as of September 2016) ± average
historical RMSE at the appropriate forecast
horizon, which cover approximately 70%
future outcomes assuming future
prediction errors are stable, unbiased and
normally distributed.
Source: Reifschneider and Tulip (2017)
3rd Edition CECL 2018 Congress
• The accuracy of economic forecasting also need to be assess to understand the potential
range of errors, especially the ability to forecast the turning points.
7
Components: Sensitivity and Scenario Analyses
• While focusing on assessing proper separation between different scenarios for CCAR
models, scenario analysis for CECL models should focus on whether the models will
make reasonable projections under different economic cycles.
• A key limitation of CECL (and CCAR) models is that most banks have just one or two
cycles of historical data. Good back-testing results can only ensure proper model
performance if the future will resemble the past.
3rd Edition CECL 2018 Congress
• However, every cycle is a bit unique.
Sensitivity and scenario analyses are
critical to assess the robustness of the
models and help establish the boundaries
of model performance, which provide the
foundation for proper ongoing monitoring
and model overlay/adjustment processes.
Statistics of US Business Cycles since 1945
Contraction Expansion
Peak to Trough
Previous trough
to
this peak
Trough from
Previous
Trough
Peak from
Pervious
Peak
Mean 11 60 71 71
STD 4 34 33 35
Min 6 12 28 18
Max 18 120 128 128
Data Source: https://www.nber.org/cycles.html
Cycle
8
Putting Everything Together
• “Back-testing”: Estimating lifetime loss under actual economic scenarios (at different
points of the cycle) for R&S period, and reverting to historical average as designed
• Scenario Analyses: Estimating lifetime loss under hypothetic economic scenarios (at
different points of the cycle) for R&S period, and reverting to historical average as
designed
• Sensitivity Analyses of qualitative options/decisions:
o Impacts of different R&S Periods, Reversion Periods, and Reversion approaches
o Impacts of economic forecast errors
o Comparison between single or multiple economic forecast scenarios
3rd Edition CECL 2018 Congress
9
Granular Level Assessments
• CECL outcomes need to be assessed at granular level:
o To support the disclosure requirements about credit risk by credit quality indicators
and years of the asset’s origination (i.e. vintage)
o To support attribution analyses of quarter over quarter (QoQ) variations by key risk
drivers (e.g. FICO, LTV, internal risk rating, industry, etc.)
• The aforementioned back-testing, sensitivity and scenario analyses need to be reviewed
at granular level by key risk drivers for any counterintuitive outcomes.
• Many modeling assumptions against data limitations (e.g. applying models developed on
legacy data to newly acquired portfolios) need to be assessed in a similar fashion.
3rd Edition CECL 2018 Congress
10
Granularity vs. Stability
• In many cases, the demand on proper model outcomes at granular level and the need of
stable/robust models have to be balanced.
• For instance, geographic effects can be captured by modeling regional economic
variables directly or handled by introducing regional dummy variables.
3rd Edition CECL 2018 Congress
o Modeling regional economic variables
could lead to more QoQ variations, as
forecasts at regional level could be more
volatile than forecasts at national level.
o Leveraging dummy variables is based on
a strong assumption that the relationships
between regional and national economic
variables are relatively stable.
11
Qualitative Adjustments
• Most of the current qualitative adjustment factors (e.g. changes in lending practices,
economic conditions, portfolio credit quality, etc.) are covered by the CECL models.
• Although not directly covered by the CECL models, the remaining factors (e.g. changes
in the ability of lending management, the quality of loan review system, and regulatory
requirements) all indirectly affect the fit-for-use of the models, and therefore should be
closely monitored from model risk management perspective.
• How to effectively integrate model risk management and ALLL for overseeing qualitative
adjustments, from governance and procedure perspectives, needs to be thought
through.
• The aforementioned performance assessments can help evaluate the needs and
prioritize the efforts.
3rd Edition CECL 2018 Congress
12
THANK YOU
3rd Edition CECL 2018 Congress

CECL Performance Assessment

  • 1.
    Current Expected CreditLoss (CECL) Performance Assessment October 24th, 2018 Xiaoling (Sean) Yu SVP, Director of Model Validation KeyBank 3rd Edition CECL 2018 Congress
  • 2.
    2 Disclaimer The views expressedin this presentation are those of the speaker and do not necessarily reflect the views of KeyCorp or its subsidiaries in all respects. 3rd Edition CECL 2018 Congress
  • 3.
    3 A Complex Process CECLis a complex process consisting of multiple components. And the principles-based instead of prescriptive rule means many options to choose from and many decisions to make. 3rd Edition CECL 2018 Congress Output Reversion PD (PIT) LGD (PIT) EAD (PIT) Prepayment (PIT) Economic Scenario(s) (PIT) R&S Period Reversion Historical Average Reversion Approach PD (TTC) LGD (TTC) EAD (TTC) Prepayment (TTC) PD (PIT) LGD (PIT) EAD (PIT) Prepayment (PIT) Reversion Approach Economic Scenario(s) (PIT) Economic Scenario (TTC) R&S Period Reversion Historical Average Input Reversion Or
  • 4.
    4 Hard to Assessby Design 3rd Edition CECL 2018 Congress PIT TTC EL UL Econ. Path R&S Y1 Y2 Y3 Y4 Y5 Y6 Y7 Reversion Historical Avg. CECL estimates lifetime expected loss that reflects a hybrid view on cycle sensitivity, i.e. point-in-time (PIT) for R&S period but through-the-cycle (TTC) for period beyond R&S, which makes it hard to assess the appropriateness of the final outcomes.
  • 5.
    5 Components: Back-testing • Whilefocusing on ensuring proper conservativeness during stress periods for CCAR models, back-testing for CECL models focuses on whether outcomes are reasonable and unbiased through the cycle. • Within R&S period, back-testing of credit loss models and prepayment assumptions are conducted to understand the potential ranges of errors or any delays in capturing the trends. • If leveraging the input reversion approach, back-testing is conducted to assess whether feeding TTC economic scenario into the PIT credit loss models and prepayment assumptions will give reasonable outcomes (i.e. the non-linearity concern). • When the input reversion approach is leveraged, should the PIT credit loss models and prepayment assumptions be tested over the lifetime of the loans? 3rd Edition CECL 2018 Congress
  • 6.
    6 Components: Back-testing (cont’d) •The Federal Open Market Committee (FOMC)’s Summary of Economic Projections (SEP) reports the root mean squared errors (RMSEs) of real-time forecasts over the past 20 years made by a group of leading private and public sector forecasters. • Shaded bands show median SEP forecasts (as of September 2016) ± average historical RMSE at the appropriate forecast horizon, which cover approximately 70% future outcomes assuming future prediction errors are stable, unbiased and normally distributed. Source: Reifschneider and Tulip (2017) 3rd Edition CECL 2018 Congress • The accuracy of economic forecasting also need to be assess to understand the potential range of errors, especially the ability to forecast the turning points.
  • 7.
    7 Components: Sensitivity andScenario Analyses • While focusing on assessing proper separation between different scenarios for CCAR models, scenario analysis for CECL models should focus on whether the models will make reasonable projections under different economic cycles. • A key limitation of CECL (and CCAR) models is that most banks have just one or two cycles of historical data. Good back-testing results can only ensure proper model performance if the future will resemble the past. 3rd Edition CECL 2018 Congress • However, every cycle is a bit unique. Sensitivity and scenario analyses are critical to assess the robustness of the models and help establish the boundaries of model performance, which provide the foundation for proper ongoing monitoring and model overlay/adjustment processes. Statistics of US Business Cycles since 1945 Contraction Expansion Peak to Trough Previous trough to this peak Trough from Previous Trough Peak from Pervious Peak Mean 11 60 71 71 STD 4 34 33 35 Min 6 12 28 18 Max 18 120 128 128 Data Source: https://www.nber.org/cycles.html Cycle
  • 8.
    8 Putting Everything Together •“Back-testing”: Estimating lifetime loss under actual economic scenarios (at different points of the cycle) for R&S period, and reverting to historical average as designed • Scenario Analyses: Estimating lifetime loss under hypothetic economic scenarios (at different points of the cycle) for R&S period, and reverting to historical average as designed • Sensitivity Analyses of qualitative options/decisions: o Impacts of different R&S Periods, Reversion Periods, and Reversion approaches o Impacts of economic forecast errors o Comparison between single or multiple economic forecast scenarios 3rd Edition CECL 2018 Congress
  • 9.
    9 Granular Level Assessments •CECL outcomes need to be assessed at granular level: o To support the disclosure requirements about credit risk by credit quality indicators and years of the asset’s origination (i.e. vintage) o To support attribution analyses of quarter over quarter (QoQ) variations by key risk drivers (e.g. FICO, LTV, internal risk rating, industry, etc.) • The aforementioned back-testing, sensitivity and scenario analyses need to be reviewed at granular level by key risk drivers for any counterintuitive outcomes. • Many modeling assumptions against data limitations (e.g. applying models developed on legacy data to newly acquired portfolios) need to be assessed in a similar fashion. 3rd Edition CECL 2018 Congress
  • 10.
    10 Granularity vs. Stability •In many cases, the demand on proper model outcomes at granular level and the need of stable/robust models have to be balanced. • For instance, geographic effects can be captured by modeling regional economic variables directly or handled by introducing regional dummy variables. 3rd Edition CECL 2018 Congress o Modeling regional economic variables could lead to more QoQ variations, as forecasts at regional level could be more volatile than forecasts at national level. o Leveraging dummy variables is based on a strong assumption that the relationships between regional and national economic variables are relatively stable.
  • 11.
    11 Qualitative Adjustments • Mostof the current qualitative adjustment factors (e.g. changes in lending practices, economic conditions, portfolio credit quality, etc.) are covered by the CECL models. • Although not directly covered by the CECL models, the remaining factors (e.g. changes in the ability of lending management, the quality of loan review system, and regulatory requirements) all indirectly affect the fit-for-use of the models, and therefore should be closely monitored from model risk management perspective. • How to effectively integrate model risk management and ALLL for overseeing qualitative adjustments, from governance and procedure perspectives, needs to be thought through. • The aforementioned performance assessments can help evaluate the needs and prioritize the efforts. 3rd Edition CECL 2018 Congress
  • 12.
    12 THANK YOU 3rd EditionCECL 2018 Congress

Editor's Notes

  • #2 Reviewing how CECL will perform under certain scenarios to finalize decisioning ahead of implementation Justifying and testing model decisions Understanding dynamics under scenarios Fine tuning methodology Using insight to finalise decisioning What would the impact be on allowances of the crisis Running models with forecasts from previous years and testing decisions Understanding impact and context of decisions Reviewing historical forecasts and running on loan data from the period
  • #3 2
  • #4 3
  • #5 4
  • #6 5
  • #7 6
  • #8 7
  • #9 8
  • #10 9
  • #11 10
  • #12 11
  • #13 12