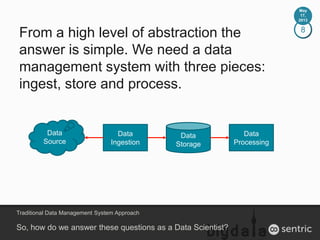
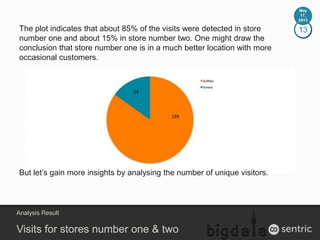
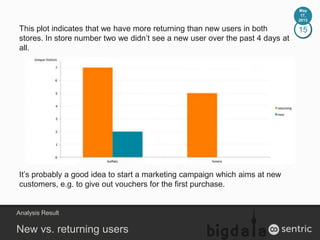
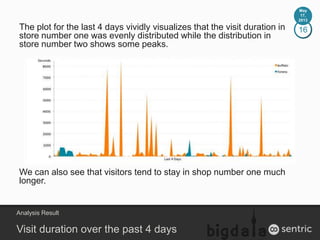
CC 2.0 by Mr. T in DC | http://flic.kr/p/7khrin
CC 2.0 by Franck BLAIS | http://flic.kr/p/cwVnSy
CC 2.0 by John Steven Fernandez | http://flic.kr/p/a8uTzz
CC 2.0 by Ian Carroll | http://flic.kr/p/6NWoGm
CC 2.0 by Perry French | http://flic.kr/p/8wDMJS
CC 2.0 by John Mitchell | http://flic.kr/p/5UaPg8
7
How do we answer these questions?
Before we started designing a blueprint
solution we first of all asked ourselves:
1 Who would be asked to answer questions
like this?
2 Who is this person?
3 What tools does this person expect to
use?
4 And what is a typical skill set of this
person?
5 How do they work?
Preparation
May
17,
2013
8
So, how do we answer these questions as a Data Scientist?
From a high level of abstraction the
answer is simple. We need a data
management system with three pieces:
ingest, store and process.
Traditional Data Management System Approach
May
17,
2013
Data
Source
Data
Ingestion
Data
Processing
Data
Storage
9
So, how do we answer these questions as a Data Scientist?
We take this basis architecture and replace the
generic terms while mapping it onto the Hadoop
ecosystem.
With this Hadoop architecture a Data Scientist should
be able to answer the questions without any
programming environment. He/she can also use
familiar BI, analysis and reporting tools as well.
Blueprint for a Data Management System with Hadoop
May
17,
2013
Data
Source Flume
HIVE,
ImpalaHDFS
BI/Analysis/R
eporting
10
Ingrediants
1 2 WiFi access points to simulate two different stores with
OpenWRT, a linux based firmware for routers, installed
2 Flume to move all log messages to HDFS, without any
manual intervention (no transformation, no filtering)
3 A 4 node CDH4 cluster (2GB RAM, 100GB HDD)
4 Pentaho Data Integration‘s graphical designer for data
transformation, parsing, filtering and loading to the
warehouse
5 Hive as data warehouse system on top of Hadoop to
project structure onto data
6 Impala for querying data from HDFS in real time
7 MS Excel to visualize results
Setup
May
17,
2013
11
How it Works
Analytics System
May
17,
2013
Flume
Hive
Impala
OpenWRT
00:A0:C9:14:C8:28
Syslog Server
Flume
Source
Sinks to
HDFSLoads
RawCSV
Hadoop/HDFS
M/R
Pentaho
UDP
CC 2.0 by Qi Wei Fong | http://flic.kr/p/7w8vfq
13
Visits for stores number one & two
The plot indicates that about 85% of the visits were detected in store
number one and about 15% in store number two. One might draw the
conclusion that store number one is in a much better location with more
occasional customers.
But let’s gain more insights by analysing the number of unique visitors.
Analysis Result
May
17,
2013
14
Unique visitors
This plot gives us more details about the customers. It turns out that
the 135 visits in store number one were caused by just 9 unique
visitors while store number two encountered 5 unique visitors.
Analysis Result
May
17,
2013
15This plot indicates that we have more returning than new users in both
stores. In store number two we didn’t see a new user over the past 4 days at
all.
It’s probably a good idea to start a marketing campaign which aims at new
customers, e.g. to give out vouchers for the first purchase.
New vs. returning users
Analysis Result
May
17,
2013
16The plot for the last 4 days vividly visualizes that the visit duration in
store number one was evenly distributed while the distribution in
store number two shows some peaks.
We can also see that visitors tend to stay in shop number one much
longer.
Visit duration over the past 4 days
Analysis Result
May
17,
2013
17There is a lot of useful information that can be derived
from this plot.
1. There is a repeating pattern of step-ins and step-outs
within a short period of time.
2. There was a step-out of store number one and a step-in
into store number two within just 28 seconds.
Avg. Duration Between Visits of one particular user
Analysis Result
May
17,
2013
Ma
y
17,
201
3
CC 2.0 by AurelienGuichard | http://flic.kr/p/cjg9yw
19
CCAH Course in ZH
• Cloudera Administrator Training for
Apache Hadoop (CCAH)
• June 26th – 28th 2013
• Limmatstrasse 50, Zurich
• More info's: http://www.ymc.ch/training
Announcement
May
17,
2013
20
Links
1 Presentation, Video and Post Series
• http://bitly.com/bundles/cguegi/1
2 http://www.bigdata-usergroup.ch
3 http://about.me/cguegi
4 http://www.ymc.ch/training
May
17,
2013

Case Study: In-Store Analysis

  • 1.
    CC 2.0 byMr. T in DC | http://flic.kr/p/7khrin
  • 2.
    CC 2.0 byFranck BLAIS | http://flic.kr/p/cwVnSy
  • 3.
    CC 2.0 byJohn Steven Fernandez | http://flic.kr/p/a8uTzz
  • 4.
    CC 2.0 byIan Carroll | http://flic.kr/p/6NWoGm
  • 5.
    CC 2.0 byPerry French | http://flic.kr/p/8wDMJS
  • 6.
    CC 2.0 byJohn Mitchell | http://flic.kr/p/5UaPg8
  • 7.
    7 How do weanswer these questions? Before we started designing a blueprint solution we first of all asked ourselves: 1 Who would be asked to answer questions like this? 2 Who is this person? 3 What tools does this person expect to use? 4 And what is a typical skill set of this person? 5 How do they work? Preparation May 17, 2013
  • 8.
    8 So, how dowe answer these questions as a Data Scientist? From a high level of abstraction the answer is simple. We need a data management system with three pieces: ingest, store and process. Traditional Data Management System Approach May 17, 2013 Data Source Data Ingestion Data Processing Data Storage
  • 9.
    9 So, how dowe answer these questions as a Data Scientist? We take this basis architecture and replace the generic terms while mapping it onto the Hadoop ecosystem. With this Hadoop architecture a Data Scientist should be able to answer the questions without any programming environment. He/she can also use familiar BI, analysis and reporting tools as well. Blueprint for a Data Management System with Hadoop May 17, 2013 Data Source Flume HIVE, ImpalaHDFS BI/Analysis/R eporting
  • 10.
    10 Ingrediants 1 2 WiFiaccess points to simulate two different stores with OpenWRT, a linux based firmware for routers, installed 2 Flume to move all log messages to HDFS, without any manual intervention (no transformation, no filtering) 3 A 4 node CDH4 cluster (2GB RAM, 100GB HDD) 4 Pentaho Data Integration‘s graphical designer for data transformation, parsing, filtering and loading to the warehouse 5 Hive as data warehouse system on top of Hadoop to project structure onto data 6 Impala for querying data from HDFS in real time 7 MS Excel to visualize results Setup May 17, 2013
  • 11.
    11 How it Works AnalyticsSystem May 17, 2013 Flume Hive Impala OpenWRT 00:A0:C9:14:C8:28 Syslog Server Flume Source Sinks to HDFSLoads RawCSV Hadoop/HDFS M/R Pentaho UDP
  • 12.
    CC 2.0 byQi Wei Fong | http://flic.kr/p/7w8vfq
  • 13.
    13 Visits for storesnumber one & two The plot indicates that about 85% of the visits were detected in store number one and about 15% in store number two. One might draw the conclusion that store number one is in a much better location with more occasional customers. But let’s gain more insights by analysing the number of unique visitors. Analysis Result May 17, 2013
  • 14.
    14 Unique visitors This plotgives us more details about the customers. It turns out that the 135 visits in store number one were caused by just 9 unique visitors while store number two encountered 5 unique visitors. Analysis Result May 17, 2013
  • 15.
    15This plot indicatesthat we have more returning than new users in both stores. In store number two we didn’t see a new user over the past 4 days at all. It’s probably a good idea to start a marketing campaign which aims at new customers, e.g. to give out vouchers for the first purchase. New vs. returning users Analysis Result May 17, 2013
  • 16.
    16The plot forthe last 4 days vividly visualizes that the visit duration in store number one was evenly distributed while the distribution in store number two shows some peaks. We can also see that visitors tend to stay in shop number one much longer. Visit duration over the past 4 days Analysis Result May 17, 2013
  • 17.
    17There is alot of useful information that can be derived from this plot. 1. There is a repeating pattern of step-ins and step-outs within a short period of time. 2. There was a step-out of store number one and a step-in into store number two within just 28 seconds. Avg. Duration Between Visits of one particular user Analysis Result May 17, 2013
  • 18.
    Ma y 17, 201 3 CC 2.0 byAurelienGuichard | http://flic.kr/p/cjg9yw
  • 19.
    19 CCAH Course inZH • Cloudera Administrator Training for Apache Hadoop (CCAH) • June 26th – 28th 2013 • Limmatstrasse 50, Zurich • More info's: http://www.ymc.ch/training Announcement May 17, 2013
  • 20.
    20 Links 1 Presentation, Videoand Post Series • http://bitly.com/bundles/cguegi/1 2 http://www.bigdata-usergroup.ch 3 http://about.me/cguegi 4 http://www.ymc.ch/training May 17, 2013