Download to read offline


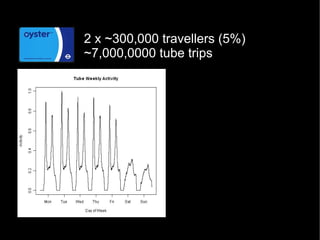
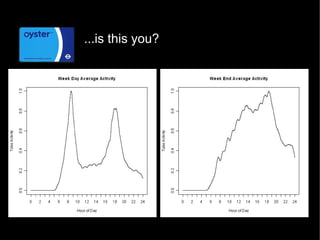
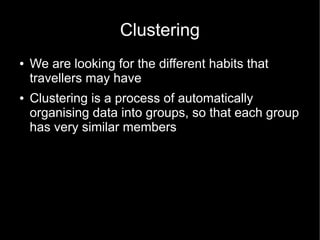
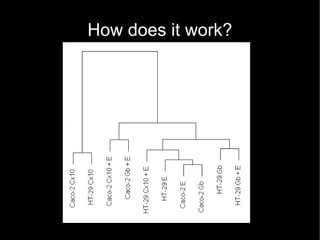
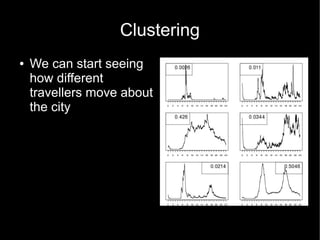


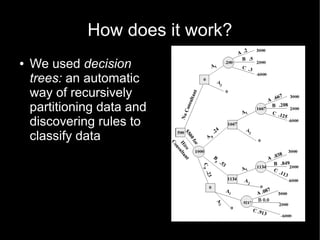
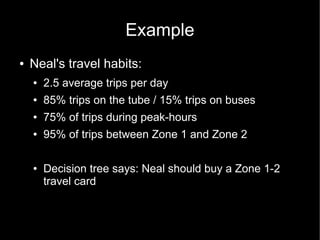


This document discusses how data mining techniques used by web companies could help solve problems in cities. It provides examples of using travel data from Oyster cards and mobile phones to perform clustering, regression, ranking, and classification. Clustering can group travelers by behavior, regression can predict travel times, ranking can order station alerts by relevance, and classification can recommend the cheapest tickets based on travel habits. The goal is to personalize services for smarter, more efficient cities.


