Download to read offline


![Rigorous Coursework
oo Teachers.acknowledged.the.need.to.keep.coursework.relevant. • teacher VoiceS •
to.students.even.as.they.maintain.high.academic.standards..
oo Teachers.said.that.students.in.AP/honors.courses.feel.
challenged.and.were.receiving.the.preparation.they.need.
“ I encourage my students to continue their
education post high school. I emphasize that
high school should never be seen as the end,
for.postsecondary.education.
but rather a step in the process.”
“
oo Teachers.appreciated.the.availability.of.CTE.course.offer-
ings;.they.would.like.to.see.them.contain.more.rigorous.
We want our courses to be more rigorous,
academic.standards.to.help.reinforce.reading.and.math-
and not just be a place where kids go, but a
ematics.skills.
place where kids are going and learning, and
supporting the academics… how can we keep
Curriculum and Instruction up with what’s going on in industry, and how
oo Teachers.want.the.flexibility.to.provide.students.who.lack.
can we keep our [CTE] classes relevant and
certain.foundational.skills.the.opportunity.to.succeed..As.
rigorous so that we’re supporting what else is
a.result,.certain.math.courses.have.been.created.as.bridge.
going on in school?”
courses.between.Algebra.1.and.geometry.and.between.
geometry.and.Algebra.2.
ers.to.supplement.communication.with.families.about.
oo Although.some.data-driven.instruction.is.happening,.it. student.progress;.Data.Director.can.support.assessments.
is.not.in.a.systemic.way..Some.departments.do.use.Data. and.target.instruction.to.areas.where.students.need.addi-
Director.to.monitor.student.progress,.while.others.do.so. tional.support..
less.formally.
Student Supports
oo Teachers.expressed.concern.over.the.block.schedule..They. oo Some.informal.tutoring.opportunities,.such.as.peer.tutor-
would.appreciate.the.opportunity.to.discuss.alternatives. ing,.are.available,.but.lack.of.funding.has.closed.down.
that.may.serve.students.better,.such.as.90-minute.(rather. formal.and.teacher-led.tutoring..Teachers.are.frustrated.
than.two-hour).time.blocks.for.classes. this.resource.is.unavailable.to.students.who.need.addi-
tional.help.
Professional Development
oo Teachers.expressed.frustration.over.budget.cuts.for.profes- oo The.only.formalized.supports.during.the.instructional.day.
sional.development..They.understand.the.importance.of. exist.for.students.who.have.not.passed.the.CAHSEE.in.
quality.PD.in.their.instructional.practices.and.would.like. English.and/or.math..
to.see.the.opportunities.reinstated.
oo Teachers.would.like.additional.structured.opportuni-
oo Teachers.would.like.assistance.on.ways.to.better.serve. ties,.possibly.through.expanded.course.offerings,.to.help.
ELLs.and.students.with.special.needs..They.are.concerned. students.develop.their.talents,.interests,.and.abilities.so.
that.their.current.teaching.strategies.may.be.inadequate.to. they.can.be.better.informed.about.what.to.pursue.after.
address.these.populations’.unique.needs. high.school.
oo Teachers.have.received.some.introductory.training.to.use. oo CHS.has.no.consistent.policy.with.regard.to.helping.
School.Loop.and.Data.Director.and.would.like.additional. students.remediate.skills.during.a.course..Some.teachers.
support.to.help.them.use.these.tools..Additionally,.teach- require.tutoring.for.struggling.students,.while.others.leave.
ers.requested.a.requirement.for.all.staff.to.use.School. it.to.the.student.to.take.the.initiative;.this.may.prevent.
Loop.consistently..Using.School.Loop.would.allow.teach- some.students.from.receiving.necessary.supports..
26 The educaTion TrusT–wesT | carlSBad | March 2010](https://image.slidesharecdn.com/carlsbadreportv2-100909174129-phpapp01/85/Carlsbad-report-v2-38-320.jpg)
![Parent Focus Group
Eleven.parents.attended.the.focus.group.on.campus..Their. • Parent VoiceS •
students.were.in.college-prep,.AP/honors,.and.ELL.courses;.
“
no.parents.with.students.in.special.education.attended..The.
parents.shared.their.experiences.regarding.teachers,.counsel- That was the disparity that my son [saw]
ors,.and.administrators.and.provided.insight.into.the.educa- when he had two or three APs and decided not
tion.their.students.were.receiving.. to take the AP History. It was, you know, it
Parents’.comments.were.generally.positive,.and.most. was a cake walk and it wasn’t as interesting,
believe.their.students.are.being.served.well..They.said.they. and it was just too easy…It was one of those
liked.the.School.Loop.tool.but.suggested.many.students.and. classes that was kind of a throw-away.”
families.could.benefit.from.additional.outreach.on.the.part.
of.CHS..They.expressed.satisfaction.with.the.strong.course.
“As an owner of a business, an engineering
offerings.in.visual.and.performing.arts.as.well.as.the.oppor-
firm, the more Math you give your students,
tunities.for.some.students.to.pursue.a.highly.rigorous.course.
the better. And, as an employer, I know [we]
sequence.in.high.school..
would like to see people that are...even the
Parents.perceived.differences.in.student.experiences.with.
ones that are high school graduates and do not
regard.to.course.offerings,.curricular.support,.and.opportuni-
attend college, [we] would like to see
ties.for.all.students.to.feel.connected.to.CHS—in.particular,.
more Math.”
“
students.who.may.be.the.first.in.their.families.to.pursue.col-
lege,.those.whose.primary.language.is.not.English,.or.those.
Yeah, maybe everybody, if we pushed them
who.have.struggled.academically.through.their.school.career.
a little bit more, or offered them [support],
Other.findings.from.the.parent.focus.group.include.the.
then, you know, they will certainly benefit
following:
from higher graduation requirements.”
College and Career Preparation
oo Some.parents.suggested.more.rigorous.graduation.require-
“ There seems to be strong support for high
achievers and low learners, but there needs to
be more support for the student in between.”
ments.would.benefit.all.students,.provided.the.additional.
support.some.students.need.is.part.of.that.change.
oo Parents.who.said.they.believed.all.students.could.succeed. oo Parents.were.generally.aware.that.CHS.offers.career.tech-
with.graduation.requirements.that.are.aligned.with.A-G. nical.education.classes,.but.none.had.students.currently.
course.requirements.expressed.concern.that.such.a.shift.is. enrolled.in.any.courses..They.expressed.concern.that.CTE.
currently.impossible.because.of.scheduling.constraints. courses.are.perceived.more.as.elective.courses.rather.than.
vocational.training.for.students.to.develop.tangible.skills..
oo Several.parents.expressed.concern.that.scheduling.difficul-
ties.forced.their.students.to.complete.courses.at.the.com- Supports for Students and Families
munity.college.to.meet.college.admission.requirements.. oo Parents.said.a.course.should.be.available.to.help.students.
These.parents.said.such.courses.should.be.more.available. plan.their.four.years.at.CHS.so.they.are.aware.of.what.
to.students.within.the.regular.school.day. they.need.to.succeed.after.high.school.
oo Parents.said.the.pressure.on.students.to.achieve.at. oo Parents.said.School.Loop.helps.them.to.stay.up.to.date.
extremely.high.levels.has.increased.dramatically.since. with.their.students’.courses.but.that.not.all.teachers.or.
their.generation.attended.high.school..Some.expressed. classes.are.housed.on.the.Web.site..This.makes.it.difficult.
concern.about.their.students.doing.too.much—enrolling. to.stay.informed.about.expectations,.coursework,.and.
in.multiple.AP.courses.or.pursuing.competitive.sports.or. exams..They.recommended.school.administrators.expect.
performing.arts—and.not.enjoying.high.school.enough. all.teachers.to.use.School.Loop.consistently.
28 The educaTion TrusT–wesT | carlSBad | March 2010](https://image.slidesharecdn.com/carlsbadreportv2-100909174129-phpapp01/85/Carlsbad-report-v2-40-320.jpg)


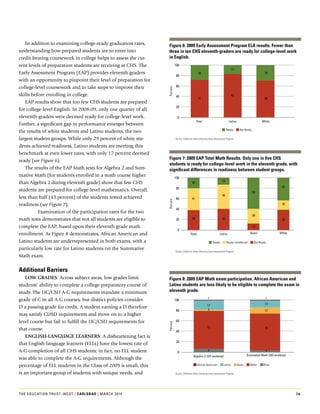
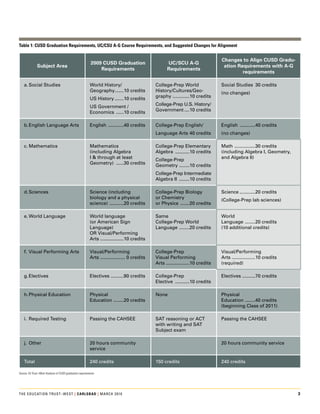
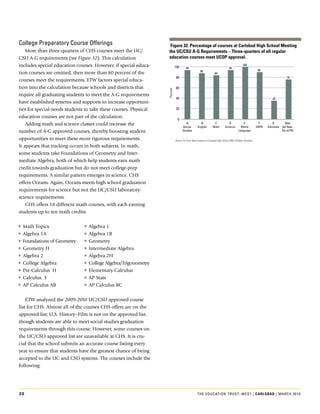
This document summarizes an educational opportunity audit report for the Carlsbad Unified School District. The report examines student performance trends, course-taking patterns, school organization, stakeholder attitudes, and institutional practices. It finds that over half of Carlsbad High School graduates now complete the A-G college prep course sequence. However, it notes that preparing all students for college and career is increasingly important. The report recommends that CUSD align its graduation requirements with the A-G sequence and make those courses available to all students. It concludes that district leaders are committed to reform and have support from teachers, counselors, parents, and students to improve opportunities and outcomes for all CUSD students.


