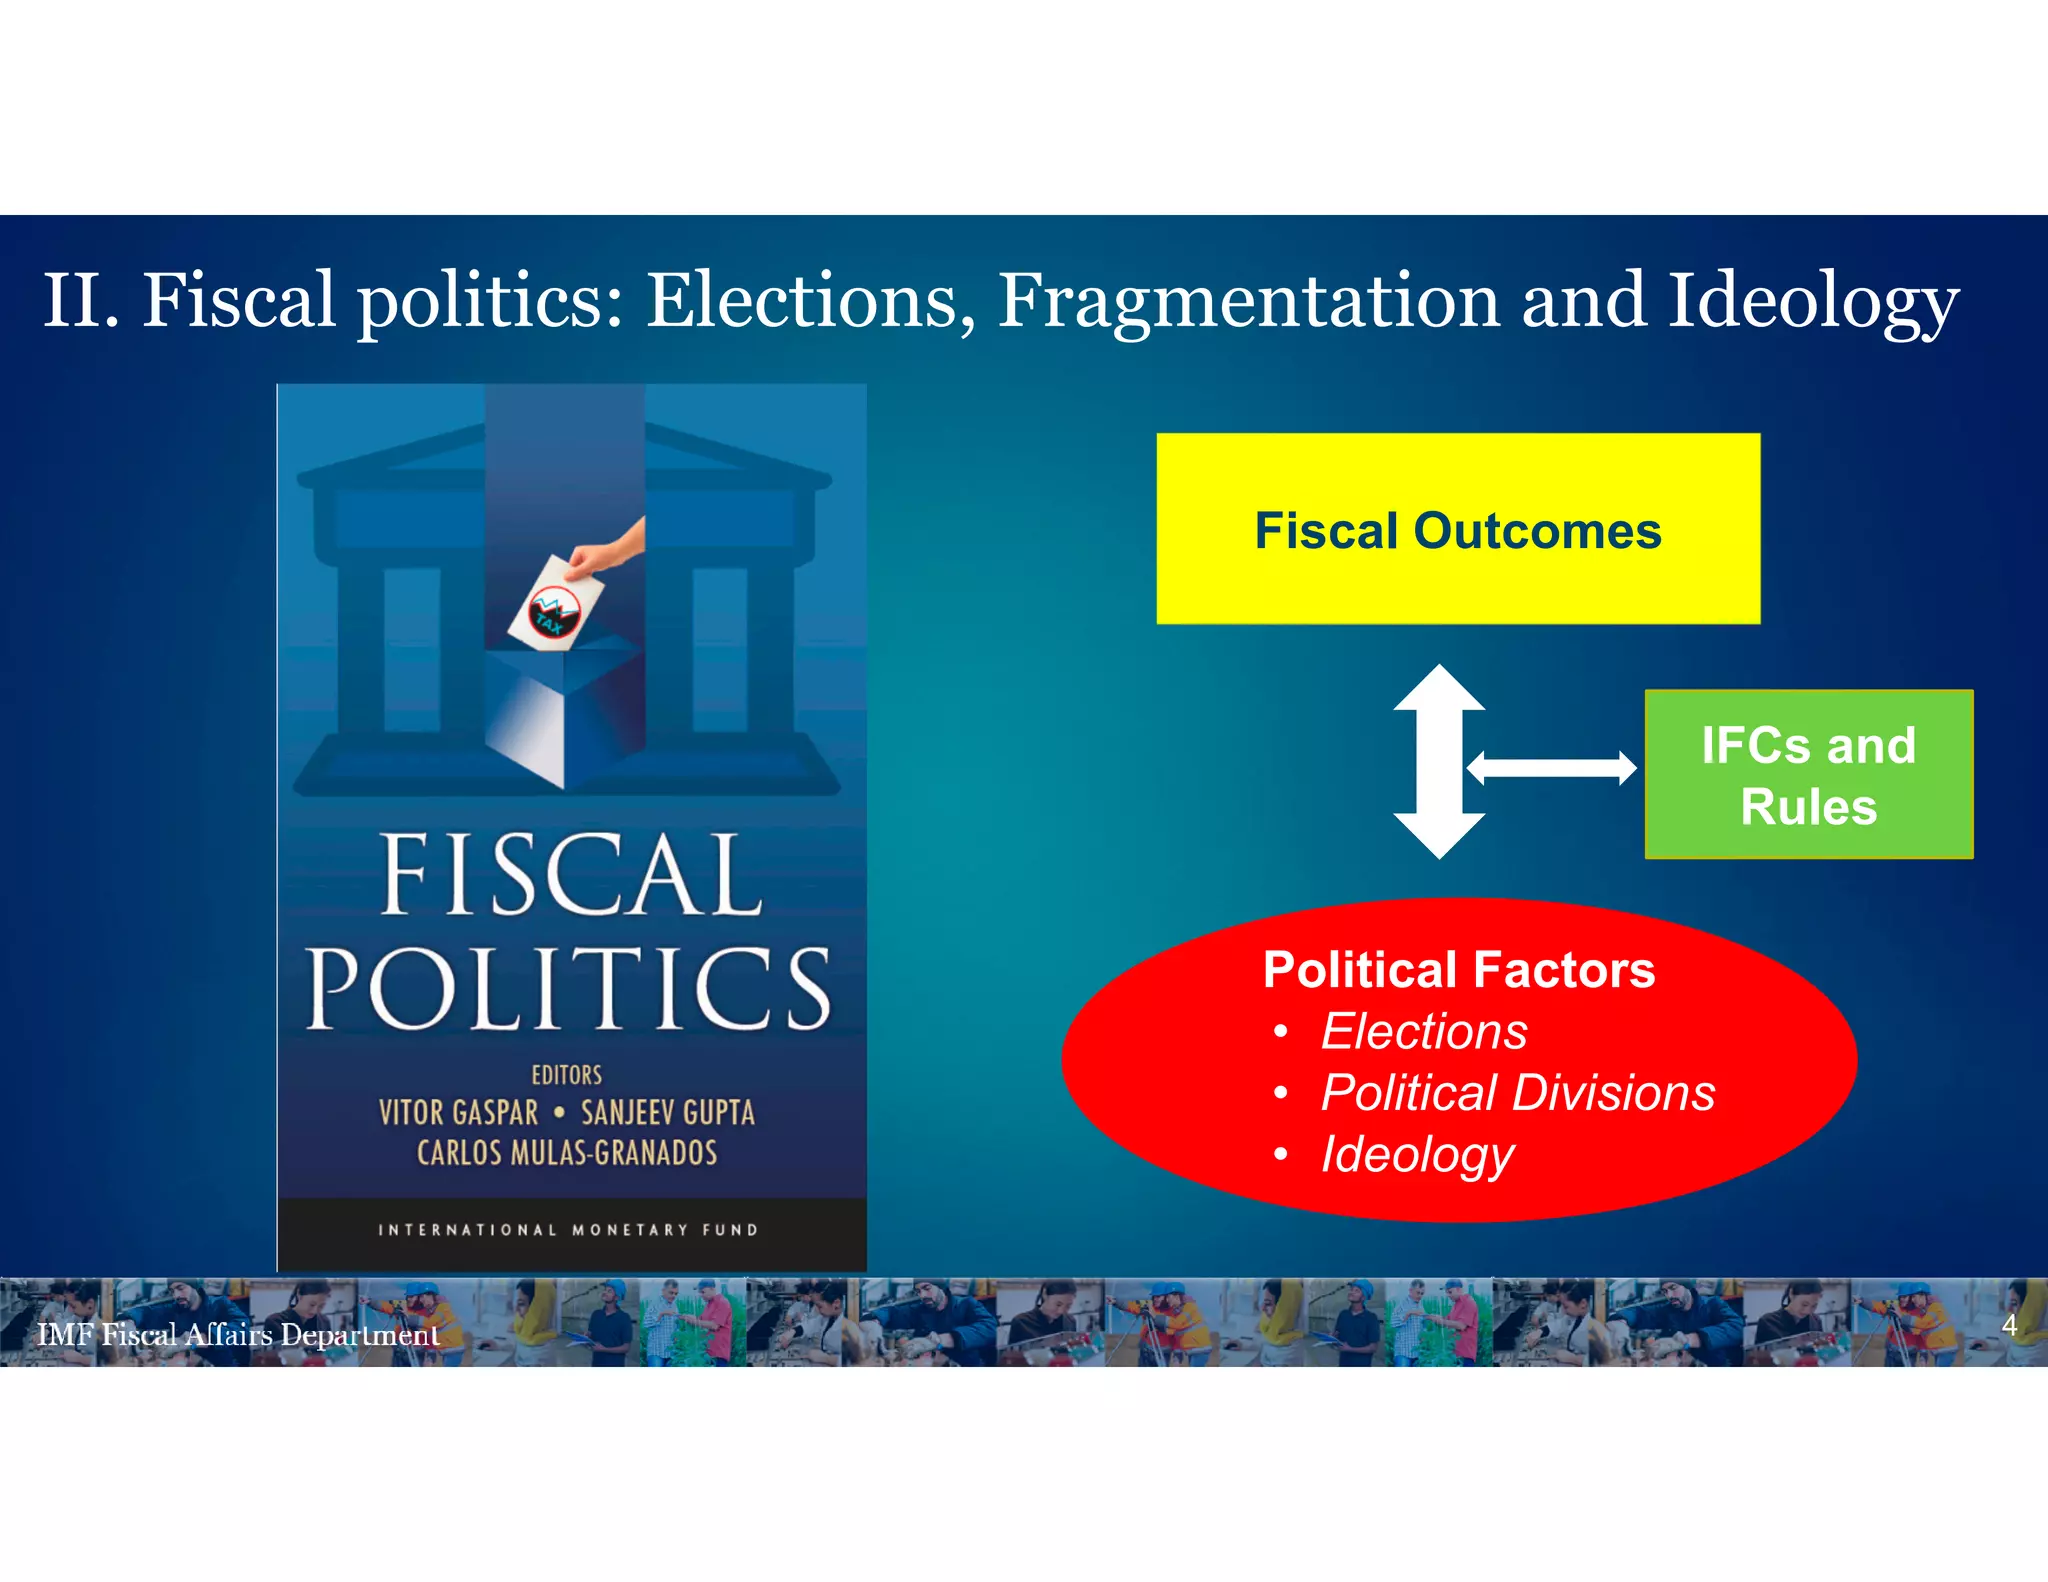
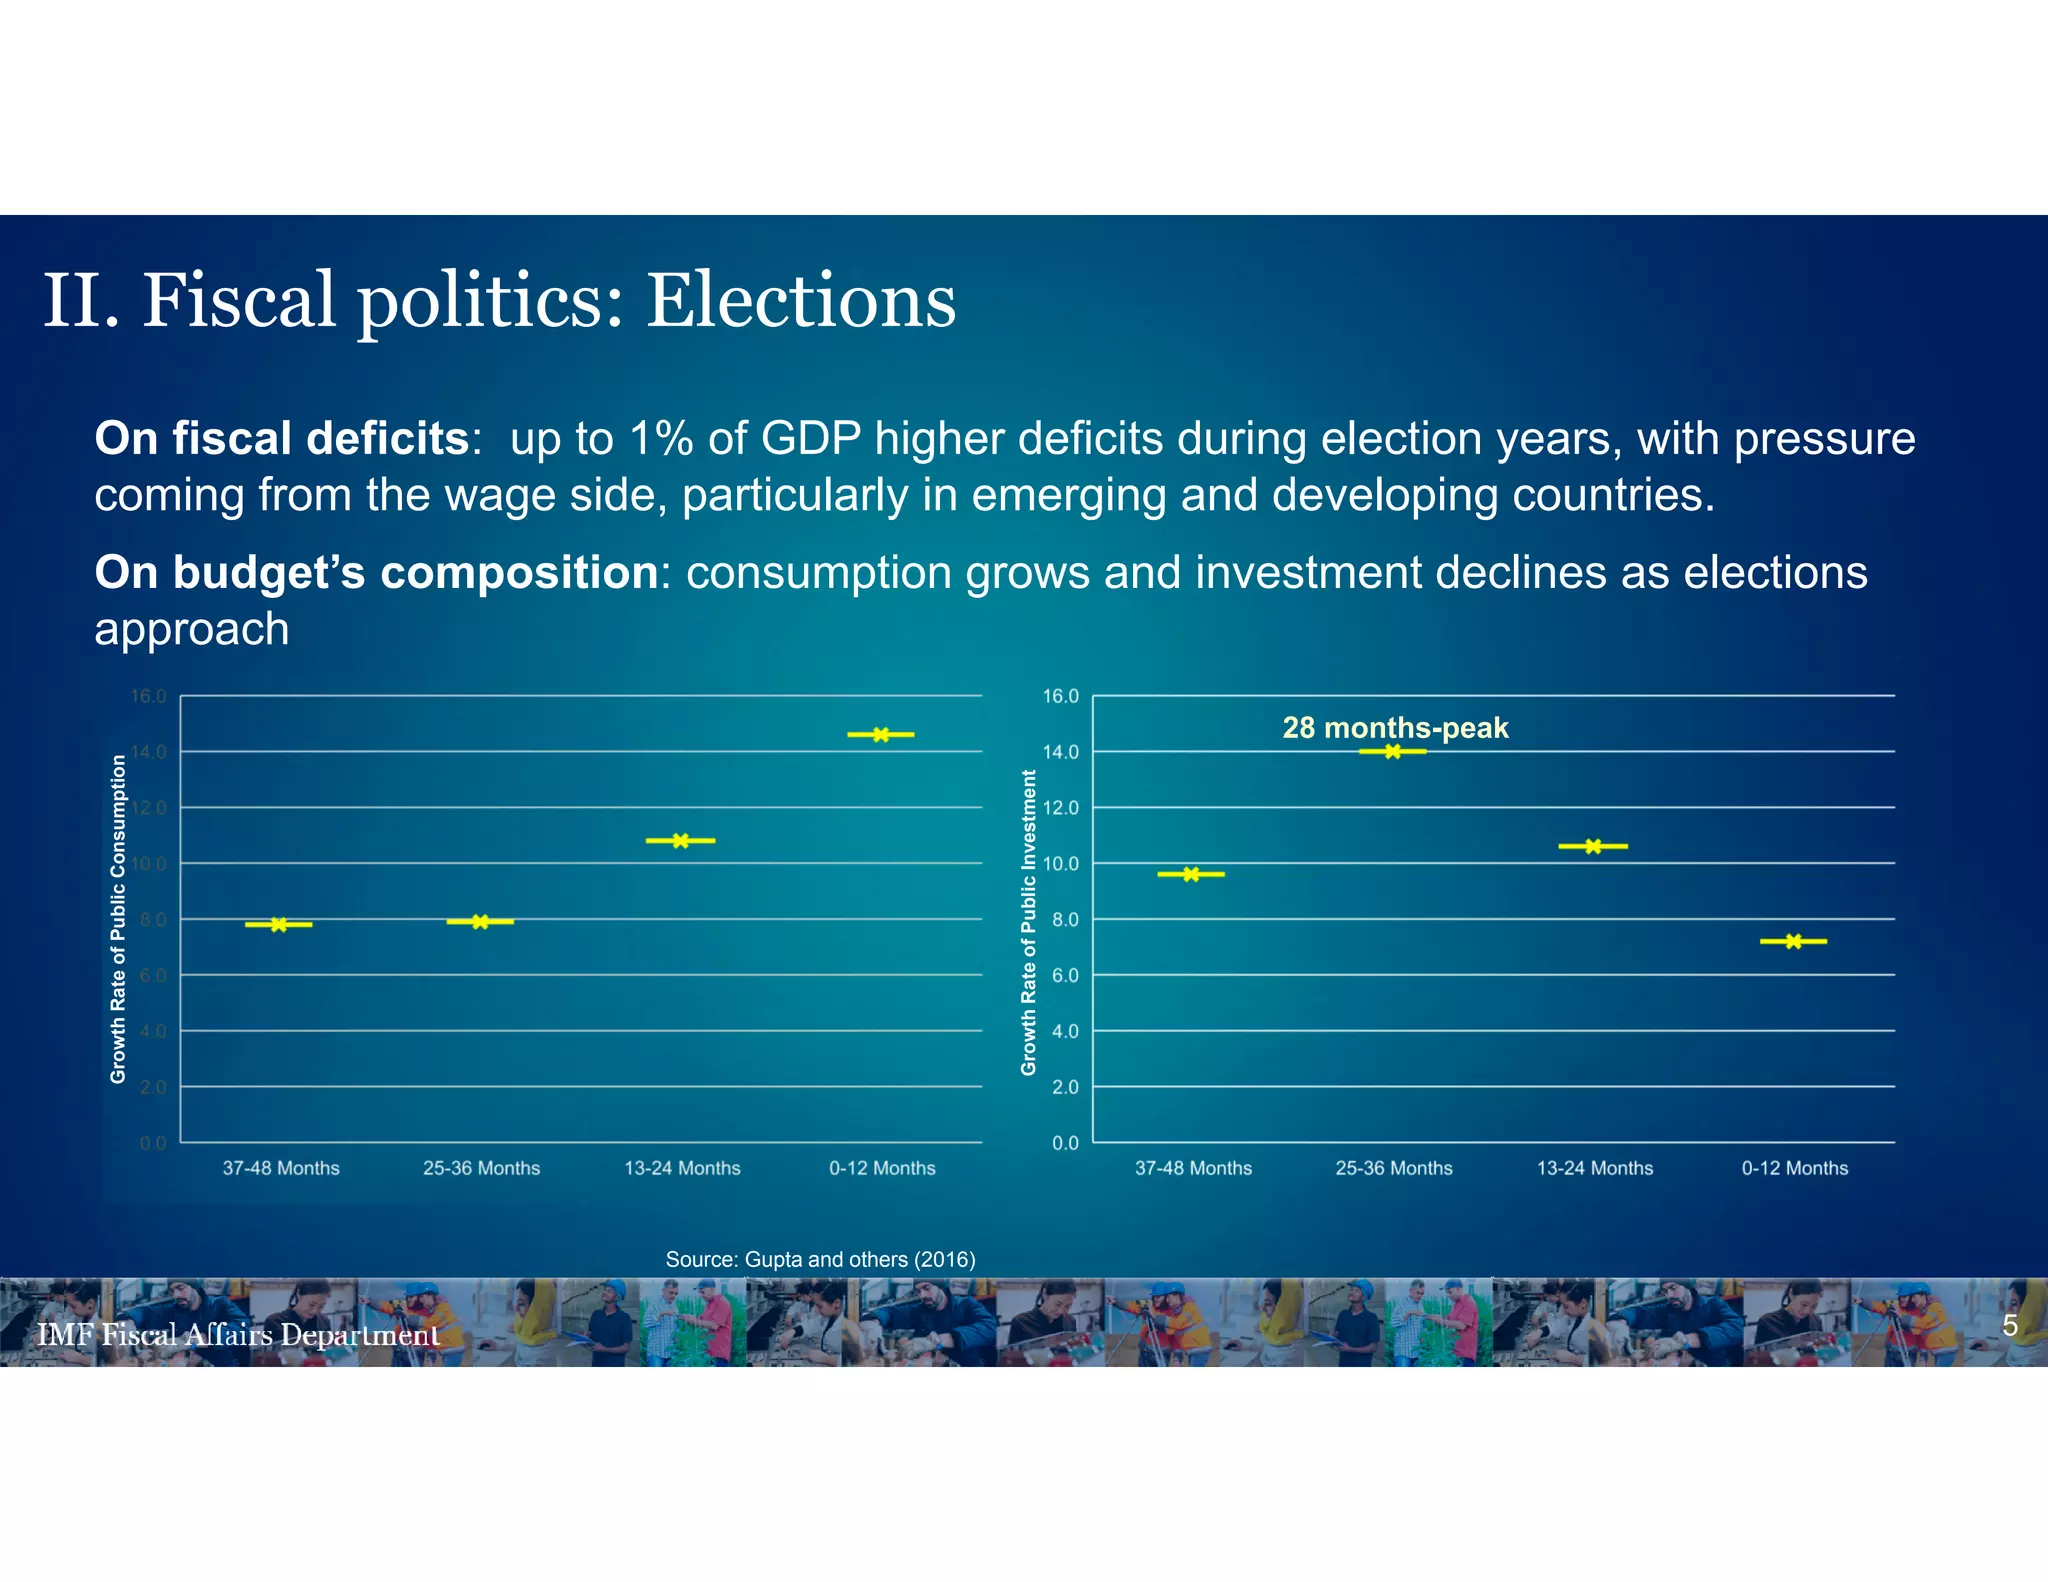
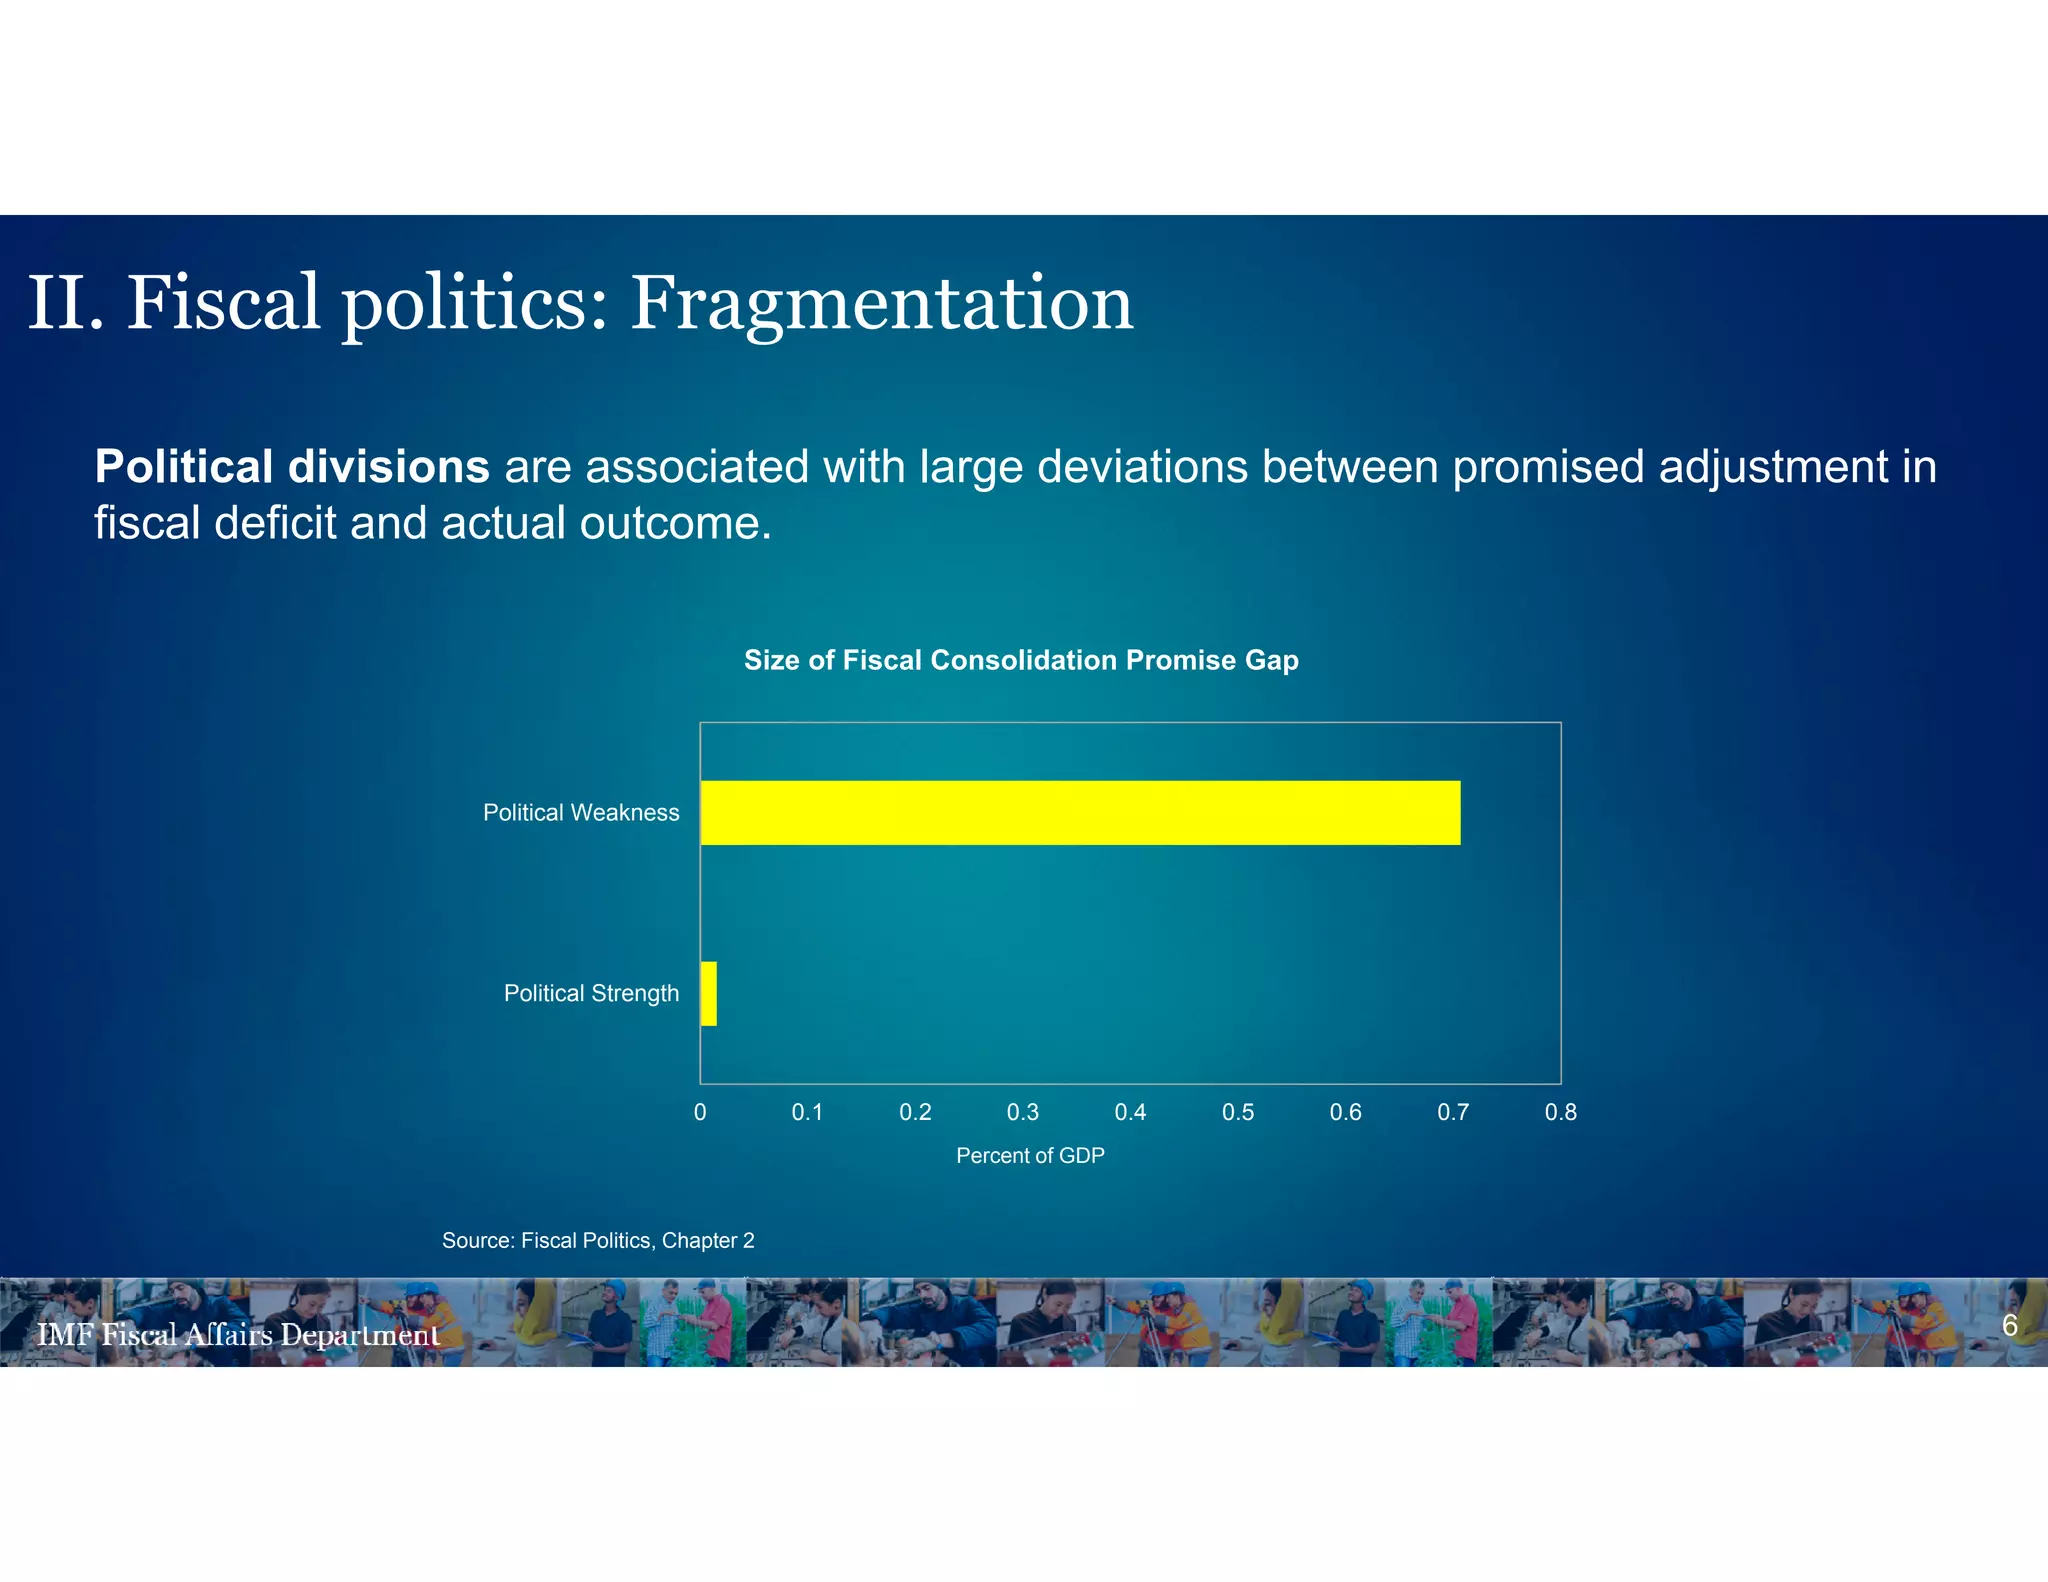
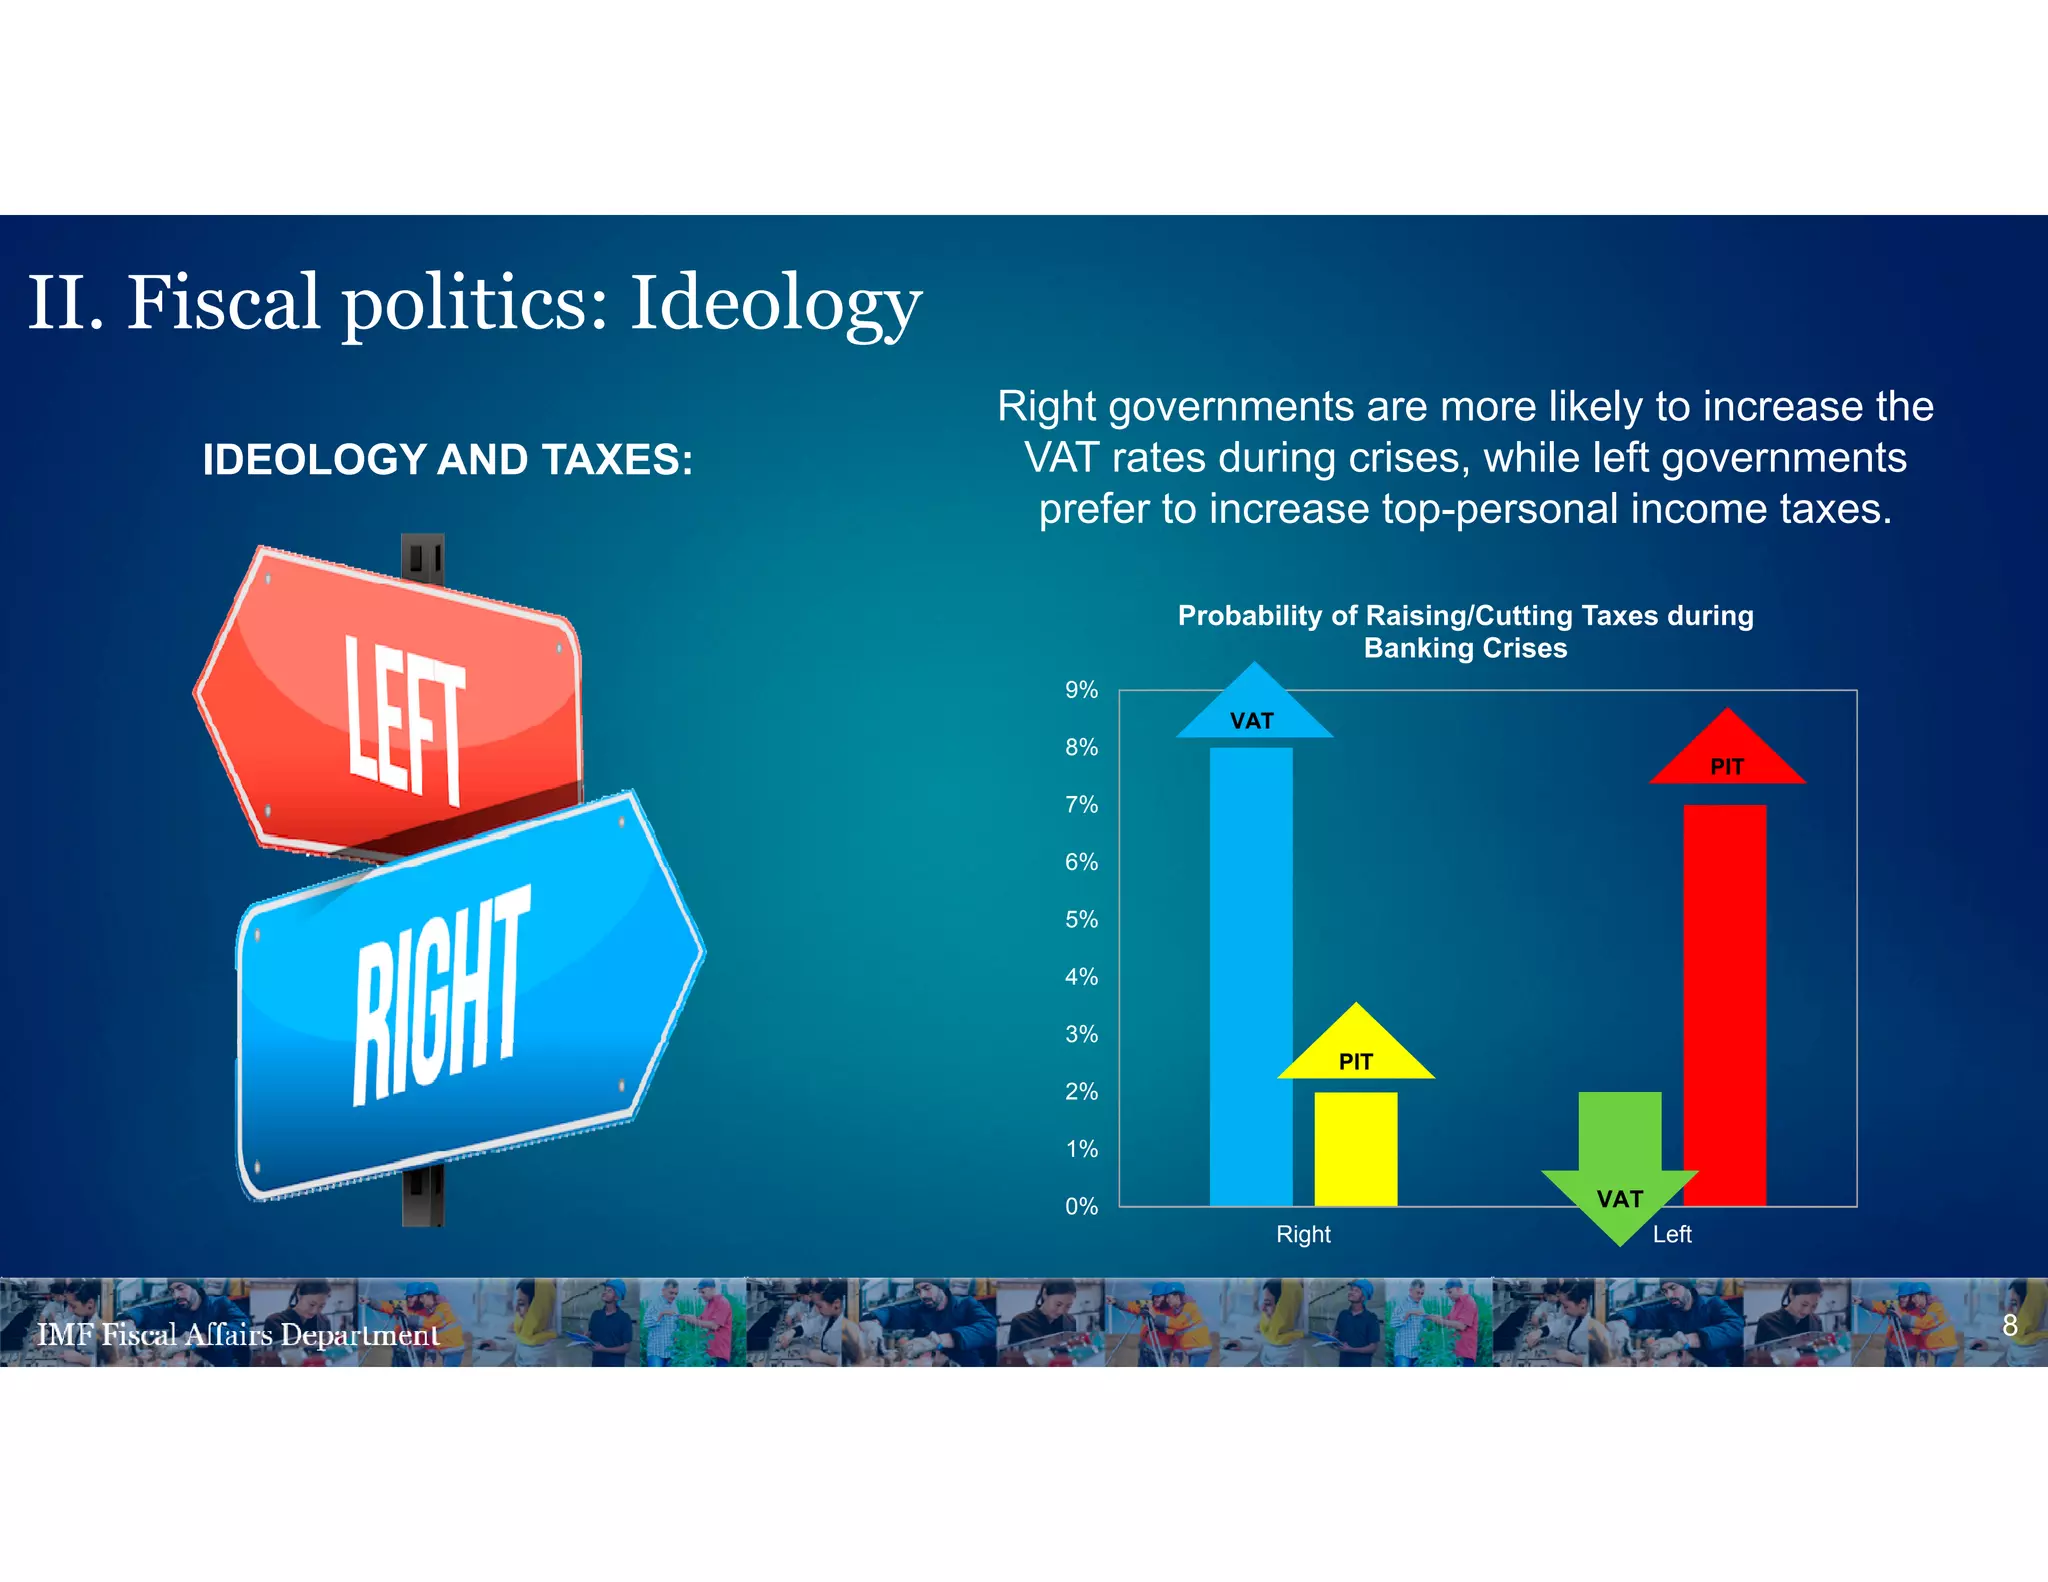
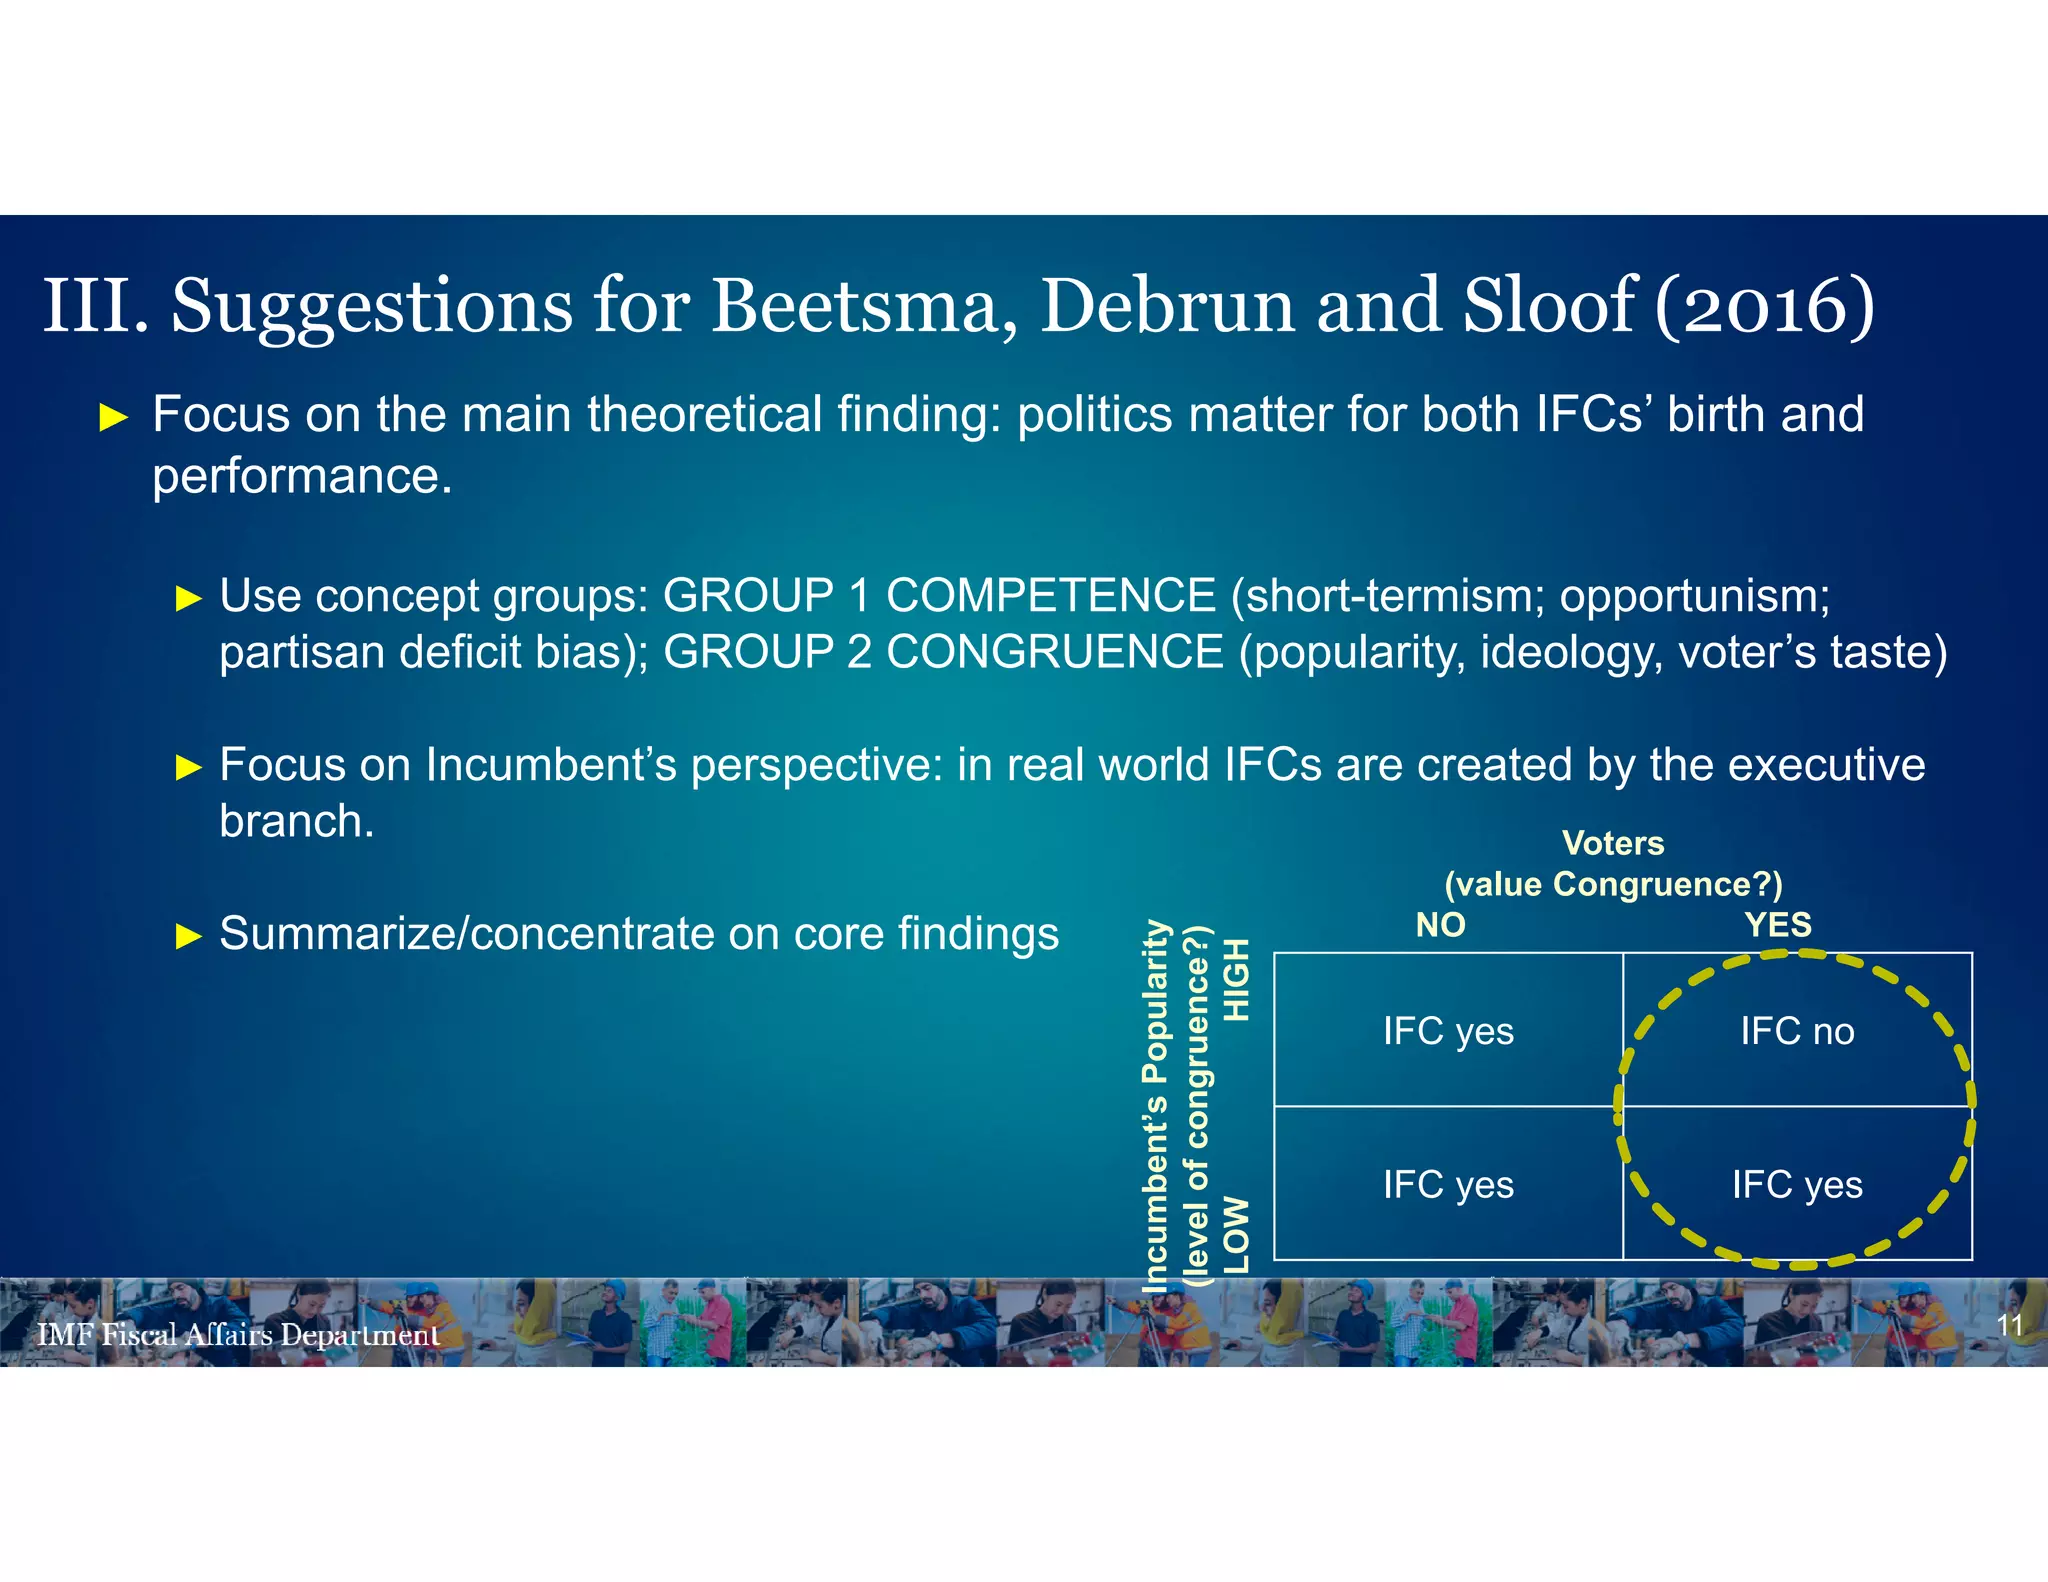
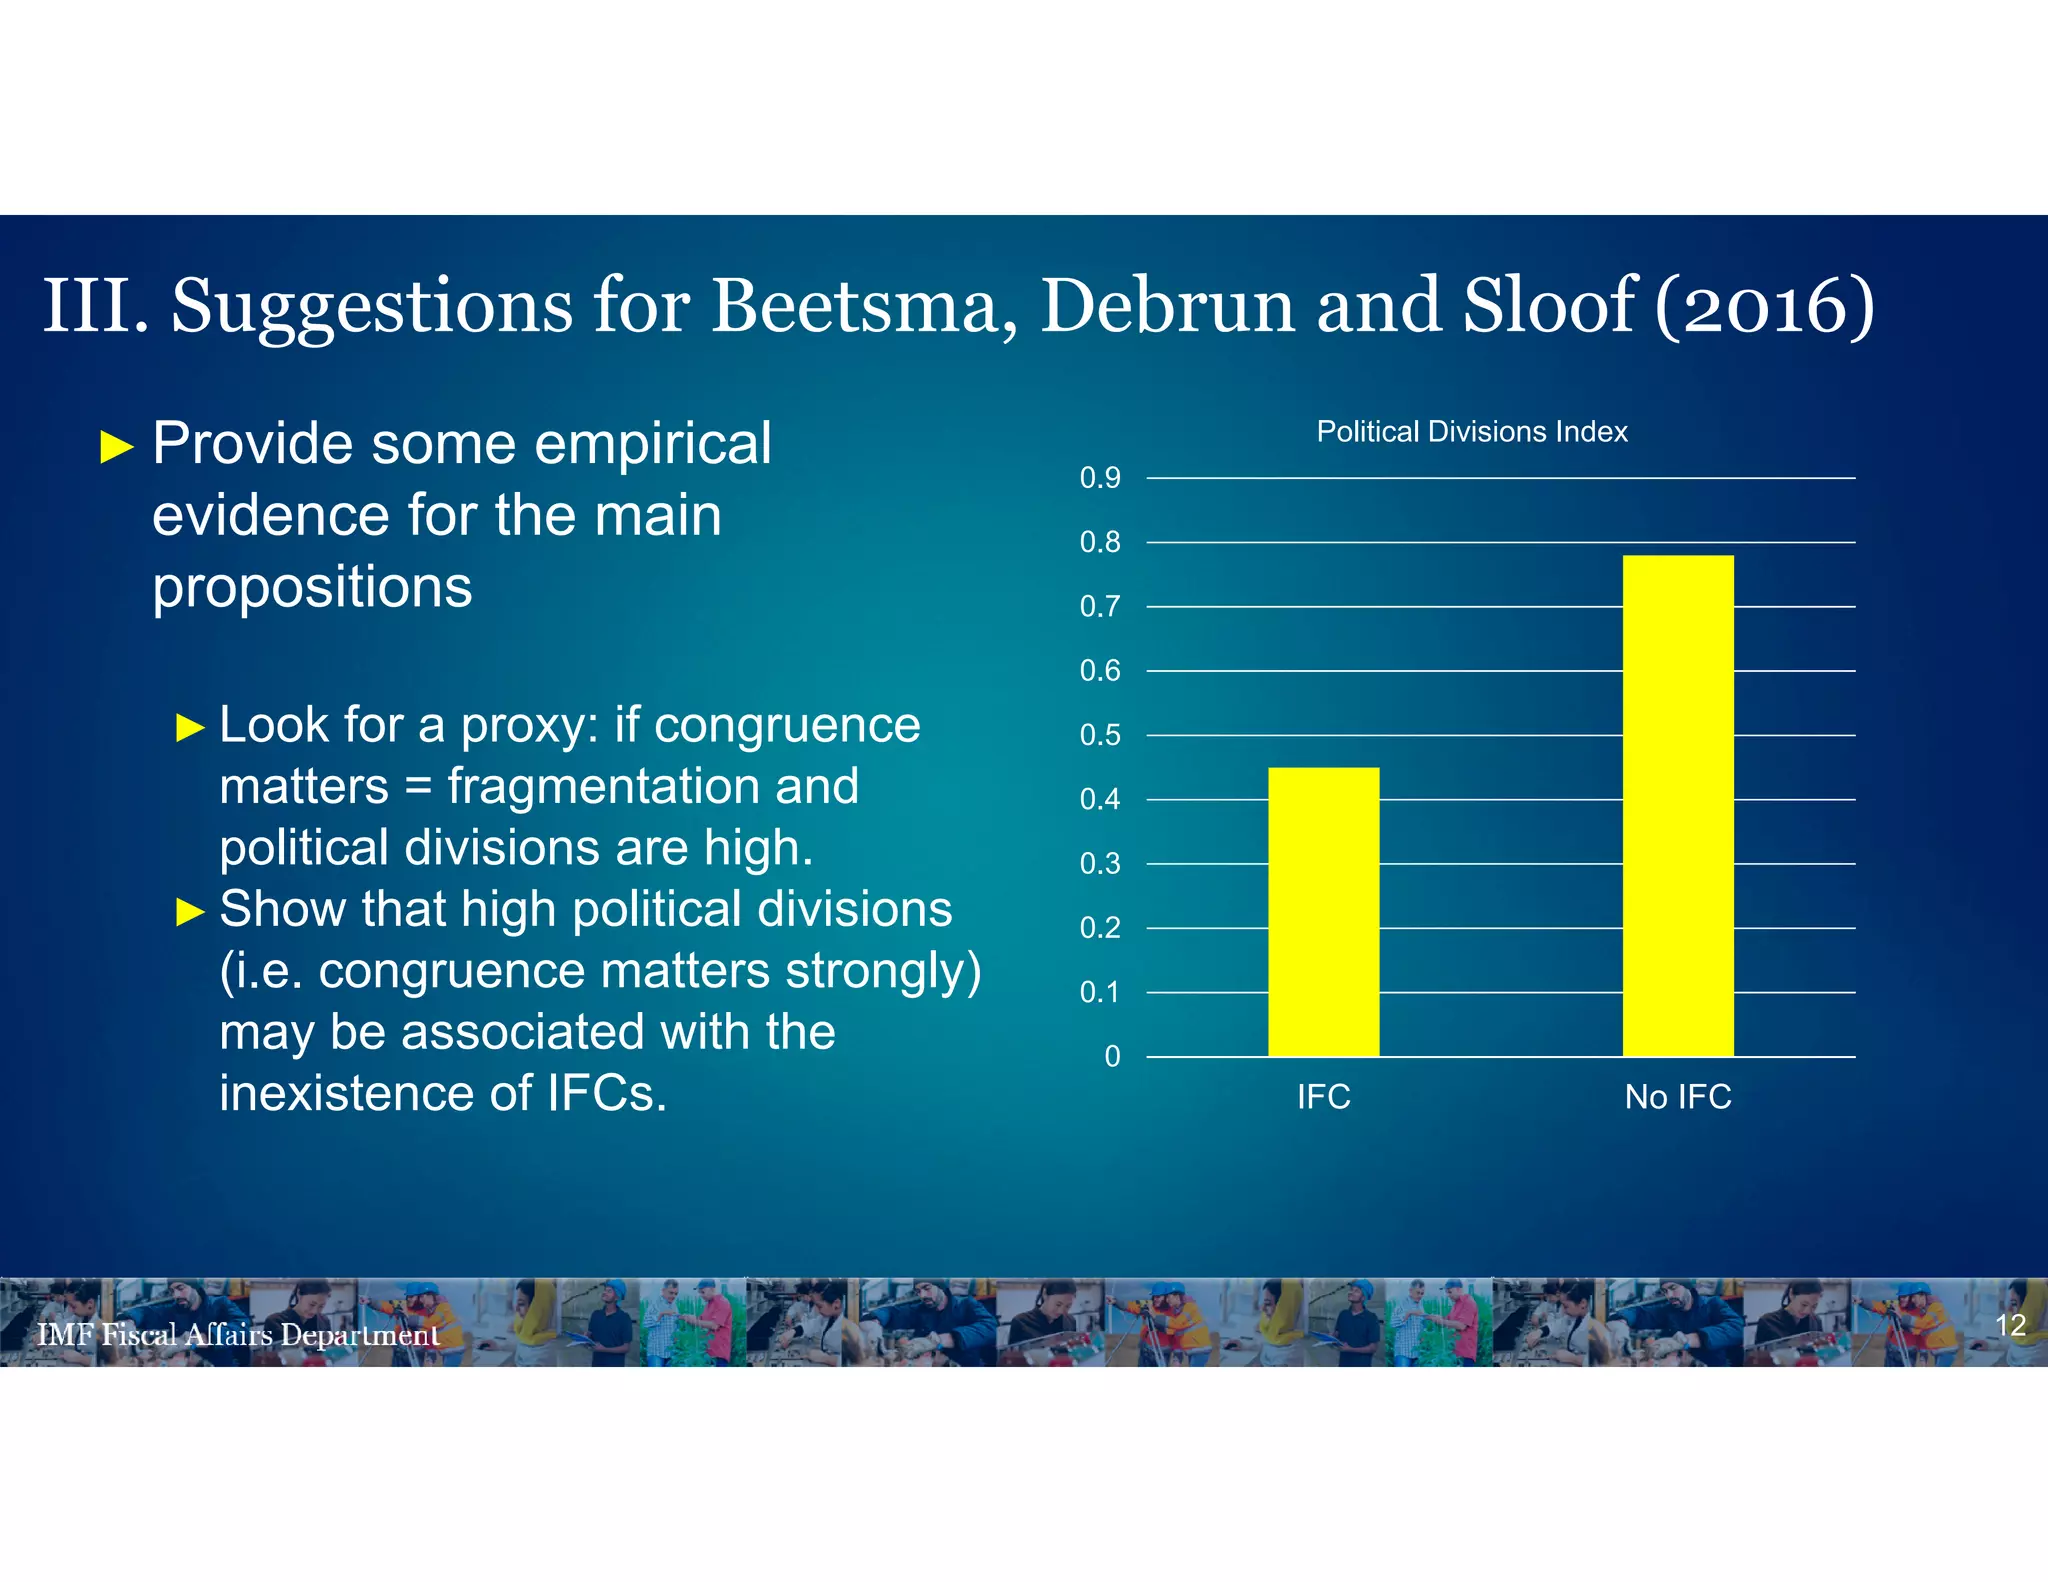
INDEPENDENT FISCAL COUNCILS &
FISCAL POLITICS
Comments on Beetsma, Debrun, and Sloof (2016)
CARLOS MULAS-GRANADOS (IMF)
ADEMU CONFERENCE
MADRID, MAY 18TH, 2017
Presentation Outline
I. Under which conditions are IFCs created and what are their
effects?
II. Fiscal politics: Elections, Fragmentation and Ideology
III. Some suggestions to complement Beetsma, Debrun and Sloof
(2016)
2
Beetsma et al (2016):
►IFCs have proliferated (more than 35 in 2015)
►Domestic political conditions should explain their
emergence
►But pre/post averages of political indicators don’t change
around IFCs creation dates.
►The response to this puzzle?....a new theory of IFC
creation and their effects –which shows that IFC’s lead(*)
to more fiscal discipline
2
I. When are IFCs created and what are their effects?
► But despite IFCs proliferation: weak fiscal compliance in Euro Area
3
Source: IMF’s “Fiscal Politics” (Chapter 18)
0
10
20
30
40
50
60
70
80
90
100
1999
2000
2001
2002
2003
2004
2005
2006
2007
2008
2009
2010
2011
2012
2013
2014
2015
Debt MTO
Euro Area: Share of Non-Compliers
(1999=2015, EA-19)
I. When are IFCs created and what are their effects?
II. Fiscal politics: Elections, Fragmentation and Ideology
4
Fiscal Outcomes
Political Factors
• Elections
• Political Divisions
• Ideology
IFCs and
Rules
On fiscal deficits: up to 1% of GDP higher deficits during election years, with pressure
coming from the wage side, particularly in emerging and developing countries.
On budget’s composition: consumption grows and investment declines as elections
approach
5
Source: Gupta and others (2016)
GrowthRateofPublicInvestment
GrowthRateofPublicConsumption
28 months-peak
II. Fiscal politics: Elections
Political divisions are associated with large deviations between promised adjustment in
fiscal deficit and actual outcome.
6
Source: Fiscal Politics, Chapter 2
0 0.1 0.2 0.3 0.4 0.5 0.6 0.7 0.8
Political Strength
Political Weakness
Size of Fiscal Consolidation Promise Gap
Percent of GDP
II. Fiscal politics: Fragmentation
Weaker majorities are associated with larger debt accumulation in AEs and with
smaller debt reduction in EME/LICDs, during the electoral cycle.
7
-4
-3
-2
-1
0
1
2
3
4
5
6
High Margin of Majority Low Margin of Majority
Change in Public Debt During Average Term
Source: Fiscal Politics, Chapter 9
PercentofGDP
AE EME/LIDC
II. Fiscal politics: Fragmentation
8
Right governments are more likely to increase the
VAT rates during crises, while left governments
prefer to increase top-personal income taxes.
IDEOLOGY AND TAXES:
0%
1%
2%
3%
4%
5%
6%
7%
8%
9%
Right Left
Probability of Raising/Cutting Taxes during
Banking Crises
VAT
PIT
VAT
PIT
II. Fiscal politics: Ideology
9
Left-wing governments are associated with larger
public investment boomsIDEOLOGY AND SPENDING:
Source: Gupta and others (2015) Now or Later? The Political
Economy of Public Investment in Democracies, IMF Working Paper
No.15/175
0
2
4
6
8
10
0 0.2 0.4 0.6 0.8 1
Averagesizeinvestmentbooms
(percentGDP)
Ideology: 0=Right; 1=Left
II. Fiscal politics: Ideology
► Politics has a decisive influence on fiscal policy formulation and performance.
► The impact of elections and political divisions is particularly significant.
► It seems that ideology has less of an impact.
► Budget institutions (e.g. IFCs) “only” help soften the effect of politics on fiscal
policy.
► External constraints work if owned by country authorities.
(*) see appendix for empirical findings by chapter
10
II. Fiscal politics: Main messages of the Book
► Focus on the main theoretical finding: politics matter for both IFCs’ birth and
performance.
► Use concept groups: GROUP 1 COMPETENCE (short-termism; opportunism;
partisan deficit bias); GROUP 2 CONGRUENCE (popularity, ideology, voter’s taste)
► Focus on Incumbent’s perspective: in real world IFCs are created by the executive
branch.
► Summarize/concentrate on core findings
11
III. Suggestions for Beetsma, Debrun and Sloof (2016)
IFC yes IFC no
IFC yes IFC yes
Voters
(value Congruence?)
NO YES
Incumbent’sPopularity
(levelofcongruence?)
LOWHIGH
► Provide some empirical
evidence for the main
propositions
► Look for a proxy: if congruence
matters = fragmentation and
political divisions are high.
► Show that high political divisions
(i.e. congruence matters strongly)
may be associated with the
inexistence of IFCs.
12
III. Suggestions for Beetsma, Debrun and Sloof (2016)
0
0.1
0.2
0.3
0.4
0.5
0.6
0.7
0.8
0.9
IFC No IFC
Political Divisions Index
THANK YOU FOR YOUR ATTENTION
13
For more information on this title or to order a copy please
visit www.imfbookstore.org
“The essays in Fiscal Politics are gold mines...”
—Thomas J. Sargent Professor,
New York University and Nobel Laureate of Economics
“…will be of interest to both researchers and policy makers.”
—Timothy J. Besley Professor, London School of Economics
“A splendid and broad ranging contribution.”
—Alberto Alesina Professor, Harvard University
“They uncover new answers to a range of interesting questions…”
—Torsten Persson Professor,
Swedish Research Council and University of Stockholm
“This is a book that should be on the shelf of any policymaker…”
—Francesco Giavazzi, Professor, Bocconi University
Annex: empirical findings for ELECTIONS
 During election years, countries register higher fiscal deficits by
about 1 percentage points (Chapter 3)
 Spending on public wages increases by 0.2 percent of GDP during
election years (Chapter 6)
 The growth rate of public investment peaks about 28 months before
elections, and then declines about 0.7 percentage points as
elections approach (Chapter 5)
 (Spain: The frequency of fiscally non-compliant regions is 1/3 higher
during election years)
2
Annex: empirical findings for FRAGMENTATION
 Deficit reduction can be 7 times smaller in politically (weak) divided
governments.
 Minority governments accumulate twice as much public debt during
an average tenure than majority governments.
 Cabinets with lots of ministers accumulate 80% more public debt
during an average tenure than small cabinets.
 Political fragmentation (measured by parliamentary control of the
government) reduced the size of fiscal stimulus during the crisis by
between 1 and 2.7 percent of GDP.
 (Spain: Regions ideologically aligned with the center presented
greater fiscal compliance –frequency of cases is 14 percent higher)
2
Annex: empirical findings for IDEOLOGY
 No evidence that ideology affects debt or deficit levels, but ideology
matters for the composition of taxes and spending.
 A right government is about 8 percentage points more likely to
increase the VAT than a left government during crises
 A Left government is about 2 percentage points more likely to cut
VAT in a crisis, and about 7 percentage points more likely to
increase the top personal income tax rate.
 The average size of public investment booms by left-wing
governments doubles the size of booms by right-wing governments
(3.5% vs 1.75% of GDP)
2
Annex: empirical findings for RULES AND INSTITUTIONS
 Three years after the introduction of an Exp. Rule, the level of
expenditure (and volatility) associated to electoral cycles declines by 4%.
 The seven countries with strongest fiscal councils had on average 2% of
GDP better fiscal balances (2003-2014) than the rest of EU countries.
 Lack of ownership by national governments make supranational rules
weak: For instance, the MTO was violated in 80 percent of observations
between 1999 and 2015 in the Euro Area. In parallel, the share of
countries with a debt ratio above 60 percent increased from 35 percent in
1999 to 75 percent in 2015, despite greater flexibility in SGP.
2

Carlos Mulas Granados: comments on Beetsma, Debrun and Sloof

  • 1.
    INDEPENDENT FISCAL COUNCILS& FISCAL POLITICS Comments on Beetsma, Debrun, and Sloof (2016) CARLOS MULAS-GRANADOS (IMF) ADEMU CONFERENCE MADRID, MAY 18TH, 2017
  • 2.
    Presentation Outline I. Underwhich conditions are IFCs created and what are their effects? II. Fiscal politics: Elections, Fragmentation and Ideology III. Some suggestions to complement Beetsma, Debrun and Sloof (2016) 2
  • 3.
    Beetsma et al(2016): ►IFCs have proliferated (more than 35 in 2015) ►Domestic political conditions should explain their emergence ►But pre/post averages of political indicators don’t change around IFCs creation dates. ►The response to this puzzle?....a new theory of IFC creation and their effects –which shows that IFC’s lead(*) to more fiscal discipline 2 I. When are IFCs created and what are their effects?
  • 4.
    ► But despiteIFCs proliferation: weak fiscal compliance in Euro Area 3 Source: IMF’s “Fiscal Politics” (Chapter 18) 0 10 20 30 40 50 60 70 80 90 100 1999 2000 2001 2002 2003 2004 2005 2006 2007 2008 2009 2010 2011 2012 2013 2014 2015 Debt MTO Euro Area: Share of Non-Compliers (1999=2015, EA-19) I. When are IFCs created and what are their effects?
  • 5.
    II. Fiscal politics:Elections, Fragmentation and Ideology 4 Fiscal Outcomes Political Factors • Elections • Political Divisions • Ideology IFCs and Rules
  • 6.
    On fiscal deficits:up to 1% of GDP higher deficits during election years, with pressure coming from the wage side, particularly in emerging and developing countries. On budget’s composition: consumption grows and investment declines as elections approach 5 Source: Gupta and others (2016) GrowthRateofPublicInvestment GrowthRateofPublicConsumption 28 months-peak II. Fiscal politics: Elections
  • 7.
    Political divisions areassociated with large deviations between promised adjustment in fiscal deficit and actual outcome. 6 Source: Fiscal Politics, Chapter 2 0 0.1 0.2 0.3 0.4 0.5 0.6 0.7 0.8 Political Strength Political Weakness Size of Fiscal Consolidation Promise Gap Percent of GDP II. Fiscal politics: Fragmentation
  • 8.
    Weaker majorities areassociated with larger debt accumulation in AEs and with smaller debt reduction in EME/LICDs, during the electoral cycle. 7 -4 -3 -2 -1 0 1 2 3 4 5 6 High Margin of Majority Low Margin of Majority Change in Public Debt During Average Term Source: Fiscal Politics, Chapter 9 PercentofGDP AE EME/LIDC II. Fiscal politics: Fragmentation
  • 9.
    8 Right governments aremore likely to increase the VAT rates during crises, while left governments prefer to increase top-personal income taxes. IDEOLOGY AND TAXES: 0% 1% 2% 3% 4% 5% 6% 7% 8% 9% Right Left Probability of Raising/Cutting Taxes during Banking Crises VAT PIT VAT PIT II. Fiscal politics: Ideology
  • 10.
    9 Left-wing governments areassociated with larger public investment boomsIDEOLOGY AND SPENDING: Source: Gupta and others (2015) Now or Later? The Political Economy of Public Investment in Democracies, IMF Working Paper No.15/175 0 2 4 6 8 10 0 0.2 0.4 0.6 0.8 1 Averagesizeinvestmentbooms (percentGDP) Ideology: 0=Right; 1=Left II. Fiscal politics: Ideology
  • 11.
    ► Politics hasa decisive influence on fiscal policy formulation and performance. ► The impact of elections and political divisions is particularly significant. ► It seems that ideology has less of an impact. ► Budget institutions (e.g. IFCs) “only” help soften the effect of politics on fiscal policy. ► External constraints work if owned by country authorities. (*) see appendix for empirical findings by chapter 10 II. Fiscal politics: Main messages of the Book
  • 12.
    ► Focus onthe main theoretical finding: politics matter for both IFCs’ birth and performance. ► Use concept groups: GROUP 1 COMPETENCE (short-termism; opportunism; partisan deficit bias); GROUP 2 CONGRUENCE (popularity, ideology, voter’s taste) ► Focus on Incumbent’s perspective: in real world IFCs are created by the executive branch. ► Summarize/concentrate on core findings 11 III. Suggestions for Beetsma, Debrun and Sloof (2016) IFC yes IFC no IFC yes IFC yes Voters (value Congruence?) NO YES Incumbent’sPopularity (levelofcongruence?) LOWHIGH
  • 13.
    ► Provide someempirical evidence for the main propositions ► Look for a proxy: if congruence matters = fragmentation and political divisions are high. ► Show that high political divisions (i.e. congruence matters strongly) may be associated with the inexistence of IFCs. 12 III. Suggestions for Beetsma, Debrun and Sloof (2016) 0 0.1 0.2 0.3 0.4 0.5 0.6 0.7 0.8 0.9 IFC No IFC Political Divisions Index
  • 14.
    THANK YOU FORYOUR ATTENTION 13 For more information on this title or to order a copy please visit www.imfbookstore.org “The essays in Fiscal Politics are gold mines...” —Thomas J. Sargent Professor, New York University and Nobel Laureate of Economics “…will be of interest to both researchers and policy makers.” —Timothy J. Besley Professor, London School of Economics “A splendid and broad ranging contribution.” —Alberto Alesina Professor, Harvard University “They uncover new answers to a range of interesting questions…” —Torsten Persson Professor, Swedish Research Council and University of Stockholm “This is a book that should be on the shelf of any policymaker…” —Francesco Giavazzi, Professor, Bocconi University
  • 15.
    Annex: empirical findingsfor ELECTIONS  During election years, countries register higher fiscal deficits by about 1 percentage points (Chapter 3)  Spending on public wages increases by 0.2 percent of GDP during election years (Chapter 6)  The growth rate of public investment peaks about 28 months before elections, and then declines about 0.7 percentage points as elections approach (Chapter 5)  (Spain: The frequency of fiscally non-compliant regions is 1/3 higher during election years) 2
  • 16.
    Annex: empirical findingsfor FRAGMENTATION  Deficit reduction can be 7 times smaller in politically (weak) divided governments.  Minority governments accumulate twice as much public debt during an average tenure than majority governments.  Cabinets with lots of ministers accumulate 80% more public debt during an average tenure than small cabinets.  Political fragmentation (measured by parliamentary control of the government) reduced the size of fiscal stimulus during the crisis by between 1 and 2.7 percent of GDP.  (Spain: Regions ideologically aligned with the center presented greater fiscal compliance –frequency of cases is 14 percent higher) 2
  • 17.
    Annex: empirical findingsfor IDEOLOGY  No evidence that ideology affects debt or deficit levels, but ideology matters for the composition of taxes and spending.  A right government is about 8 percentage points more likely to increase the VAT than a left government during crises  A Left government is about 2 percentage points more likely to cut VAT in a crisis, and about 7 percentage points more likely to increase the top personal income tax rate.  The average size of public investment booms by left-wing governments doubles the size of booms by right-wing governments (3.5% vs 1.75% of GDP) 2
  • 18.
    Annex: empirical findingsfor RULES AND INSTITUTIONS  Three years after the introduction of an Exp. Rule, the level of expenditure (and volatility) associated to electoral cycles declines by 4%.  The seven countries with strongest fiscal councils had on average 2% of GDP better fiscal balances (2003-2014) than the rest of EU countries.  Lack of ownership by national governments make supranational rules weak: For instance, the MTO was violated in 80 percent of observations between 1999 and 2015 in the Euro Area. In parallel, the share of countries with a debt ratio above 60 percent increased from 35 percent in 1999 to 75 percent in 2015, despite greater flexibility in SGP. 2