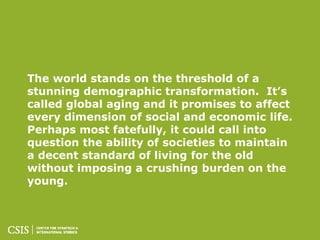
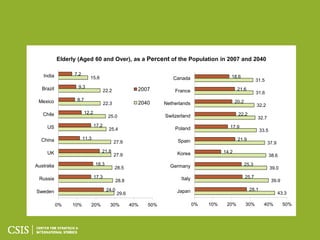
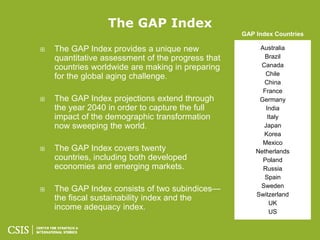
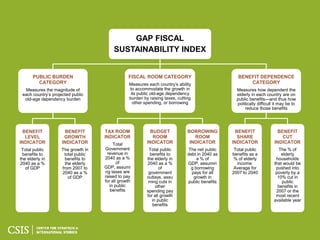
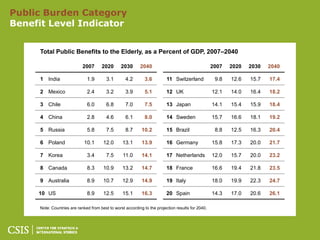
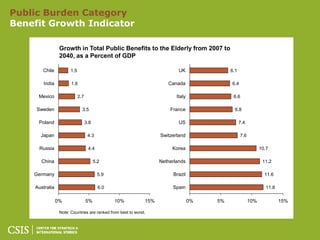
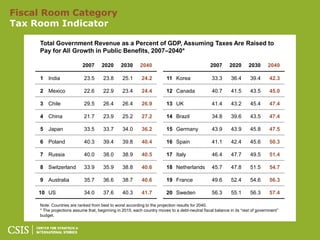
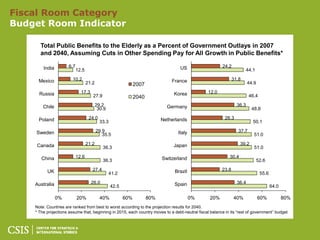
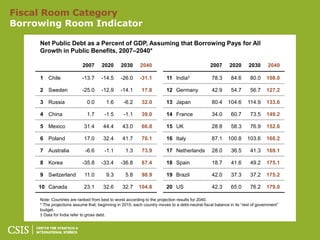
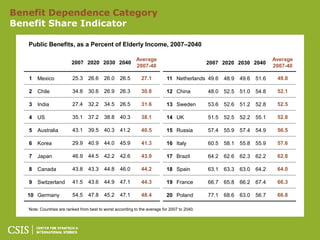
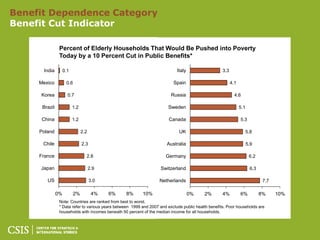
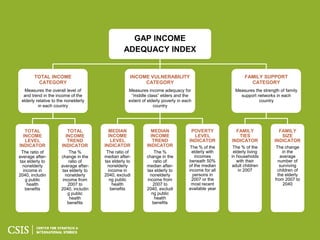
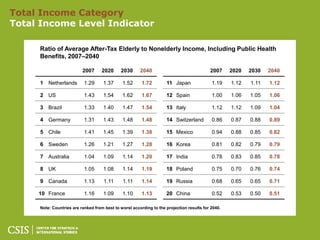
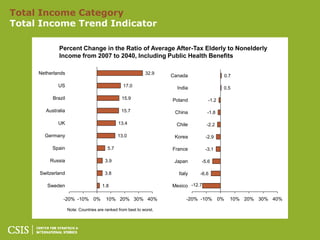
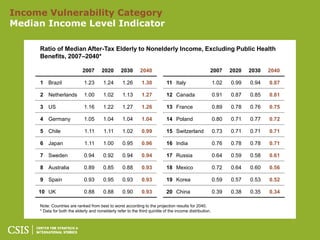
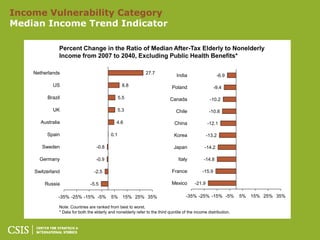
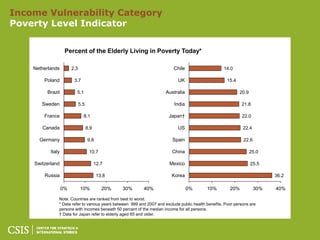
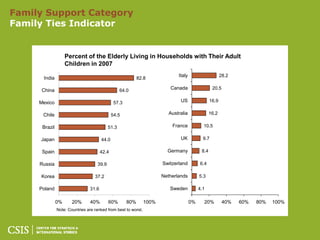
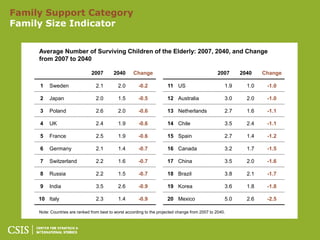
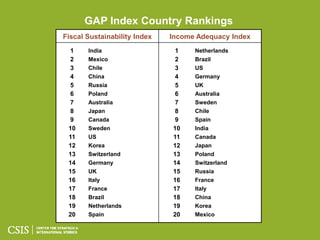
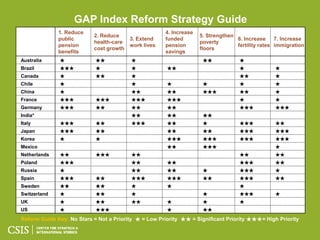
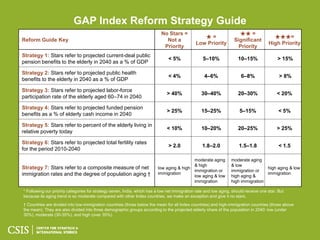
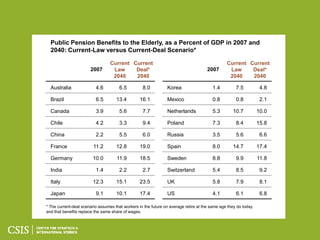
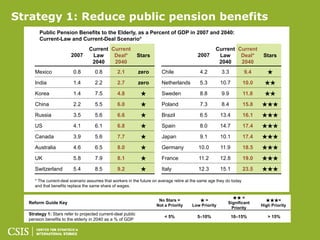
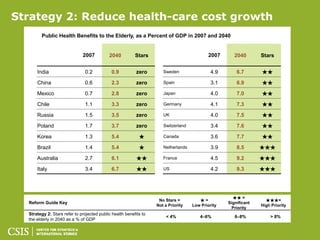
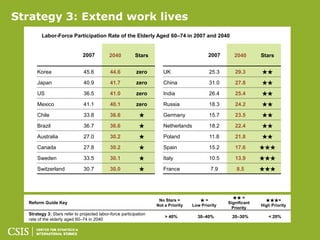
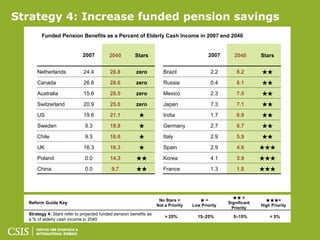
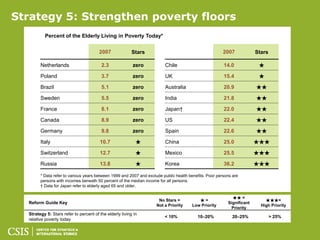
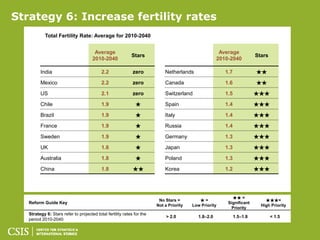
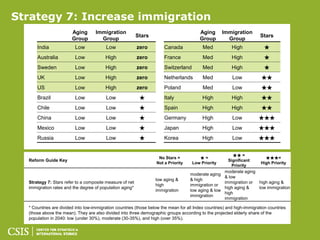
The document discusses the challenges of global aging and introduces the Global Aging Preparedness Index (GAP Index) which assesses how prepared 20 countries are for issues related to aging populations. The GAP Index contains two subindices that measure fiscal sustainability and income adequacy for elderly populations up to 2040. Several data tables show projections for factors like public spending on the elderly as a percentage of GDP and growth in benefits for different countries.
Publicacion de Libro sobres las actividades que entre 2012 y 2014 formaron mas de 60 funcionarios en metodologias de innovacion, investigación empática, estrategia, diseño centrado en los ciudadanos, diseño de servicios para el sector público y capitalización del conocimiento, para dotarles de nuevas capacidades técnicas y conceptuales que les permiten generar programas y políticas basadas en derechos.
En cuatro capítulos se muestra de manera visual aquellas herramientas y metodologías clave, para mejorar el desempeño de instituciones y públicas y organizaciones civiles a nivel estructural y de prestación de servicios al ciudadano.
TrendsLab Barcelona 2014 : Laboratorio de tendencias e innovaciónLa innovation Kitchen
Within the frame of ELISAVA’s Master’s Degree in Research for Design and Innovation, we will develop a trend-analysis lab carried out in order to identify and apply trends in three main sectors: Social trends, fashion trends, and product trends.
The course provides the student with the tools for analyzing trends and planning them in future scenarios. It also supports the development of innovative projects.
It is predicted that age-related government expenditure for pensions, health and care will consume nearly 30% of Europe’s annual economic output by 2060.
Presentazione tenuta il 25 settembre 2012 presso Federmanager in occasione dell'evento "Comunicare il valore attraverso Social network e altri strumenti web: Enterprise 2.0"
The World 2050 Beyond the BRICs: A broader look at emerging market growth pro...PARIS
In the words of the report’s joint authors John Hawksworth and Gordon Cookson: "The general message is that investors with long-time horizons should look beyond the BRICs — there are many other alternatives worth considering depending on the nature of the investment and the risk tolerance of the investor."
Some of the highlighted projections of this latest analysis:
* By 2050, the E7 emerging economies will be around 50% larger than the current G7 (US, Japan, Germany, UK, France, Italy and Canada)
* China is expected to overtake the US as the largest economy in around 2025
* India has the potential to nearly catch up with the US by 2050
* The projected list of fastest growing economies to 2050 is headed by Vietnam, and the top 10 includes Nigeria, Philippines, Egypt and Bangladesh.
http://www.pwc.com/Extweb/pwcpublications.nsf/docid/146E4E4D52487154852573FA0058A179
Quality healthcare is one of the most important factors in how individuals perceive their quality of life. In some countries, such as the UK with the National Health Service (NHS), the healthcare delivery organisation is a part of their national identity.
The study was conducted by a team of MBA students from the Saïd Business School at the University of Oxford and the University of Oviedo’s Department of Applied Economics, and sponsored by Cisco
La Innovation Kitchen (LIK) is an experiential learning space where anyone can develop their innovation power and change-making skills through Project-Based-Learning and Learning-by-Doing Methods.
LIK helps grow both technical and soft skills that support the formation of a critical, creative, and proactive mindset oriented to complex problem-solving.
LIK's programs and activities involve real-life challenges that motivate participants and challenge sponsors to find practical solutions. We also provide a set of resources and mentors, that guide and support participants to develop unique solutions.
LIK has a deeply humanistic approach and a social, entrepreneurial, and professional concern for the future, in order to find new and better ways to participate in society, do business, create and run organizations and impact the natural and economic environment that surrounds us.
LIK is the evolution of traditional university or college learning program schemes, combined with a living lab and community-based action for a more agile, practical, and hands-on approach to creativity. All our efforts are applied to social and organizational problem-solving.
The Circular Economy 100 is a programme that will bring together 100 corporations together with emerging innovators and regions to accelerate the transition to a circular economy over an initial 1000-day innovation period
Hemos combinado dos herramientas muy potentes en el
proceso de pre-diseño: La Investigación de Tendencias y Las herramientas de Cocreación, Interdisciplinariedad y Design Thinking.
Honest Reviews of Tim Han LMA Course Program.pptxtimhan337
Personal development courses are widely available today, with each one promising life-changing outcomes. Tim Han’s Life Mastery Achievers (LMA) Course has drawn a lot of interest. In addition to offering my frank assessment of Success Insider’s LMA Course, this piece examines the course’s effects via a variety of Tim Han LMA course reviews and Success Insider comments.
Palestine last event orientationfvgnh .pptxRaedMohamed3
An EFL lesson about the current events in Palestine. It is intended to be for intermediate students who wish to increase their listening skills through a short lesson in power point.
Francesca Gottschalk - How can education support child empowerment.pptxEduSkills OECD
Francesca Gottschalk from the OECD’s Centre for Educational Research and Innovation presents at the Ask an Expert Webinar: How can education support child empowerment?
The Roman Empire A Historical Colossus.pdfkaushalkr1407
The Roman Empire, a vast and enduring power, stands as one of history's most remarkable civilizations, leaving an indelible imprint on the world. It emerged from the Roman Republic, transitioning into an imperial powerhouse under the leadership of Augustus Caesar in 27 BCE. This transformation marked the beginning of an era defined by unprecedented territorial expansion, architectural marvels, and profound cultural influence.
The empire's roots lie in the city of Rome, founded, according to legend, by Romulus in 753 BCE. Over centuries, Rome evolved from a small settlement to a formidable republic, characterized by a complex political system with elected officials and checks on power. However, internal strife, class conflicts, and military ambitions paved the way for the end of the Republic. Julius Caesar’s dictatorship and subsequent assassination in 44 BCE created a power vacuum, leading to a civil war. Octavian, later Augustus, emerged victorious, heralding the Roman Empire’s birth.
Under Augustus, the empire experienced the Pax Romana, a 200-year period of relative peace and stability. Augustus reformed the military, established efficient administrative systems, and initiated grand construction projects. The empire's borders expanded, encompassing territories from Britain to Egypt and from Spain to the Euphrates. Roman legions, renowned for their discipline and engineering prowess, secured and maintained these vast territories, building roads, fortifications, and cities that facilitated control and integration.
The Roman Empire’s society was hierarchical, with a rigid class system. At the top were the patricians, wealthy elites who held significant political power. Below them were the plebeians, free citizens with limited political influence, and the vast numbers of slaves who formed the backbone of the economy. The family unit was central, governed by the paterfamilias, the male head who held absolute authority.
Culturally, the Romans were eclectic, absorbing and adapting elements from the civilizations they encountered, particularly the Greeks. Roman art, literature, and philosophy reflected this synthesis, creating a rich cultural tapestry. Latin, the Roman language, became the lingua franca of the Western world, influencing numerous modern languages.
Roman architecture and engineering achievements were monumental. They perfected the arch, vault, and dome, constructing enduring structures like the Colosseum, Pantheon, and aqueducts. These engineering marvels not only showcased Roman ingenuity but also served practical purposes, from public entertainment to water supply.
Biological screening of herbal drugs: Introduction and Need for
Phyto-Pharmacological Screening, New Strategies for evaluating
Natural Products, In vitro evaluation techniques for Antioxidants, Antimicrobial and Anticancer drugs. In vivo evaluation techniques
for Anti-inflammatory, Antiulcer, Anticancer, Wound healing, Antidiabetic, Hepatoprotective, Cardio protective, Diuretics and
Antifertility, Toxicity studies as per OECD guidelines
A Strategic Approach: GenAI in EducationPeter Windle
Artificial Intelligence (AI) technologies such as Generative AI, Image Generators and Large Language Models have had a dramatic impact on teaching, learning and assessment over the past 18 months. The most immediate threat AI posed was to Academic Integrity with Higher Education Institutes (HEIs) focusing their efforts on combating the use of GenAI in assessment. Guidelines were developed for staff and students, policies put in place too. Innovative educators have forged paths in the use of Generative AI for teaching, learning and assessments leading to pockets of transformation springing up across HEIs, often with little or no top-down guidance, support or direction.
This Gasta posits a strategic approach to integrating AI into HEIs to prepare staff, students and the curriculum for an evolving world and workplace. We will highlight the advantages of working with these technologies beyond the realm of teaching, learning and assessment by considering prompt engineering skills, industry impact, curriculum changes, and the need for staff upskilling. In contrast, not engaging strategically with Generative AI poses risks, including falling behind peers, missed opportunities and failing to ensure our graduates remain employable. The rapid evolution of AI technologies necessitates a proactive and strategic approach if we are to remain relevant.
Operation “Blue Star” is the only event in the history of Independent India where the state went into war with its own people. Even after about 40 years it is not clear if it was culmination of states anger over people of the region, a political game of power or start of dictatorial chapter in the democratic setup.
The people of Punjab felt alienated from main stream due to denial of their just demands during a long democratic struggle since independence. As it happen all over the word, it led to militant struggle with great loss of lives of military, police and civilian personnel. Killing of Indira Gandhi and massacre of innocent Sikhs in Delhi and other India cities was also associated with this movement.
Embracing GenAI - A Strategic ImperativePeter Windle
Artificial Intelligence (AI) technologies such as Generative AI, Image Generators and Large Language Models have had a dramatic impact on teaching, learning and assessment over the past 18 months. The most immediate threat AI posed was to Academic Integrity with Higher Education Institutes (HEIs) focusing their efforts on combating the use of GenAI in assessment. Guidelines were developed for staff and students, policies put in place too. Innovative educators have forged paths in the use of Generative AI for teaching, learning and assessments leading to pockets of transformation springing up across HEIs, often with little or no top-down guidance, support or direction.
This Gasta posits a strategic approach to integrating AI into HEIs to prepare staff, students and the curriculum for an evolving world and workplace. We will highlight the advantages of working with these technologies beyond the realm of teaching, learning and assessment by considering prompt engineering skills, industry impact, curriculum changes, and the need for staff upskilling. In contrast, not engaging strategically with Generative AI poses risks, including falling behind peers, missed opportunities and failing to ensure our graduates remain employable. The rapid evolution of AI technologies necessitates a proactive and strategic approach if we are to remain relevant.
The French Revolution, which began in 1789, was a period of radical social and political upheaval in France. It marked the decline of absolute monarchies, the rise of secular and democratic republics, and the eventual rise of Napoleon Bonaparte. This revolutionary period is crucial in understanding the transition from feudalism to modernity in Europe.
For more information, visit-www.vavaclasses.com
BÀI TẬP BỔ TRỢ TIẾNG ANH GLOBAL SUCCESS LỚP 3 - CẢ NĂM (CÓ FILE NGHE VÀ ĐÁP Á...
Gap Aging presentation
1. The Global Aging
Preparedness Index
GAPINDEX.CSIS.ORG
Richard Jackson
Center for Strategic and International Studies
October 14, 2010
London
2. The world stands on the threshold of a
stunning demographic transformation. It’s
called global aging and it promises to affect
every dimension of social and economic life.
Perhaps most fatefully, it could call into
question the ability of societies to maintain
a decent standard of living for the old
without imposing a crushing burden on the
young.
3. Elderly (Aged 60 and Over), as a Percent of the Population in 2007 and 2040
India 7.2
15.6 Canada 18.6
31.5
Brazil 9.3
22.2 2007 France 21.6
31.6
Mexico 8.7 20.2
22.3 2040 Netherlands 32.2
Chile 12.2 22.2
25.0 Switzerland 32.7
US 17.2 17.9
25.4 Poland 33.5
China 11.3 21.9
27.9 Spain 37.9
UK 21.8 14.2
27.9 Korea 38.6
Australia 18.3 Germany 25.3
28.5 39.0
Russia 17.3 Italy 25.7
28.8 39.9
Sweden 24.0 Japan 28.1
29.6 43.3
0% 10% 20% 30% 40% 50% 0% 10% 20% 30% 40% 50%
4. The GAP Index
GAP Index Countries
The GAP Index provides a unique new Australia
quantitative assessment of the progress that Brazil
countries worldwide are making in preparing Canada
for the global aging challenge. Chile
China
France
The GAP Index projections extend through Germany
the year 2040 in order to capture the full India
impact of the demographic transformation Italy
now sweeping the world. Japan
Korea
Mexico
The GAP Index covers twenty Netherlands
countries, including both developed Poland
economies and emerging markets. Russia
Spain
Sweden
The GAP Index consists of two subindices—
Switzerland
the fiscal sustainability index and the
UK
income adequacy index. US
5. GAP FISCAL
SUSTAINABILITY INDEX
PUBLIC BURDEN FISCAL ROOM CATEGORY BENEFIT DEPENDENCE
CATEGORY Measures each country’s ability CATEGORY
Measures the magnitude of to accommodate the growth in Measures how dependent the
each country’s projected public its public old-age dependency elderly in each country are on
old-age dependency burden burden by raising taxes, cutting public benefits—and thus how
other spending, or borrowing politically difficult it may be to
reduce those benefits
BENEFIT BENEFIT TAX ROOM BUDGET BORROWING BENEFIT BENEFIT
LEVEL GROWTH INDICATOR ROOM ROOM SHARE CUT
INDICATOR INDICATOR Total INDICATOR INDICATOR INDICATOR INDICATOR
Total public The growth in Government Total public The net public Total public The % of
benefits to total public revenue in benefits to debt in 2040 as benefits as a elderly
the elderly in benefits to 2040 as a % the elderly in a % of % of elderly households
2040 as a % the elderly of 2040 as a % GDP, assumin income: that would be
of GDP from 2007 to GDP, assumi of g borrowing Average for pushed into
2040 as a % ng taxes are government pays for all 2007 to 2040 poverty by a
of GDP raised to pay outlays, assu growth in 10% cut in
for all growth ming cuts in public benefits public
in public other benefits in
benefits spending pay 2007 or the
for all growth most recent
in public available year
benefits
6. Public Burden Category
Benefit Level Indicator
Total Public Benefits to the Elderly, as a Percent of GDP, 2007–2040
2007 2020 2030 2040 2007 2020 2030 2040
1 India 1.9 3.1 4.2 3.6 11 Switzerland 9.8 12.6 15.7 17.4
2 Mexico 2.4 3.2 3.9 5.1 12 UK 12.1 14.0 16.4 18.2
3 Chile 6.0 6.8 7.0 7.5 13 Japan 14.1 15.4 15.9 18.4
4 China 2.8 4.6 6.1 8.0 14 Sweden 15.7 16.6 18.1 19.2
5 Russia 5.8 7.5 8.7 10.2 15 Brazil 8.8 12.5 16.3 20.4
6 Poland 10.1 12.0 13.1 13.9 16 Germany 15.8 17.3 20.0 21.7
7 Korea 3.4 7.5 11.0 14.1 17 Netherlands 12.0 15.7 20.0 23.2
8 Canada 8.3 10.9 13.2 14.7 18 France 16.6 19.4 21.8 23.5
9 Australia 8.9 10.7 12.9 14.9 19 Italy 18.0 19.9 22.3 24.7
10 US 8.9 12.5 15.1 16.3 20 Spain 14.3 17.0 20.6 26.1
Note: Countries are ranked from best to worst according to the projection results for 2040.
7. Public Burden Category
Benefit Growth Indicator
Growth in Total Public Benefits to the Elderly from 2007 to
2040, as a Percent of GDP
Chile 1.5 UK 6.1
India 1.6 Canada 6.4
Mexico 2.7 Italy 6.6
Sweden 3.5 France 6.8
Poland 3.8 US 7.4
Japan 4.3 Switzerland 7.6
Russia 4.4 Korea 10.7
China 5.2 Netherlands 11.2
Germany 5.9 Brazil 11.6
Australia 6.0 Spain 11.8
0% 5% 10% 15% 0% 5% 10% 15%
Note: Countries are ranked from best to worst.
8. Fiscal Room Category
Tax Room Indicator
Total Government Revenue as a Percent of GDP, Assuming Taxes Are Raised to
Pay for All Growth in Public Benefits, 2007–2040*
2007 2020 2030 2040 2007 2020 2030 2040
1 India 23.5 23.8 25.1 24.2 11 Korea 33.3 36.4 39.4 42.3
2 Mexico 22.6 22.9 23.4 24.4 12 Canada 40.7 41.5 43.5 45.0
3 Chile 29.5 26.4 26.4 26.9 13 UK 41.4 43.2 45.4 47.4
4 China 21.7 23.9 25.2 27.2 14 Brazil 34.8 39.6 43.5 47.4
5 Japan 33.5 33.7 34.0 36.2 15 Germany 43.9 43.9 45.8 47.5
6 Poland 40.3 39.4 39.8 40.4 16 Spain 41.1 42.4 45.6 50.3
7 Russia 40.0 38.0 38.9 40.5 17 Italy 46.4 47.7 49.5 51.4
8 Switzerland 33.9 35.9 38.8 40.6 18 Netherlands 45.7 47.8 51.5 54.7
9 Australia 35.7 36.6 38.7 40.6 19 France 49.6 52.4 54.6 56.3
10 US 34.0 37.6 40.3 41.7 20 Sweden 56.3 55.1 56.3 57.4
Note: Countries are ranked from best to worst according to the projection results for 2040.
* The projections assume that, beginning in 2015, each country moves to a debt-neutral fiscal balance in its ―rest of government‖
budget.
9. Fiscal Room Category
Budget Room Indicator
Total Public Benefits to the Elderly as a Percent of Government Outlays in 2007
and 2040, Assuming Cuts in Other Spending Pay for All Growth in Public Benefits*
India 6.7 US 24.2
12.5 44.1
Mexico 10.2 France 31.8
21.2 2007 44.9
Russia 17.3 Korea 12.0
27.9 2040 46.4
Chile 29.2 Germany 36.3
30.9 48.8
Poland 24.0 Netherlands 26.3
33.3 50.1
Sweden 29.9 Italy 37.7
35.5 51.0
Canada 21.2 Japan 39.2
36.3 51.0
China 12.6 Switzerland 30.4
36.3 52.6
UK 27.4 Brazil 23.8
41.2 55.6
Australia 26.0 Spain 36.4
42.5 64.0
0% 20% 40% 60% 80% 0% 20% 40% 60% 80%
Note: Countries are ranked from best to worst according to the projection results for 2040.
* The projections assume that, beginning in 2015, each country moves to a debt-neutral fiscal balance in its ―rest of government‖ budget.
10. Fiscal Room Category
Borrowing Room Indicator
Net Public Debt as a Percent of GDP, Assuming that Borrowing Pays for All
Growth in Public Benefits, 2007–2040*
2007 2020 2030 2040 2007 2020 2030 2040
1 Chile -13.7 -14.5 -26.0 -31.1 11 India† 78.3 84.6 80.0 108.0
2 Sweden -25.0 -12.9 -14.1 17.8 12 Germany 42.9 54.7 56.7 127.2
3 Russia 0.0 1.6 -6.2 32.0 13 Japan 80.4 104.6 114.9 133.6
4 China 1.7 -1.5 -1.1 39.0 14 France 34.0 60.7 73.5 149.2
5 Mexico 31.4 44.4 43.0 66.8 15 UK 28.8 58.3 76.9 152.6
6 Poland 17.0 32.4 41.7 70.1 16 Italy 87.1 100.8 103.6 168.2
7 Australia -6.6 -1.1 1.3 73.9 17 Netherlands 28.0 36.5 41.3 169.1
8 Korea -35.8 -33.4 -36.8 87.4 18 Spain 18.7 41.6 49.2 175.1
9 Switzerland 11.0 9.3 5.8 98.9 19 Brazil 42.0 37.3 37.2 175.2
10 Canada 23.1 32.6 32.7 104.8 20 US 42.3 65.0 76.2 179.0
Note: Countries are ranked from best to worst according to the projection results for 2040.
* The projections assume that, beginning in 2015, each country moves to a debt-neutral fiscal balance in its ―rest of government‖
budget.
† Data for India refer to gross debt.
11. Benefit Dependence Category
Benefit Share Indicator
Public Benefits, as a Percent of Elderly Income, 2007–2040
Average Average
2007 2020 2030 2040 2007 2020 2030 2040
2007-40 2007-40
1 Mexico 25.3 26.6 26.0 26.5 27.1 11 Netherlands 49.6 48.9 49.6 51.6 49.8
2 Chile 34.8 30.6 26.9 26.3 30.8 12 China 48.0 52.5 51.0 54.8 52.1
3 India 27.4 32.2 34.5 26.5 31.6 13 Sweden 53.6 52.6 51.2 52.8 52.5
4 US 35.1 37.2 38.8 40.3 38.1 14 UK 51.5 52.5 52.2 55.1 52.8
5 Australia 43.1 39.5 40.3 41.2 40.5 15 Russia 57.4 55.9 57.4 54.9 56.5
6 Korea 29.9 40.9 44.0 45.9 41.3 16 Italy 60.5 58.1 55.8 55.9 57.6
7 Japan 46.9 44.5 42.2 42.6 43.9 17 Brazil 64.2 62.6 62.3 62.2 62.8
8 Canada 43.8 43.3 44.8 46.0 44.2 18 Spain 63.1 63.3 63.0 64.2 64.0
9 Switzerland 41.5 43.6 44.9 47.1 44.3 19 France 66.7 65.8 66.2 67.4 66.3
10 Germany 54.5 47.8 45.2 47.1 48.4 20 Poland 77.1 68.6 63.0 56.7 66.8
Note: Countries are ranked from best to worst according to the average for 2007 to 2040.
12. Benefit Dependence Category
Benefit Cut Indicator
Percent of Elderly Households That Would Be Pushed into Poverty
Today by a 10 Percent Cut in Public Benefits*
India 0.1 Italy 3.3
Mexico 0.6 Spain 4.1
Korea 0.7 Russia 4.6
Brazil 1.2 Sweden 5.1
China 1.2 Canada 5.3
Poland 2.2 UK 5.8
Chile 2.3 Australia 5.9
France 2.8 Germany 6.2
Japan 2.9 Switzerland 6.3
US 3.0 Netherlands 7.7
0% 2% 4% 6% 8% 10% 0% 2% 4% 6% 8% 10%
Note: Countries are ranked from best to worst.
* Data refer to various years between 1999 and 2007 and exclude public health benefits. Poor households are
households with incomes beneath 50 percent of the median income for all households.
13. GAP INCOME
ADEQUACY INDEX
TOTAL INCOME INCOME VULNERABILITY FAMILY SUPPORT
CATEGORY CATEGORY CATEGORY
Measures the overall level of Measures income adequacy for Measures the strength of family
and trend in the income of the ―middle class‖ elders and the support networks in each
elderly relative to the nonelderly extent of elderly poverty in each country
in each country country
TOTAL TOTAL MEDIAN MEDIAN POVERTY FAMILY FAMILY
INCOME INCOME INCOME INCOME LEVEL TIES SIZE
LEVEL TREND LEVEL TREND INDICATOR INDICATOR INDICATOR
INDICATOR INDICATOR INDICATOR INDICATOR The % of the The % of the The change
The ratio of The % The ratio of The % elderly with elderly living in the
average after- change in the median after- change in the incomes in households average
tax elderly to ratio of tax elderly to ratio of beneath 50% with their number of
nonelderly average after- nonelderly median after- of the median adult children surviving
income in tax elderly to income in tax elderly to income for all in 2007 children of
2040, includin nonelderly 2040, excludi nonelderly persons in the elderly
g public income from ng public income from 2007 or the from 2007 to
health 2007 to health 2007 to most recent 2040
benefits 2040, includin benefits 2040, excludi available year
g public ng public
health health
benefits benefits
14. Total Income Category
Total Income Level Indicator
Ratio of Average After-Tax Elderly to Nonelderly Income, Including Public Health
Benefits, 2007–2040
2007 2020 2030 2040 2007 2020 2030 2040
1 Netherlands 1.29 1.37 1.52 1.72 11 Japan 1.19 1.12 1.11 1.12
2 US 1.43 1.54 1.62 1.67 12 Spain 1.00 1.06 1.05 1.06
3 Brazil 1.33 1.40 1.47 1.54 13 Italy 1.12 1.12 1.09 1.04
4 Germany 1.31 1.43 1.48 1.48 14 Switzerland 0.86 0.87 0.88 0.89
5 Chile 1.41 1.45 1.39 1.38 15 Mexico 0.94 0.88 0.85 0.82
6 Sweden 1.26 1.21 1.27 1.28 16 Korea 0.81 0.82 0.79 0.79
7 Australia 1.04 1.09 1.14 1.20 17 India 0.78 0.83 0.85 0.78
8 UK 1.05 1.08 1.14 1.19 18 Poland 0.75 0.70 0.76 0.74
9 Canada 1.13 1.11 1.11 1.14 19 Russia 0.68 0.65 0.65 0.71
10 France 1.16 1.09 1.10 1.13 20 China 0.52 0.53 0.50 0.51
Note: Countries are ranked from best to worst according to the projection results for 2040.
15. Total Income Category
Total Income Trend Indicator
Percent Change in the Ratio of Average After-Tax Elderly to Nonelderly
Income from 2007 to 2040, Including Public Health Benefits
Netherlands 32.9
Canada 0.7
US 17.0 India 0.5
Brazil 15.9 Poland -1.2
Australia 15.7 China -1.8
UK 13.4 Chile -2.2
Germany 13.0 Korea -2.9
Spain 5.7 France -3.1
Russia 3.9 Japan -5.6
Switzerland 3.8 Italy -6.6
Sweden 1.8 Mexico -12.7
-20% -10% 0% 10% 20% 30% 40% -20% -10% 0% 10% 20% 30% 40%
Note: Countries are ranked from best to worst.
16. Income Vulnerability Category
Median Income Level Indicator
Ratio of Median After-Tax Elderly to Nonelderly Income, Excluding Public Health
Benefits, 2007–2040*
2007 2020 2030 2040 2007 2020 2030 2040
1 Brazil 1.23 1.24 1.26 1.30 11 Italy 1.02 0.99 0.94 0.87
2 Netherlands 1.00 1.02 1.13 1.27 12 Canada 0.91 0.87 0.85 0.81
3 US 1.16 1.22 1.27 1.26 13 France 0.89 0.78 0.76 0.75
4 Germany 1.05 1.04 1.04 1.04 14 Poland 0.80 0.71 0.77 0.72
5 Chile 1.11 1.11 1.02 0.99 15 Switzerland 0.73 0.71 0.71 0.71
6 Japan 1.11 1.00 0.95 0.96 16 India 0.76 0.78 0.78 0.71
7 Sweden 0.94 0.92 0.94 0.94 17 Russia 0.64 0.59 0.58 0.61
8 Australia 0.89 0.85 0.88 0.93 18 Mexico 0.72 0.64 0.60 0.56
9 Spain 0.93 0.95 0.93 0.93 19 Korea 0.59 0.57 0.53 0.52
10 UK 0.88 0.88 0.90 0.93 20 China 0.39 0.38 0.35 0.34
Note: Countries are ranked from best to worst according to the projection results for 2040.
* Data for both the elderly and nonelderly refer to the third quintile of the income distribution.
17. Income Vulnerability Category
Median Income Trend Indicator
Percent Change in the Ratio of Median After-Tax Elderly to Nonelderly
Income from 2007 to 2040, Excluding Public Health Benefits*
Netherlands 27.7
India -6.9
US 8.8 Poland -9.4
Brazil 5.5 Canada -10.2
UK 5.3 Chile -10.8
Australia 4.6 China -12.1
Spain 0.1 Korea -13.2
Sweden -0.8 Japan -14.2
Germany -0.9 Italy -14.8
Switzerland -2.5 France -15.9
Russia -5.5 Mexico -21.9
-35% -25% -15% -5% 5% 15% 25% 35% -35% -25% -15% -5% 5% 15% 25% 35%
Note: Countries are ranked from best to worst.
* Data for both the elderly and nonelderly refer to the third quintile of the income distribution.
18. Income Vulnerability Category
Poverty Level Indicator
Percent of the Elderly Living in Poverty Today*
Netherlands 2.3 Chile 14.0
Poland 3.7 UK 15.4
Brazil 5.1 Australia 20.9
Sweden 5.5 India 21.8
France 8.1 Japan† 22.0
Canada 8.9 US 22.4
Germany 9.8 Spain 22.6
Italy 10.7 China 25.0
Switzerland 12.7 Mexico 25.5
Russia 13.8 Korea 36.2
0% 10% 20% 30% 40% 0% 10% 20% 30% 40%
Note: Countries are ranked from best to worst.
* Data refer to various years between 999 and 2007 and exclude public health benefits. Poor persons are
persons with incomes beneath 50 percent of the median income for all persons.
† Data for Japan refer to elderly aged 65 and older.
19. Family Support Category
Family Ties Indicator
Percent of the Elderly Living in Households with Their Adult
Children in 2007
Italy 28.2
India 82.8
China 64.0 Canada 20.5
Mexico 57.3 US 16.9
Chile 54.5 Australia 16.2
Brazil 51.3 France 10.5
Japan 44.0 UK 9.7
Spain 42.4 Germany 8.4
Russia 39.9 Switzerland 6.4
Korea 37.2 Netherlands 5.3
Poland 31.6 Sweden 4.1
0% 20% 40% 60% 80% 100% 0% 20% 40% 60% 80% 100%
Note: Countries are ranked from best to worst.
20. Family Support Category
Family Size Indicator
Average Number of Surviving Children of the Elderly: 2007, 2040, and Change
from 2007 to 2040
2007 2040 Change 2007 2040 Change
1 Sweden 2.1 2.0 -0.2 11 US 1.9 1.0 -1.0
2 Japan 2.0 1.5 -0.5 12 Australia 3.0 2.0 -1.0
3 Poland 2.6 2.0 -0.6 13 Netherlands 2.7 1.6 -1.1
4 UK 2.4 1.9 -0.6 14 Chile 3.5 2.4 -1.1
5 France 2.5 1.9 -0.6 15 Spain 2.7 1.4 -1.2
6 Germany 2.1 1.4 -0.7 16 Canada 3.2 1.7 -1.5
7 Switzerland 2.2 1.6 -0.7 17 China 3.5 2.0 -1.6
8 Russia 2.2 1.5 -0.7 18 Brazil 3.8 2.1 -1.7
9 India 3.5 2.6 -0.9 19 Korea 3.6 1.8 -1.8
10 Italy 2.3 1.4 -0.9 20 Mexico 5.0 2.6 -2.5
Note: Countries are ranked from best to worst according to the projected change from 2007 to 2040.
21. GAP Index Country Rankings
Fiscal Sustainability Index Income Adequacy Index
1 India 1 Netherlands
2 Mexico 2 Brazil
3 Chile 3 US
4 China 4 Germany
5 Russia 5 UK
6 Poland 6 Australia
7 Australia 7 Sweden
8 Japan 8 Chile
9 Canada 9 Spain
10 Sweden 10 India
11 US 11 Canada
12 Korea 12 Japan
13 Switzerland 13 Poland
14 Germany 14 Switzerland
15 UK 15 Russia
16 Italy 16 France
17 France 17 Italy
18 Brazil 18 China
19 Netherlands 19 Korea
20 Spain 20 Mexico
24. GAP Index Reform Strategy Guide
No Stars = ★★ =
★= ★★★=
Reform Guide Key Not a Significant
Low Priority High Priority
Priority Priority
Strategy 1: Stars refer to projected current-deal public
< 5% 5–10% 10–15% > 15%
pension benefits to the elderly in 2040 as a % of GDP
Strategy 2: Stars refer to projected public health
< 4% 4–6% 6–8% > 8%
benefits to the elderly in 2040 as a % of GDP
Strategy 3: Stars refer to projected labor-force
> 40% 30–40% 20–30% < 20%
participation rate of the elderly aged 60–74 in 2040
Strategy 4: Stars refer to projected funded pension
> 25% 15–25% 5–15% < 5%
benefits as a % of elderly cash income in 2040
Strategy 5: Stars refer to percent of the elderly living in
< 10% 10–20% 20–25% > 25%
relative poverty today
Strategy 6: Stars refer to projected total fertility rates
> 2.0 1.8–2.0 1.5–1.8 < 1.5
for the period 2010-2040
moderate aging moderate aging
& high & low
Strategy 7: Stars refer to a composite measure of net low aging & high high aging & low
immigration or immigration or
immigration rates and the degree of population aging † immigration
low aging & low high aging &
immigration
immigration high immigration
* Following our priority categories for strategy seven, India, which has a low net immigration rate and low aging, should receive one star. But
because its aging trend is so moderate compared with other Index countries, we make an exception and give it no stars.
† Countries are divided into low-immigration countries (those below the mean for all Index countries) and high-immigration countries (those above
the mean). They are also divided into three demographic groups according to the projected elderly share of the population in 2040: low (under
30%), moderate (30-35%), and high (over 35%).
25. Public Pension Benefits to the Elderly, as a Percent of GDP in 2007 and
2040: Current-Law versus Current-Deal Scenario*
Current Current Current Current
2007 Law Deal* 2007 Law Deal*
2040 2040 2040 2040
Australia 4.6 6.5 8.0 Korea 1.4 7.5 4.8
Brazil 6.5 13.4 16.1 Mexico 0.8 0.8 2.1
Canada 3.9 5.6 7.7 Netherlands 5.3 10.7 10.0
Chile 4.2 3.3 9.4 Poland 7.3 8.4 15.8
China 2.2 5.5 6.0 Russia 3.5 5.6 6.6
France 11.2 12.8 19.0 Spain 8.0 14.7 17.4
Germany 10.0 11.9 18.5 Sweden 8.8 9.9 11.8
India 1.4 2.2 2.7 Switzerland 5.4 8.5 9.2
Italy 12.3 15.1 23.5 UK 5.8 7.9 8.1
Japan 9.1 10.1 17.4 US 4.1 6.1 6.8
* The current-deal scenario assumes that workers in the future on average retire at the same age they do today
and that benefits replace the same share of wages.
26. Strategy 1: Reduce public pension benefits
Public Pension Benefits to the Elderly, as a Percent of GDP in 2007 and 2040:
Current-Law and Current-Deal Scenario*
Current Current Current Current
2007 Law Deal* Stars 2007 Law Deal* Stars
2040 2040 2040 2040
Mexico 0.8 0.8 2.1 zero Chile 4.2 3.3 9.4 ★
India 1.4 2.2 2.7 zero Netherlands 5.3 10.7 10.0 ★★
Korea 1.4 7.5 4.8 ★ Sweden 8.8 9.9 11.8 ★★
China 2.2 5.5 6.0 ★ Poland 7.3 8.4 15.8 ★★★
Russia 3.5 5.6 6.6 ★ Brazil 6.5 13.4 16.1 ★★★
US 4.1 6.1 6.8 ★ Spain 8.0 14.7 17.4 ★★★
Canada 3.9 5.6 7.7 ★ Japan 9.1 10.1 17.4 ★★★
Australia 4.6 6.5 8.0 ★ Germany 10.0 11.9 18.5 ★★★
UK 5.8 7.9 8.1 ★ France 11.2 12.8 19.0 ★★★
Switzerland 5.4 8.5 9.2 ★ Italy 12.3 15.1 23.5 ★★★
* The current-deal scenario assumes that workers in the future on average retire at the same age they do today
and that benefits replace the same share of wages.
★★ =
No Stars = ★= ★★★=
Reform Guide Key Significant
Not a Priority Low Priority High Priority
Priority
Strategy 1: Stars refer to projected current-deal public
< 5% 5–10% 10–15% > 15%
pension benefits to the elderly in 2040 as a % of GDP
27. Strategy 2: Reduce health-care cost growth
Public Health Benefits to the Elderly, as a Percent of GDP in 2007 and 2040
2007 2040 Stars 2007 2040 Stars
India 0.2 0.9 zero Sweden 4.9 6.7 ★★
China 0.6 2.3 zero Spain 3.1 6.9 ★★
Mexico 0.7 2.8 zero Japan 4.0 7.0 ★★
Chile 1.1 3.3 zero Germany 4.1 7.3 ★★
Russia 1.5 3.5 zero UK 4.0 7.5 ★★
Poland 1.7 3.7 zero Switzerland 3.4 7.6 ★★
Korea 1.3 5.4 ★ Canada 3.6 7.7 ★★
Brazil 1.4 5.4 ★ Netherlands 3.9 8.5 ★★★
Australia 2.7 6.1 ★★ France 4.5 9.2 ★★★
Italy 3.4 6.7 ★★ US 4.2 9.3 ★★★
★★ =
No Stars = ★= ★★★=
Reform Guide Key Significant
Not a Priority Low Priority High Priority
Priority
Strategy 2: Stars refer to projected public health benefits to
< 4% 4–6% 6–8% > 8%
the elderly in 2040 as a % of GDP
28. Strategy 3: Extend work lives
Labor-Force Participation Rate of the Elderly Aged 60–74 in 2007 and 2040
2007 2040 Stars 2007 2040 Stars
Korea 45.6 44.6 zero UK 25.3 29.3 ★★
Japan 40.9 41.7 zero China 31.0 27.8 ★★
US 36.5 41.0 zero India 26.4 25.4 ★★
Mexico 41.1 40.1 zero Russia 18.3 24.2 ★★
Chile 33.8 36.6 ★ Germany 15.7 23.5 ★★
Brazil 36.7 36.6 ★ Netherlands 18.2 22.4 ★★
Australia 27.0 30.2 ★ Poland 11.8 21.8 ★★
Canada 27.8 30.2 ★ Spain 15.2 17.6 ★★★
Sweden 33.5 30.1 ★ Italy 10.5 13.9 ★★★
Switzerland 30.7 30.0 ★ France 7.9 8.5 ★★★
★★ =
No Stars = ★= ★★★=
Reform Guide Key Significant
Not a Priority Low Priority High Priority
Priority
Strategy 3: Stars refer to projected labor-force participation
> 40% 30–40% 20–30% < 20%
rate of the elderly aged 60–74 in 2040
29. Strategy 4: Increase funded pension savings
Funded Pension Benefits as a Percent of Elderly Cash Income in 2007 and 2040
2007 2040 Stars 2007 2040 Stars
Netherlands 24.4 28.8 zero Brazil 2.2 8.2 ★★
Canada 26.8 28.6 zero Russia 0.4 8.1 ★★
Australia 15.6 28.5 zero Mexico 2.3 7.5 ★★
Switzerland 20.9 25.0 zero Japan 7.3 7.1 ★★
US 19.6 21.1 ★ India 1.7 6.9 ★★
Sweden 9.3 18.8 ★ Germany 2.7 6.7 ★★
Chile 9.3 16.6 ★ Italy 2.9 5.9 ★★
UK 16.3 16.3 ★ Spain 2.9 4.6 ★★★
Poland 0.0 14.3 ★★ Korea 4.1 3.9 ★★★
China 0.0 9.7 ★★ France 1.3 1.8 ★★★
★★ =
No Stars = ★= ★★★=
Reform Guide Key Significant
Not a Priority Low Priority High Priority
Priority
Strategy 4: Stars refer to projected funded pension benefits as
> 25% 15–25% 5–15% < 5%
a % of elderly cash income in 2040
30. Strategy 5: Strengthen poverty floors
Percent of the Elderly Living in Poverty Today*
2007 Stars 2007 Stars
Netherlands 2.3 zero Chile 14.0 ★
Poland 3.7 zero UK 15.4 ★
Brazil 5.1 zero Australia 20.9 ★★
Sweden 5.5 zero India 21.8 ★★
France 8.1 zero Japan† 22.0 ★★
Canada 8.9 zero US 22.4 ★★
Germany 9.8 zero Spain 22.6 ★★
Italy 10.7 ★ China 25.0 ★★★
Switzerland 12.7 ★ Mexico 25.5 ★★★
Russia 13.8 ★ Korea 36.2 ★★★
* Data refer to various years between 1999 and 2007 and exclude public health benefits. Poor persons are
persons with incomes beneath 50 percent of the median income for all persons.
† Data for Japan refer to elderly aged 65 and older.
★★ =
No Stars = ★= ★★★=
Reform Guide Key Significant
Not a Priority Low Priority High Priority
Priority
Strategy 5: Stars refer to percent of the elderly living in
< 10% 10–20% 20–25% > 25%
relative poverty today
31. Strategy 6: Increase fertility rates
Total Fertility Rate: Average for 2010-2040
Average Average
Stars Stars
2010-2040 2010-2040
India 2.2 zero Netherlands 1.7 ★★
Mexico 2.2 zero Canada 1.6 ★★
US 2.1 zero Switzerland 1.5 ★★★
Chile 1.9 ★ Spain 1.4 ★★★
Brazil 1.9 ★ Italy 1.4 ★★★
France 1.9 ★ Russia 1.4 ★★★
Sweden 1.9 ★ Germany 1.3 ★★★
UK 1.8 ★ Japan 1.3 ★★★
Australia 1.8 ★ Poland 1.3 ★★★
China 1.8 ★★ Korea 1.2 ★★★
★★ =
No Stars = ★= ★★★=
Reform Guide Key Significant
Not a Priority Low Priority High Priority
Priority
Strategy 6: Stars refer to projected total fertility rates for the
> 2.0 1.8–2.0 1.5–1.8 < 1.5
period 2010-2040
32. Strategy 7: Increase immigration
Aging Immigration Aging Immigration
Stars Stars
Group Group Group Group
India Low Low zero Canada Med High ★
Australia Low High zero France Med High ★
Sweden Low High zero Switzerland Med High ★
UK Low High zero Netherlands Med Low ★★
US Low High zero Poland Med Low ★★
Brazil Low Low ★ Italy High High ★★
Chile Low Low ★ Spain High High ★★
China Low Low ★ Germany High Low ★★★
Mexico Low Low ★ Japan High Low ★★★
Russia Low Low ★ Korea High Low ★★★
★★ =
No Stars = ★= ★★★=
Reform Guide Key Significant
Not a Priority Low Priority High Priority
Priority
moderate aging
moderate aging
& low
low aging & & high
Strategy 7: Stars refer to a composite measure of net immigration or high aging &
high immigration or
immigration rates and the degree of population aging* high aging & low immigration
immigration low aging & low
high
immigration
immigration
* Countries are divided into low-immigration countries (those below the mean for all Index countries) and high-immigration countries
(those above the mean). They are also divided into three demographic groups according to the projected elderly share of the
population in 2040: low (under 30%), moderate (30-35%), and high (over 35%).