Dokumen tersebut membahas penggunaan WEKA untuk melakukan klasifikasi data, termasuk kasus klasifikasi bunga iris, neural network, dan SVM. Berbagai parameter dan metode evaluasi akurasi dijelaskan."
Introduction to Dataminingusing WEKA
Anto Satriyo Nugroho
Center for Information & Communication Technology
Agency for the Assessment & Application of Technology, Indonesia
Email: asnugroho@ieee.org
2.
2
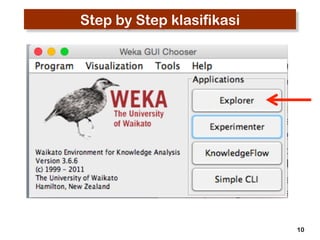
Practicing WEKA
• What is WEKA ?
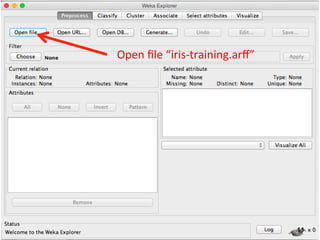
• Formatting the data into ARFF
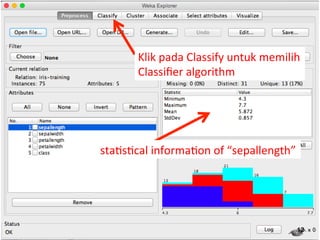
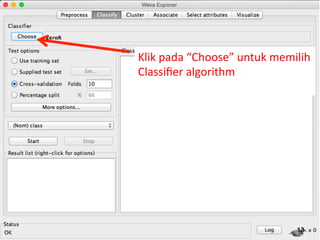
• Klasifikasi
– Tahapan membangun classifier
– Contoh kasus : Klasifikasi bunga iris
– Tahapan membangun classifier
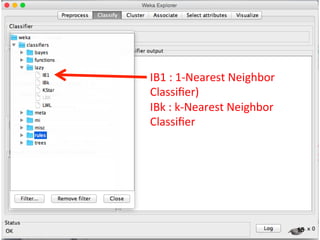
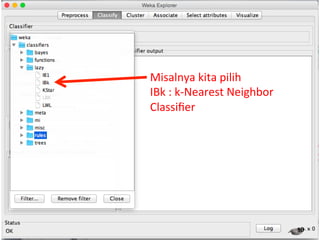
– Merangkum hasil eksperimen k-Nearest Neighbor Classifier
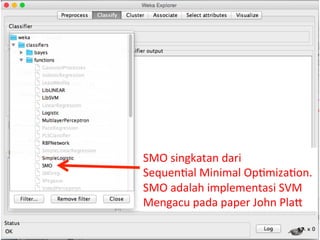
– Eksperimen memakai classifier yang lain (JST, SVM)
– Classification of cancers based on gene expression
– Parkinson Disease Detection
• K-Means Clustering
3.
3
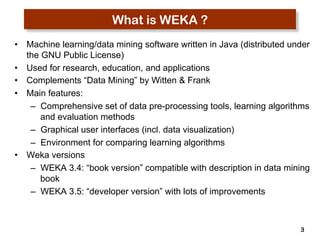
What isWEKA ?
• Machine learning/data mining software written in Java (distributed under
the GNU Public License)
• Used for research, education, and applications
• Complements “Data Mining” by Witten & Frank
• Main features:
– Comprehensive set of data pre-processing tools, learning algorithms
and evaluation methods
– Graphical user interfaces (incl. data visualization)
– Environment for comparing learning algorithms
• Weka versions
– WEKA 3.4: “book version” compatible with description in data mining
book
– WEKA 3.5: “developer version” with lots of improvements
4.
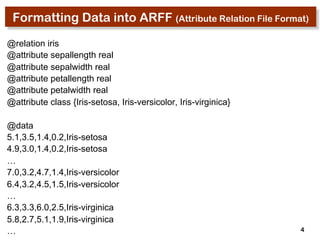
Formatting Data intoARFF (Attribute Relation File Format)
4
@relation iris
@attribute sepallength real
@attribute sepalwidth real
@attribute petallength real
@attribute petalwidth real
@attribute class {Iris-setosa, Iris-versicolor, Iris-virginica}
@data
5.1,3.5,1.4,0.2,Iris-setosa
4.9,3.0,1.4,0.2,Iris-setosa
…
7.0,3.2,4.7,1.4,Iris-versicolor
6.4,3.2,4.5,1.5,Iris-versicolor
…
6.3,3.3,6.0,2.5,Iris-virginica
5.8,2.7,5.1,1.9,Iris-virginica
…
5.
5
Practicing WEKA
• What is WEKA ?
• Formatting the data into ARFF
• Klasifikasi
– Tahapan membangun classifier
– Contoh kasus : Klasifikasi bunga iris
– Tahapan membangun classifier
– Merangkum hasil eksperimen k-Nearest Neighbor Classifier
– Eksperimen memakai classifier yang lain (JST, SVM)
– Classification of cancers based on gene expression
– Parkinson Disease Detection
• K-Means Clustering
6.
6
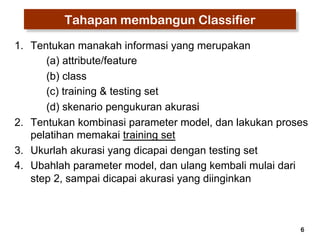
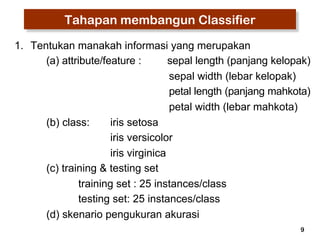
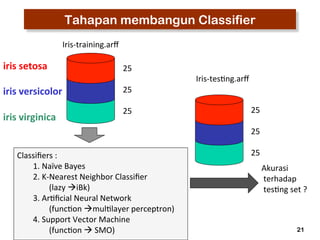
Tahapan membangunClassifier
1. Tentukan manakah informasi yang merupakan
(a) attribute/feature
(b) class
(c) training & testing set
(d) skenario pengukuran akurasi
2. Tentukan kombinasi parameter model, dan lakukan proses
pelatihan memakai training set
3. Ukurlah akurasi yang dicapai dengan testing set
4. Ubahlah parameter model, dan ulang kembali mulai dari
step 2, sampai dicapai akurasi yang diinginkan
7.
7
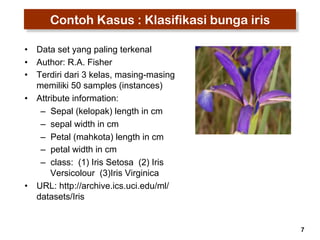
Contoh Kasus: Klasifikasi bunga iris
• Data set yang paling terkenal
• Author: R.A. Fisher
• Terdiri dari 3 kelas, masing-masing
memiliki 50 samples (instances)
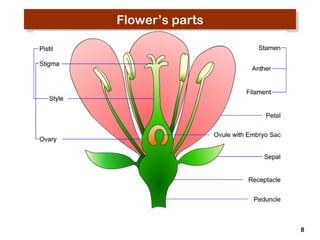
• Attribute information:
– Sepal (kelopak) length in cm
– sepal width in cm
– Petal (mahkota) length in cm
– petal width in cm
– class: (1) Iris Setosa (2) Iris
Versicolour (3)Iris Virginica
• URL: http://archive.ics.uci.edu/ml/
datasets/Iris
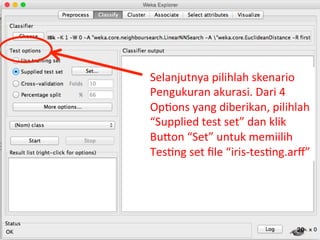
Selanjutnya
pilihlah
skenario
Pengukuran
akurasi.
Dari
4
Op3ons
yang
diberikan,
pilihlah
“Supplied
test
set”
dan
klik
BuQon
“Set”
untuk
memiilih
Tes3ng
set
file
“iris-‐tes3ng.arff”
20
22
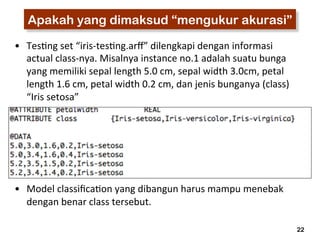
Apakah yangdimaksud “mengukur akurasi”
• Tes3ng
set
“iris-‐tes3ng.arff”
dilengkapi
dengan
informasi
actual
class-‐nya.
Misalnya
instance
no.1
adalah
suatu
bunga
yang
memiliki
sepal
length
5.0
cm,
sepal
width
3.0cm,
petal
length
1.6
cm,
petal
width
0.2
cm,
dan
jenis
bunganya
(class)
“Iris
setosa”
• Model
classifica3on
yang
dibangun
harus
mampu
menebak
dengan
benar
class
tersebut.
23.
23
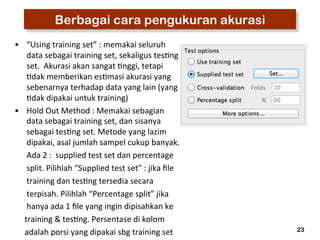
Berbagai carapengukuran akurasi
• “Using
training
set”
:
memakai
seluruh
data
sebagai
training
set,
sekaligus
tes3ng
set.
Akurasi
akan
sangat
3nggi,
tetapi
3dak
memberikan
es3masi
akurasi
yang
sebenarnya
terhadap
data
yang
lain
(yang
3dak
dipakai
untuk
training)
• Hold
Out
Method
:
Memakai
sebagian
data
sebagai
training
set,
dan
sisanya
sebagai
tes3ng
set.
Metode
yang
lazim
dipakai,
asal
jumlah
sampel
cukup
banyak.
Ada
2
:
supplied
test
set
dan
percentage
split.
Pilihlah
“Supplied
test
set”
:
jika
file
training
dan
tes3ng
tersedia
secara
terpisah.
Pilihlah
“Percentage
split”
jika
hanya
ada
1
file
yang
ingin
dipisahkan
ke
training
&
tes3ng.
Persentase
di
kolom
adalah
porsi
yang
dipakai
sbg
training
set
24.
24
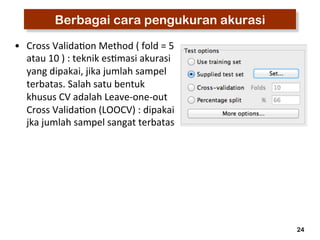
Berbagai carapengukuran akurasi
• Cross
Valida3on
Method
(
fold
=
5
atau
10
)
:
teknik
es3masi
akurasi
yang
dipakai,
jika
jumlah
sampel
terbatas.
Salah
satu
bentuk
khusus
CV
adalah
Leave-‐one-‐out
Cross
Valida3on
(LOOCV)
:
dipakai
jka
jumlah
sampel
sangat
terbatas
25.
25
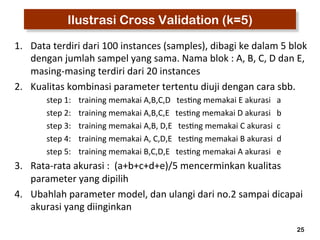
Ilustrasi CrossValidation (k=5)
1. Data
terdiri
dari
100
instances
(samples),
dibagi
ke
dalam
5
blok
dengan
jumlah
sampel
yang
sama.
Nama
blok
:
A,
B,
C,
D
dan
E,
masing-‐masing
terdiri
dari
20
instances
2. Kualitas
kombinasi
parameter
tertentu
diuji
dengan
cara
sbb.
step
1:
training
memakai
A,B,C,D
tes3ng
memakai
E
akurasi
a
step
2:
training
memakai
A,B,C,E
tes3ng
memakai
D
akurasi
b
step
3:
training
memakai
A,B,
D,E
tes3ng
memakai
C
akurasi
c
step
4:
training
memakai
A,
C,D,E
tes3ng
memakai
B
akurasi
d
step
5:
training
memakai
B,C,D,E
tes3ng
memakai
A
akurasi
e
3. Rata-‐rata
akurasi
:
(a+b+c+d+e)/5
mencerminkan
kualitas
parameter
yang
dipilih
4. Ubahlah
parameter
model,
dan
ulangi
dari
no.2
sampai
dicapai
akurasi
yang
diinginkan
26.
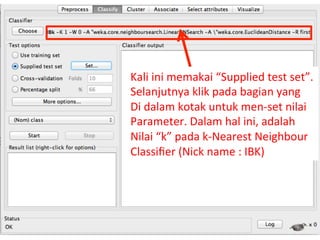
Kali
ini
memakai
“Supplied
test
set”.
Selanjutnya
klik
pada
bagian
yang
Di
dalam
kotak
untuk
men-‐set
nilai
Parameter.
Dalam
hal
ini,
adalah
Nilai
“k”
pada
k-‐Nearest
Neighbour
Classifier
(Nick
name
:
IBK)
26
27.
27
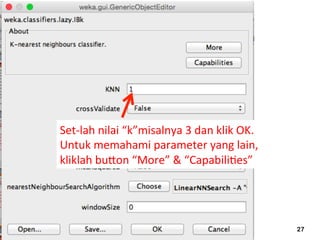
Set-‐lah
nilai
“k”misalnya
3
dan
klik
OK.
Untuk
memahami
parameter
yang
lain,
kliklah
buQon
“More”
&
“Capabili3es”
28.
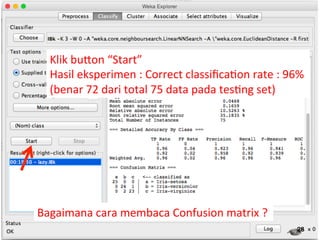
Klik
buQon
“Start”
Hasil
eksperimen
:
Correct
classifica3on
rate
:
96%
(benar
72
dari
total
75
data
pada
tes3ng
set)
28
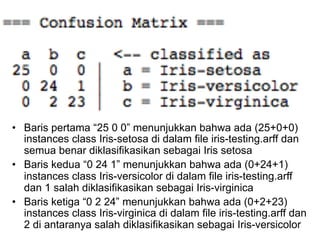
Bagaimana
cara
membaca
Confusion
matrix
?
29.
• Baris pertama“25 0 0” menunjukkan bahwa ada (25+0+0)
instances class Iris-setosa di dalam file iris-testing.arff dan
semua benar diklasifikasikan sebagai Iris setosa
• Baris kedua “0 24 1” menunjukkan bahwa ada (0+24+1)
instances class Iris-versicolor di dalam file iris-testing.arff
dan 1 salah diklasifikasikan sebagai Iris-virginica
• Baris ketiga “0 2 24” menunjukkan bahwa ada (0+2+23)
instances class Iris-virginica di dalam file iris-testing.arff dan
2 di antaranya salah diklasifikasikan sebagai Iris-versicolor
30.
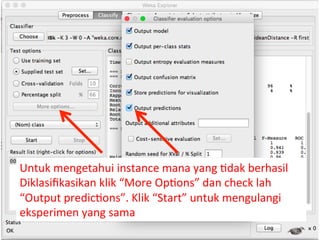
Untuk
mengetahui
instance
mana
yang
3dak
berhasil
Diklasifikasikan
klik
“More
Op3ons”
dan
check
lah
“Output
predic3ons”.
Klik
“Start”
untuk
mengulangi
eksperimen
yang
sama
31.
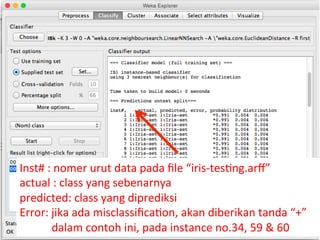
Inst#
:
nomer
urut
data
pada
file
“iris-‐tes3ng.arff”
actual
:
class
yang
sebenarnya
predicted:
class
yang
diprediksi
Error:
jika
ada
misclassifica3on,
akan
diberikan
tanda
“+”
dalam
contoh
ini,
pada
instance
no.34,
59
&
60
32.
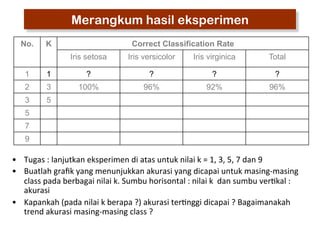
Merangkum hasil eksperimen
No. K Correct Classification Rate
Iris setosa Iris versicolor Iris virginica Total
1 1 ? ? ? ?
2 3 100% 96% 92% 96%
3 5
5
7
9
• Tugas
:
lanjutkan
eksperimen
di
atas
untuk
nilai
k
=
1,
3,
5,
7
dan
9
• Buatlah
grafik
yang
menunjukkan
akurasi
yang
dicapai
untuk
masing-‐masing
class
pada
berbagai
nilai
k.
Sumbu
horisontal
:
nilai
k
dan
sumbu
ver3kal
:
akurasi
• Kapankah
(pada
nilai
k
berapa
?)
akurasi
ter3nggi
dicapai
?
Bagaimanakah
trend
akurasi
masing-‐masing
class
?
33.
33
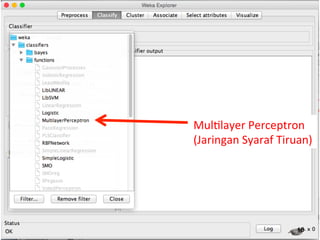
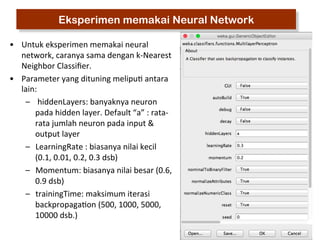
Eksperimen memakaiNeural Network
• Untuk
eksperimen
memakai
neural
network,
caranya
sama
dengan
k-‐Nearest
Neighbor
Classifier.
• Parameter
yang
dituning
melipu3
antara
lain:
–
hiddenLayers:
banyaknya
neuron
pada
hidden
layer.
Default
“a”
:
rata-‐
rata
jumlah
neuron
pada
input
&
output
layer
– LearningRate
:
biasanya
nilai
kecil
(0.1,
0.01,
0.2,
0.3
dsb)
– Momentum:
biasanya
nilai
besar
(0.6,
0.9
dsb)
– trainingTime:
maksimum
iterasi
backpropaga3on
(500,
1000,
5000,
10000
dsb.)
37
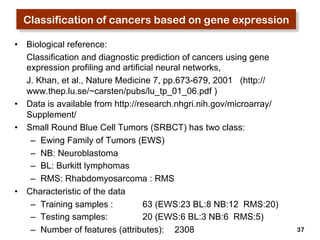
Classification ofcancers based on gene expression
• Biological reference:
Classification and diagnostic prediction of cancers using gene
expression profiling and artificial neural networks,
J. Khan, et al., Nature Medicine 7, pp.673-679, 2001 (http://
www.thep.lu.se/~carsten/pubs/lu_tp_01_06.pdf )
• Data is available from http://research.nhgri.nih.gov/microarray/
Supplement/
• Small Round Blue Cell Tumors (SRBCT) has two class:
– Ewing Family of Tumors (EWS)
– NB: Neuroblastoma
– BL: Burkitt lymphomas
– RMS: Rhabdomyosarcoma : RMS
• Characteristic of the data
– Training samples : 63 (EWS:23 BL:8 NB:12 RMS:20)
– Testing samples: 20 (EWS:6 BL:3 NB:6 RMS:5)
– Number of features (attributes): 2308
38.
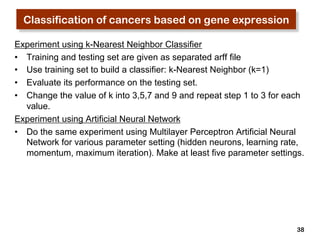
Classification of cancersbased on gene expression
Experiment using k-Nearest Neighbor Classifier
• Training and testing set are given as separated arff file
• Use training set to build a classifier: k-Nearest Neighbor (k=1)
• Evaluate its performance on the testing set.
• Change the value of k into 3,5,7 and 9 and repeat step 1 to 3 for each
38
value.
Experiment using Artificial Neural Network
• Do the same experiment using Multilayer Perceptron Artificial Neural
Network for various parameter setting (hidden neurons, learning rate,
momentum, maximum iteration). Make at least five parameter settings.
39.
39
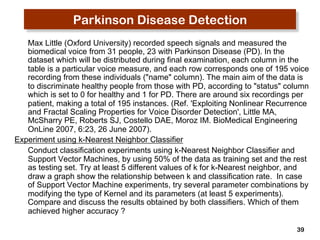
Parkinson DiseaseDetection
Max Little (Oxford University) recorded speech signals and measured the
biomedical voice from 31 people, 23 with Parkinson Disease (PD). In the
dataset which will be distributed during final examination, each column in the
table is a particular voice measure, and each row corresponds one of 195 voice
recording from these individuals ("name" column). The main aim of the data is
to discriminate healthy people from those with PD, according to "status" column
which is set to 0 for healthy and 1 for PD. There are around six recordings per
patient, making a total of 195 instances. (Ref. 'Exploiting Nonlinear Recurrence
and Fractal Scaling Properties for Voice Disorder Detection', Little MA,
McSharry PE, Roberts SJ, Costello DAE, Moroz IM. BioMedical Engineering
OnLine 2007, 6:23, 26 June 2007).
Experiment using k-Nearest Neighbor Classifier
Conduct classification experiments using k-Nearest Neighbor Classifier and
Support Vector Machines, by using 50% of the data as training set and the rest
as testing set. Try at least 5 different values of k for k-Nearest neighbor, and
draw a graph show the relationship between k and classification rate. In case
of Support Vector Machine experiments, try several parameter combinations by
modifying the type of Kernel and its parameters (at least 5 experiments).
Compare and discuss the results obtained by both classifiers. Which of them
achieved higher accuracy ?
40.
40
Parkinson DiseaseDetection
Max Little (Oxford University) recorded speech signals and measured the
biomedical voice from 31 people, 23 with Parkinson Disease (PD). In the
dataset which will be distributed during final examination, each column in the
table is a particular voice measure, and each row corresponds one of 195 voice
recording from these individuals ("name" column). The main aim of the data is
to discriminate healthy people from those with PD, according to "status" column
which is set to 0 for healthy and 1 for PD. There are around six recordings per
patient, making a total of 195 instances. (Ref. 'Exploiting Nonlinear Recurrence
and Fractal Scaling Properties for Voice Disorder Detection', Little MA,
McSharry PE, Roberts SJ, Costello DAE, Moroz IM. BioMedical Engineering
OnLine 2007, 6:23, 26 June 2007).
Experiment using k-Nearest Neighbor Classifier
Conduct classification experiments using k-Nearest Neighbor Classifier and
Support Vector Machines, by using 50% of the data as training set and the rest
as testing set. Try at least 5 different values of k for k-Nearest neighbor, and
draw a graph show the relationship between k and classification rate. In case
of Support Vector Machine experiments, try several parameter combinations by
modifying the type of Kernel and its parameters (at least 5 experiments).
Compare and discuss the results obtained by both classifiers. Which of them
achieved higher accuracy ?
41.
41
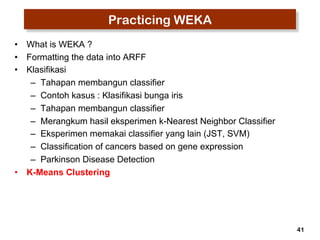
Practicing WEKA
• What is WEKA ?
• Formatting the data into ARFF
• Klasifikasi
– Tahapan membangun classifier
– Contoh kasus : Klasifikasi bunga iris
– Tahapan membangun classifier
– Merangkum hasil eksperimen k-Nearest Neighbor Classifier
– Eksperimen memakai classifier yang lain (JST, SVM)
– Classification of cancers based on gene expression
– Parkinson Disease Detection
• K-Means Clustering
42.
42
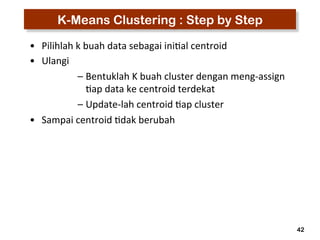
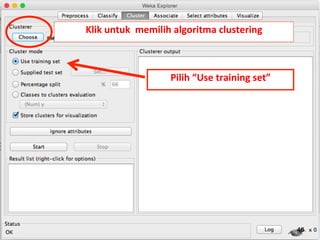
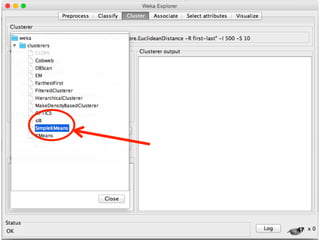
K-Means Clustering: Step by Step
• Pilihlah
k
buah
data
sebagai
ini3al
centroid
• Ulangi
– Bentuklah
K
buah
cluster
dengan
meng-‐assign
3ap
data
ke
centroid
terdekat
– Update-‐lah
centroid
3ap
cluster
• Sampai
centroid
3dak
berubah
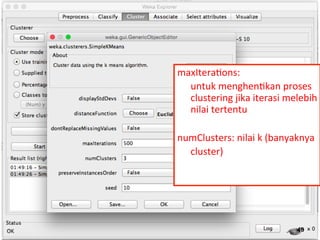
maxItera3ons:
untuk
menghen3kan
proses
clustering
jika
iterasi
melebih
nilai
tertentu
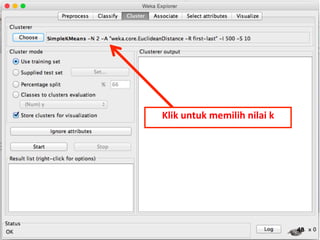
numClusters:
nilai
k
(banyaknya
cluster)
49
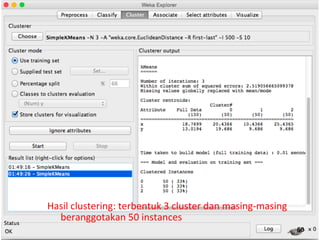
50.
50
Hasil
clustering:
terbentuk
3
cluster
dan
masing-‐masing
beranggotakan
50
instances
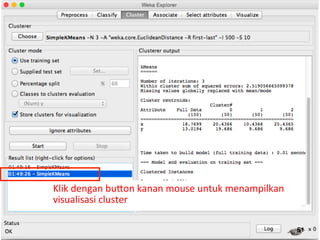
51.
51
Klik
dengan
buQon
kanan
mouse
untuk
menampilkan
visualisasi
cluster
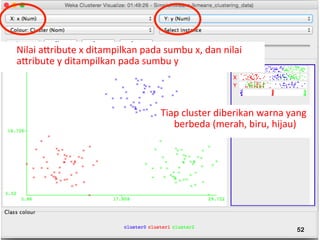
52.
52
Nilai
aQribute
x
ditampilkan
pada
sumbu
x,
dan
nilai
aQribute
y
ditampilkan
pada
sumbu
y
Tiap
cluster
diberikan
warna
yang
berbeda
(merah,
biru,
hijau)