Downloaded 23 times

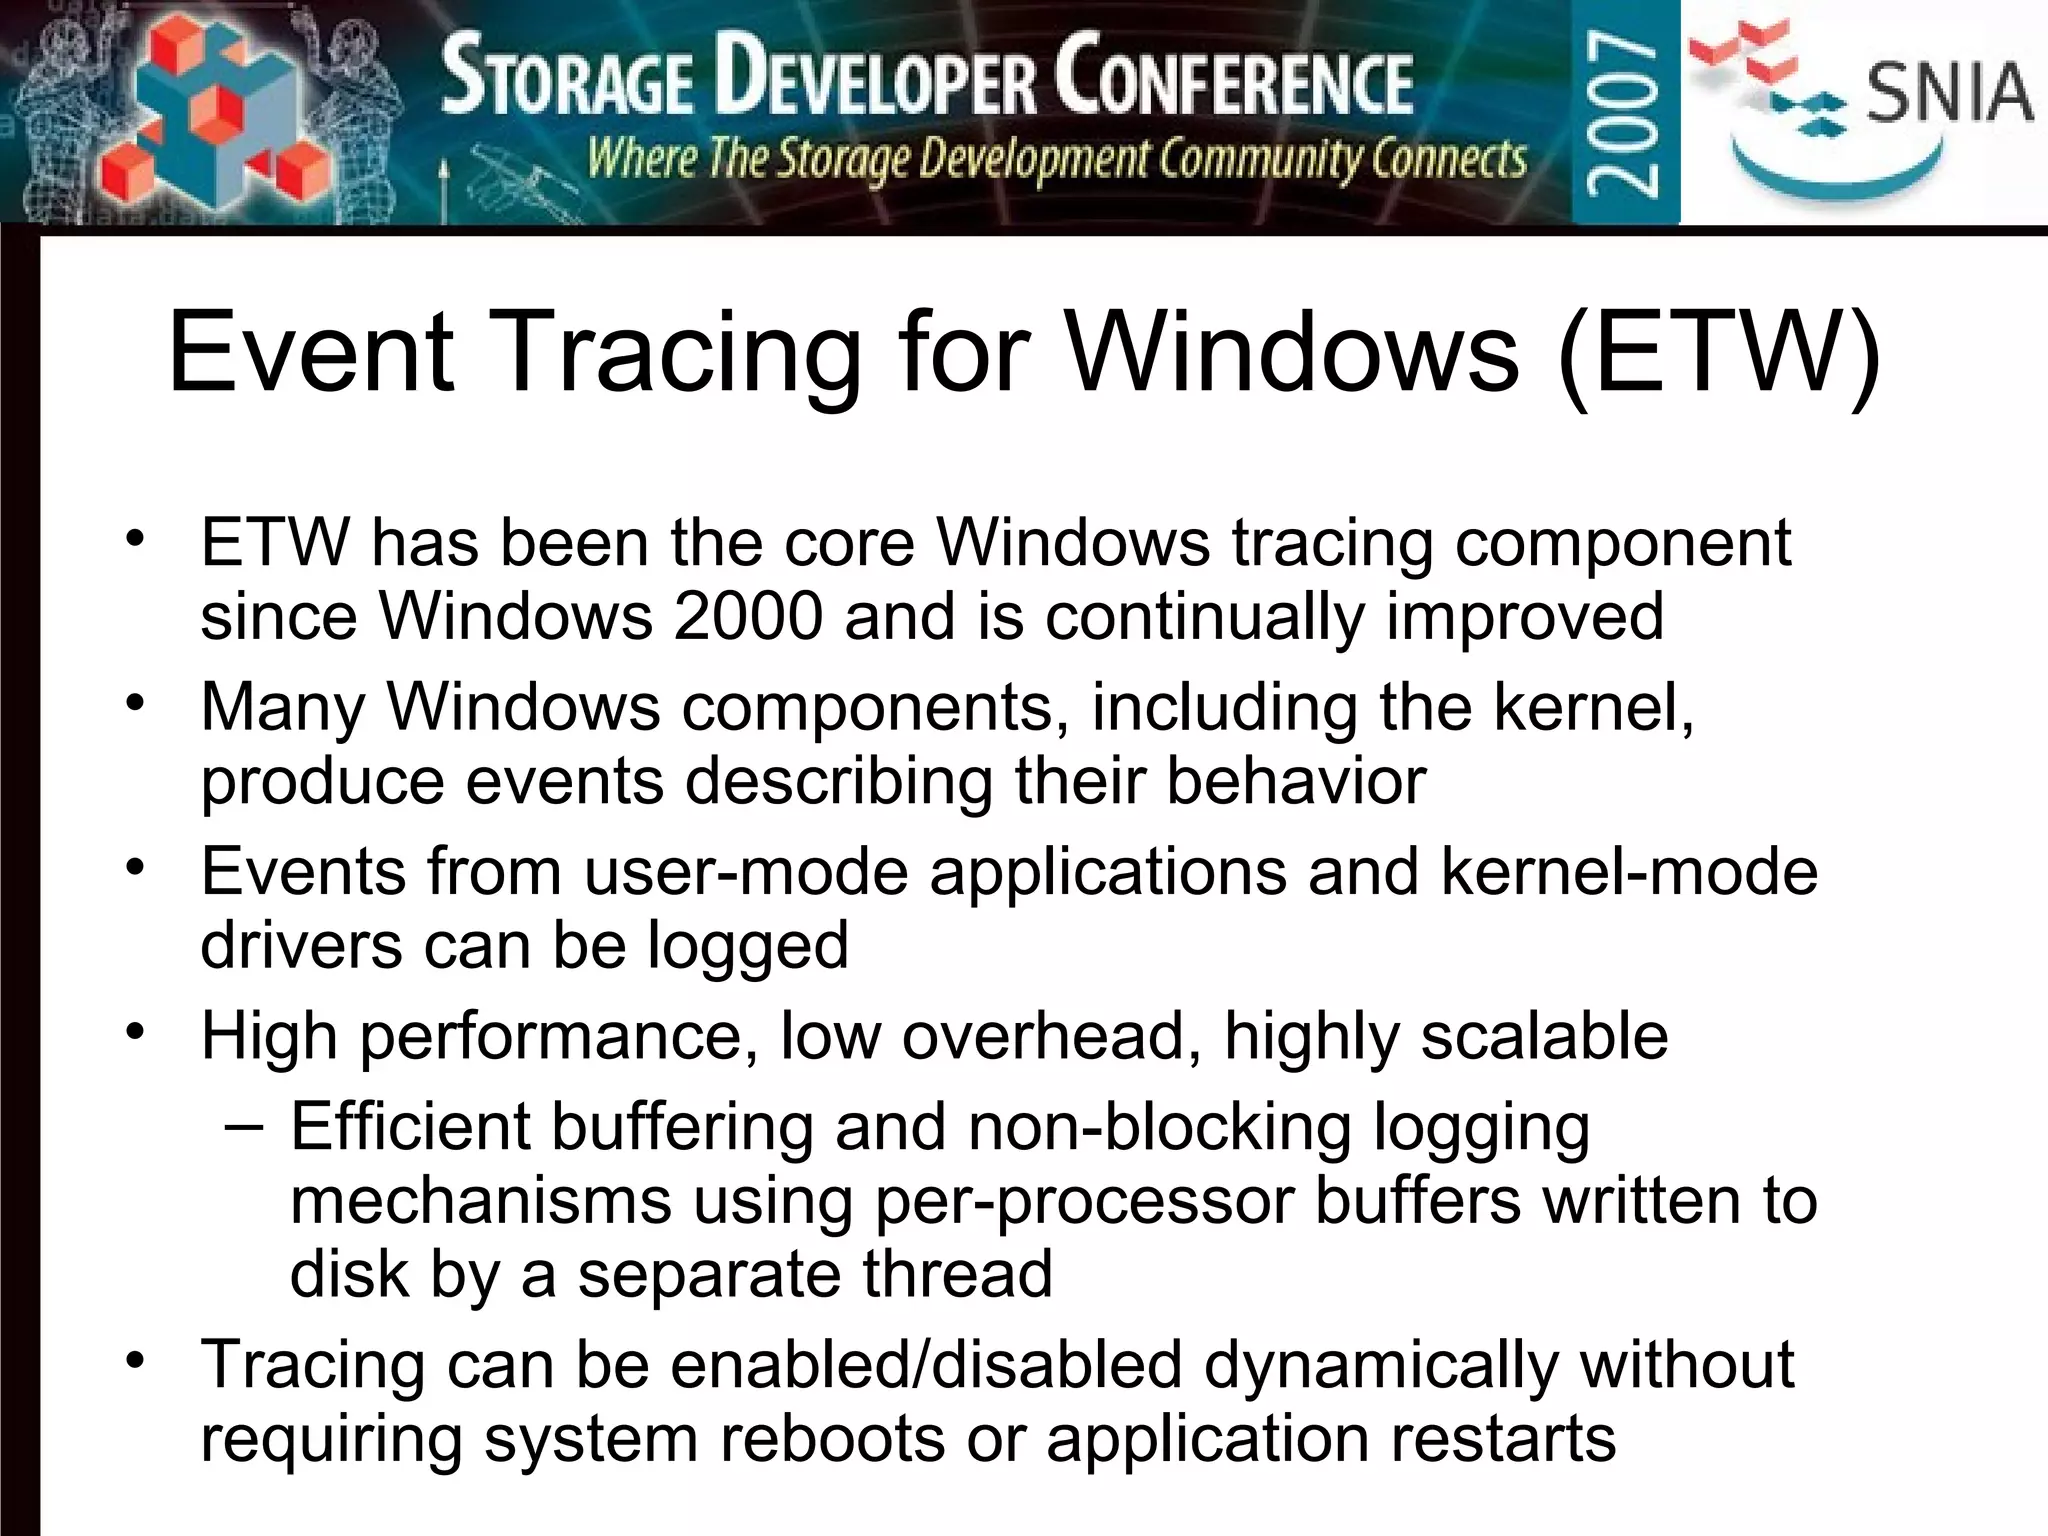
![Event Tracing for Windows (ETW)
• Events can be sample-based, but most are single-instance (event A
occurred at time T)
• Support for real-time consumption and file-based tracing
• Configurable logging mode, buffer size, buffer count
– Sequential traces
– Circular traces
– Circular traces in memory (flight black-box) [Vista]
• Adding custom events enables better correlation of application activity with
low-level resource usage
• On a standard Vista computer, the logging API (EventWrite) takes about
5,000 cycles, mostly spent in acquiring the timestamp via
QueryPerformanceCounter (QPC)
– About 2.5% processor overhead for a sustained rate of 10,000
events/second on a 2GHz processor – not including the cost of flushing
trace buffers to disk
• Postprocessing the binary disk log correlates events with context and
domain specific knowledge](https://image.slidesharecdn.com/capturingcomprehensivestorageworkloadtracesinwindows-150919172405-lva1-app6891/75/Capturing-comprehensive-storage-workload-traces-in-windows-5-2048.jpg)


![Dumping a Trace
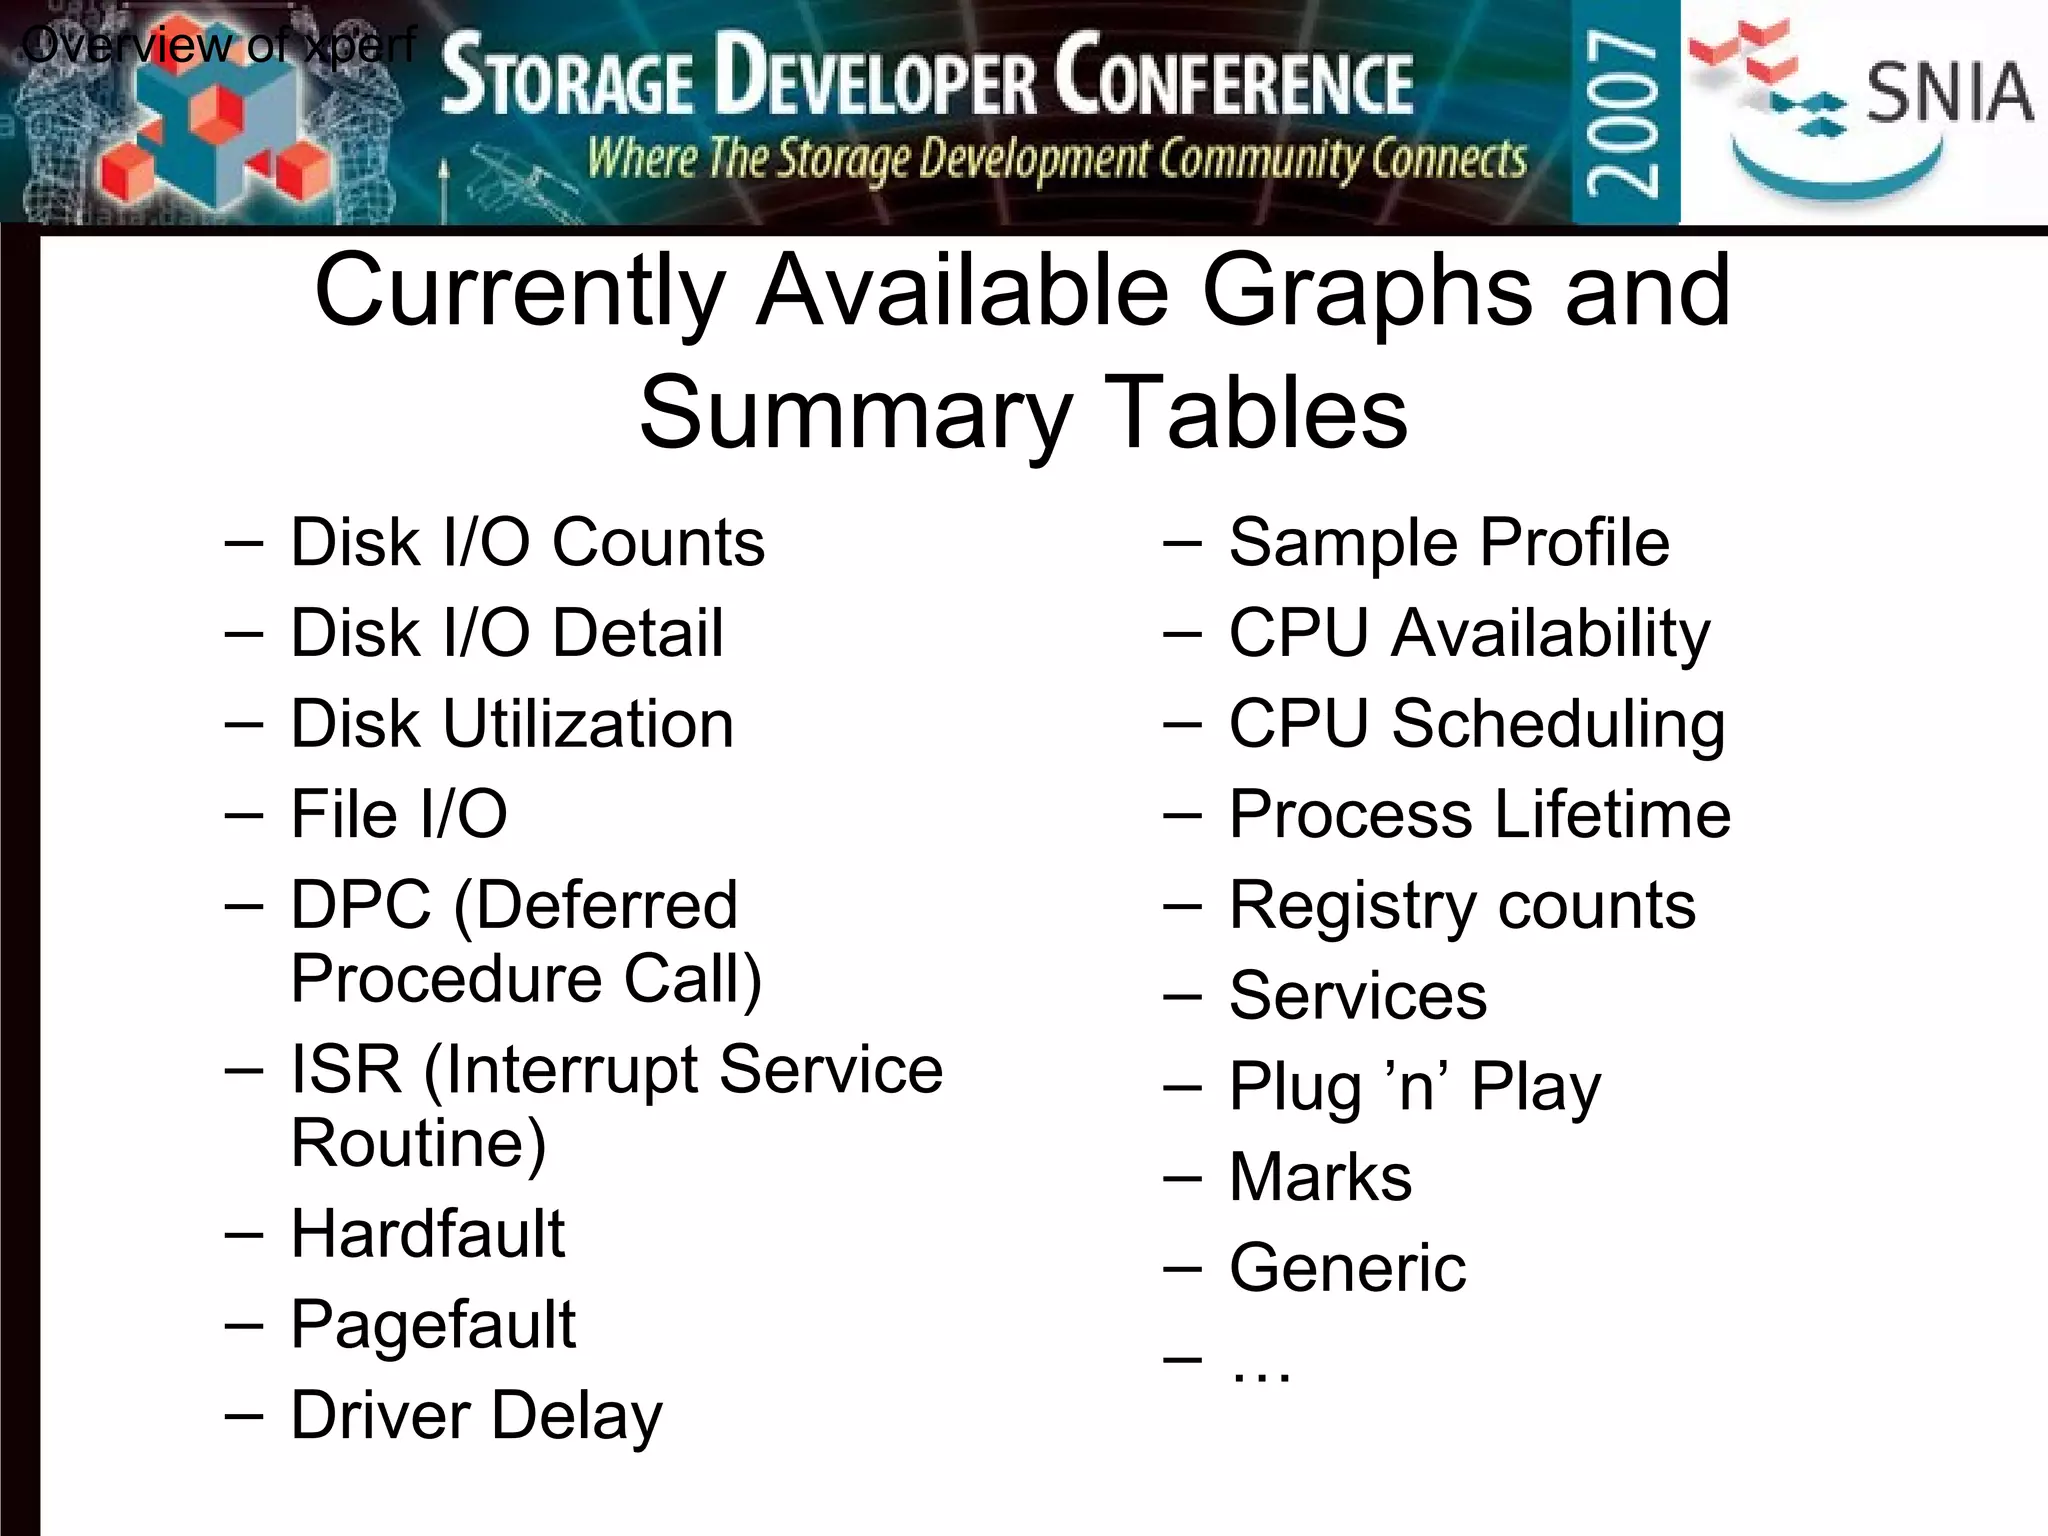
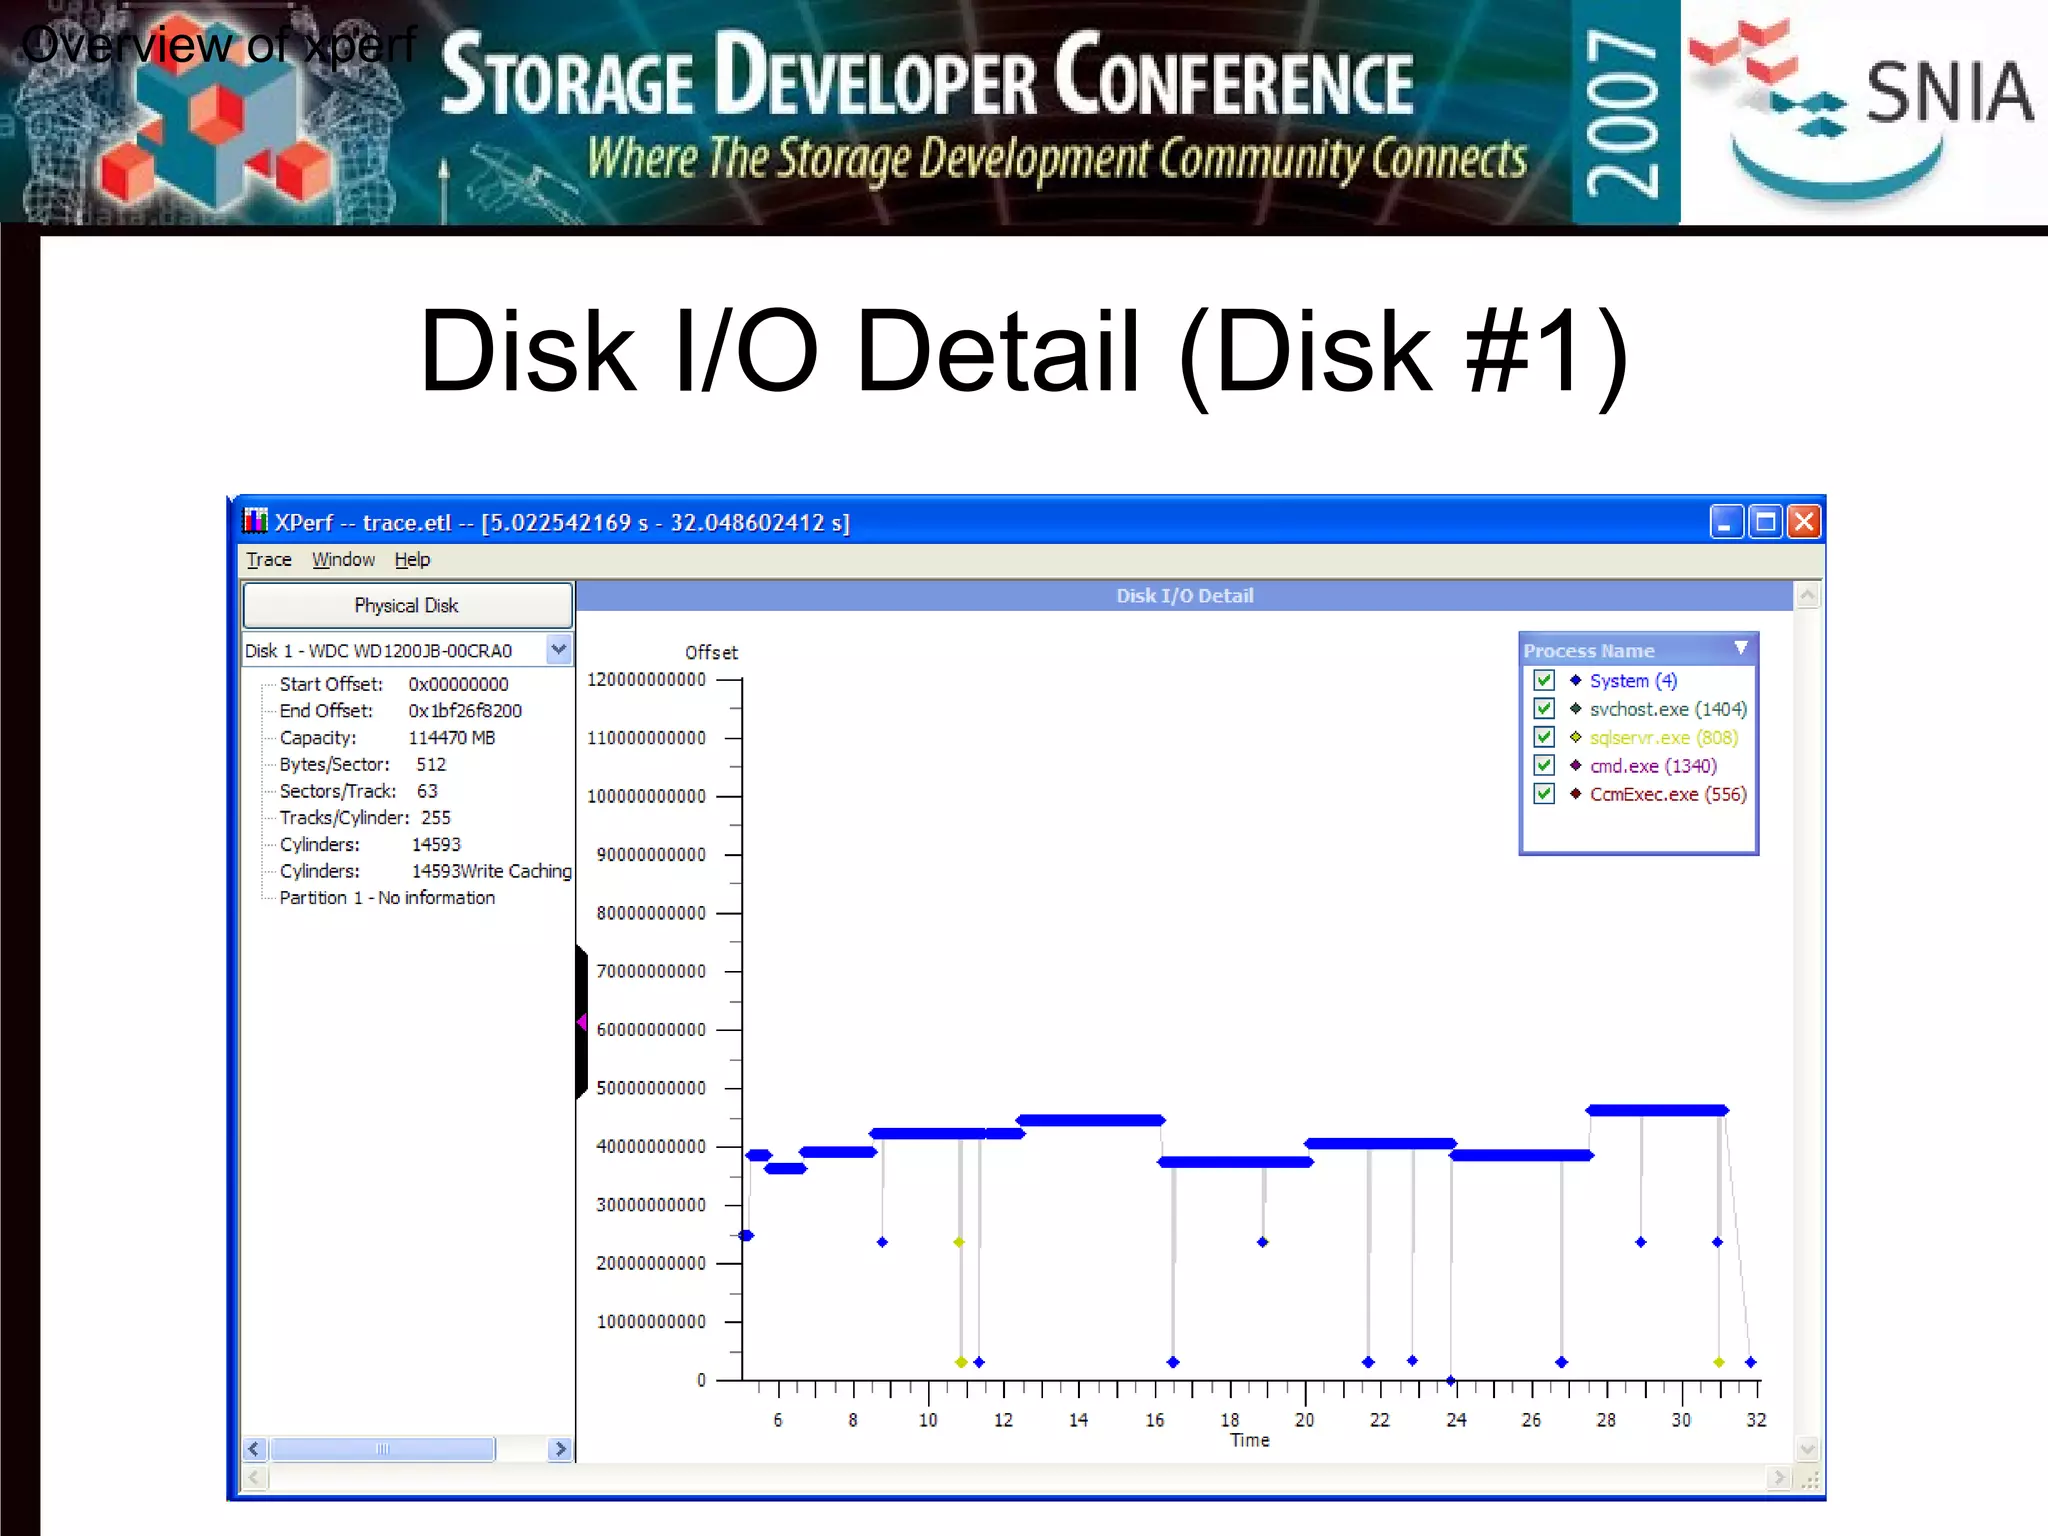
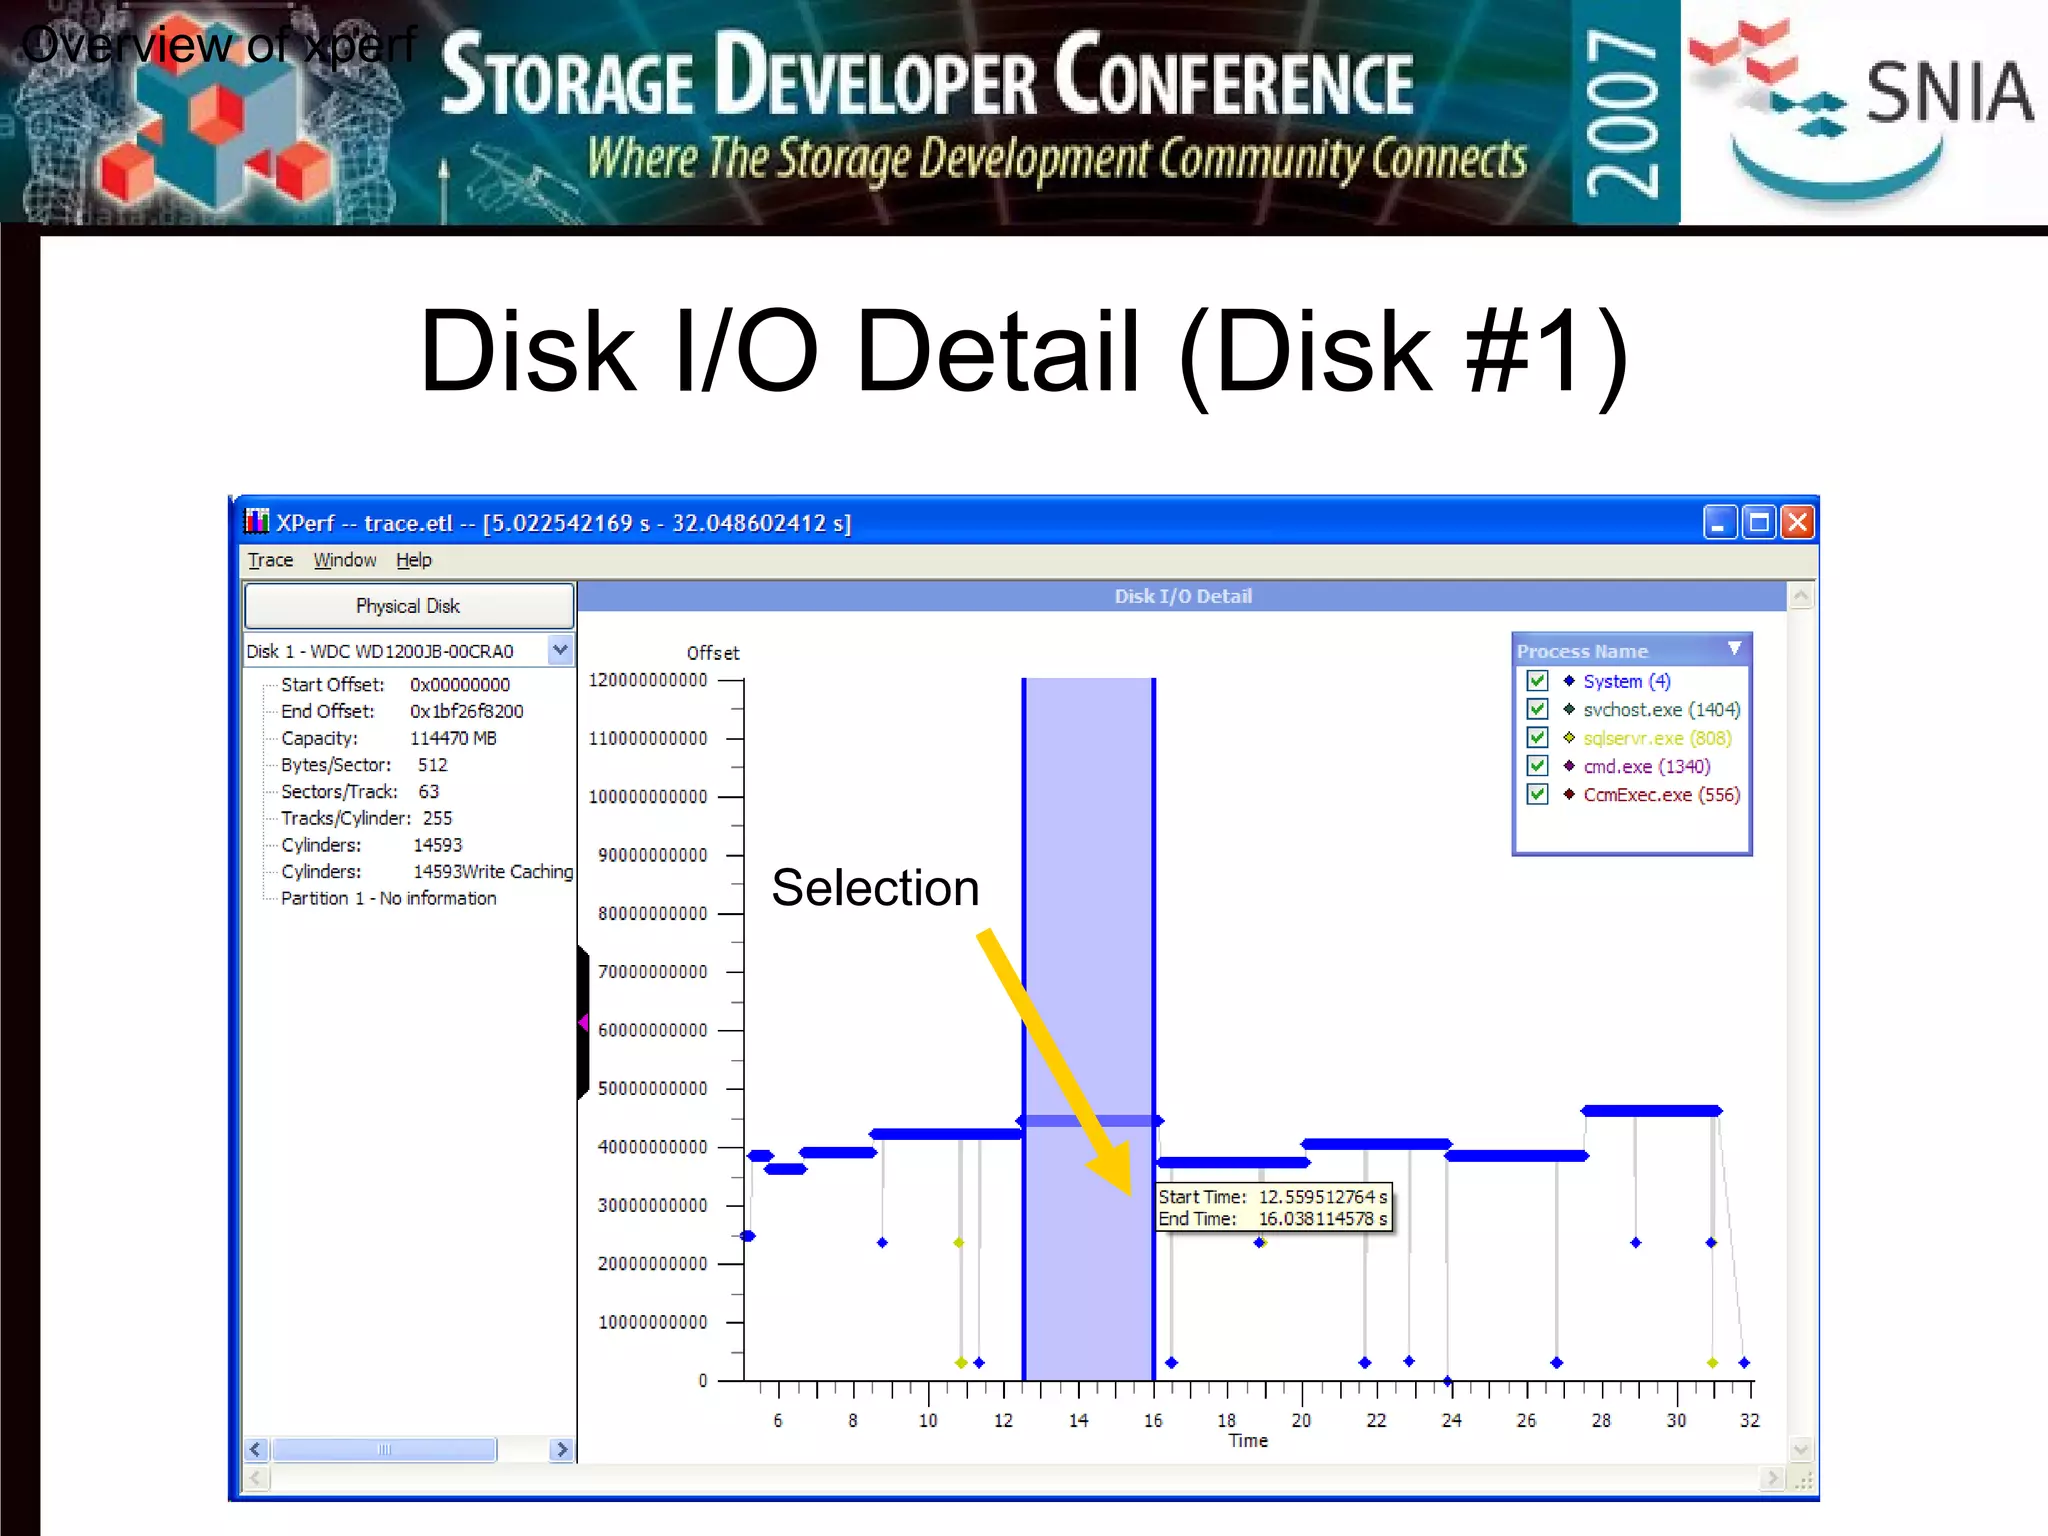
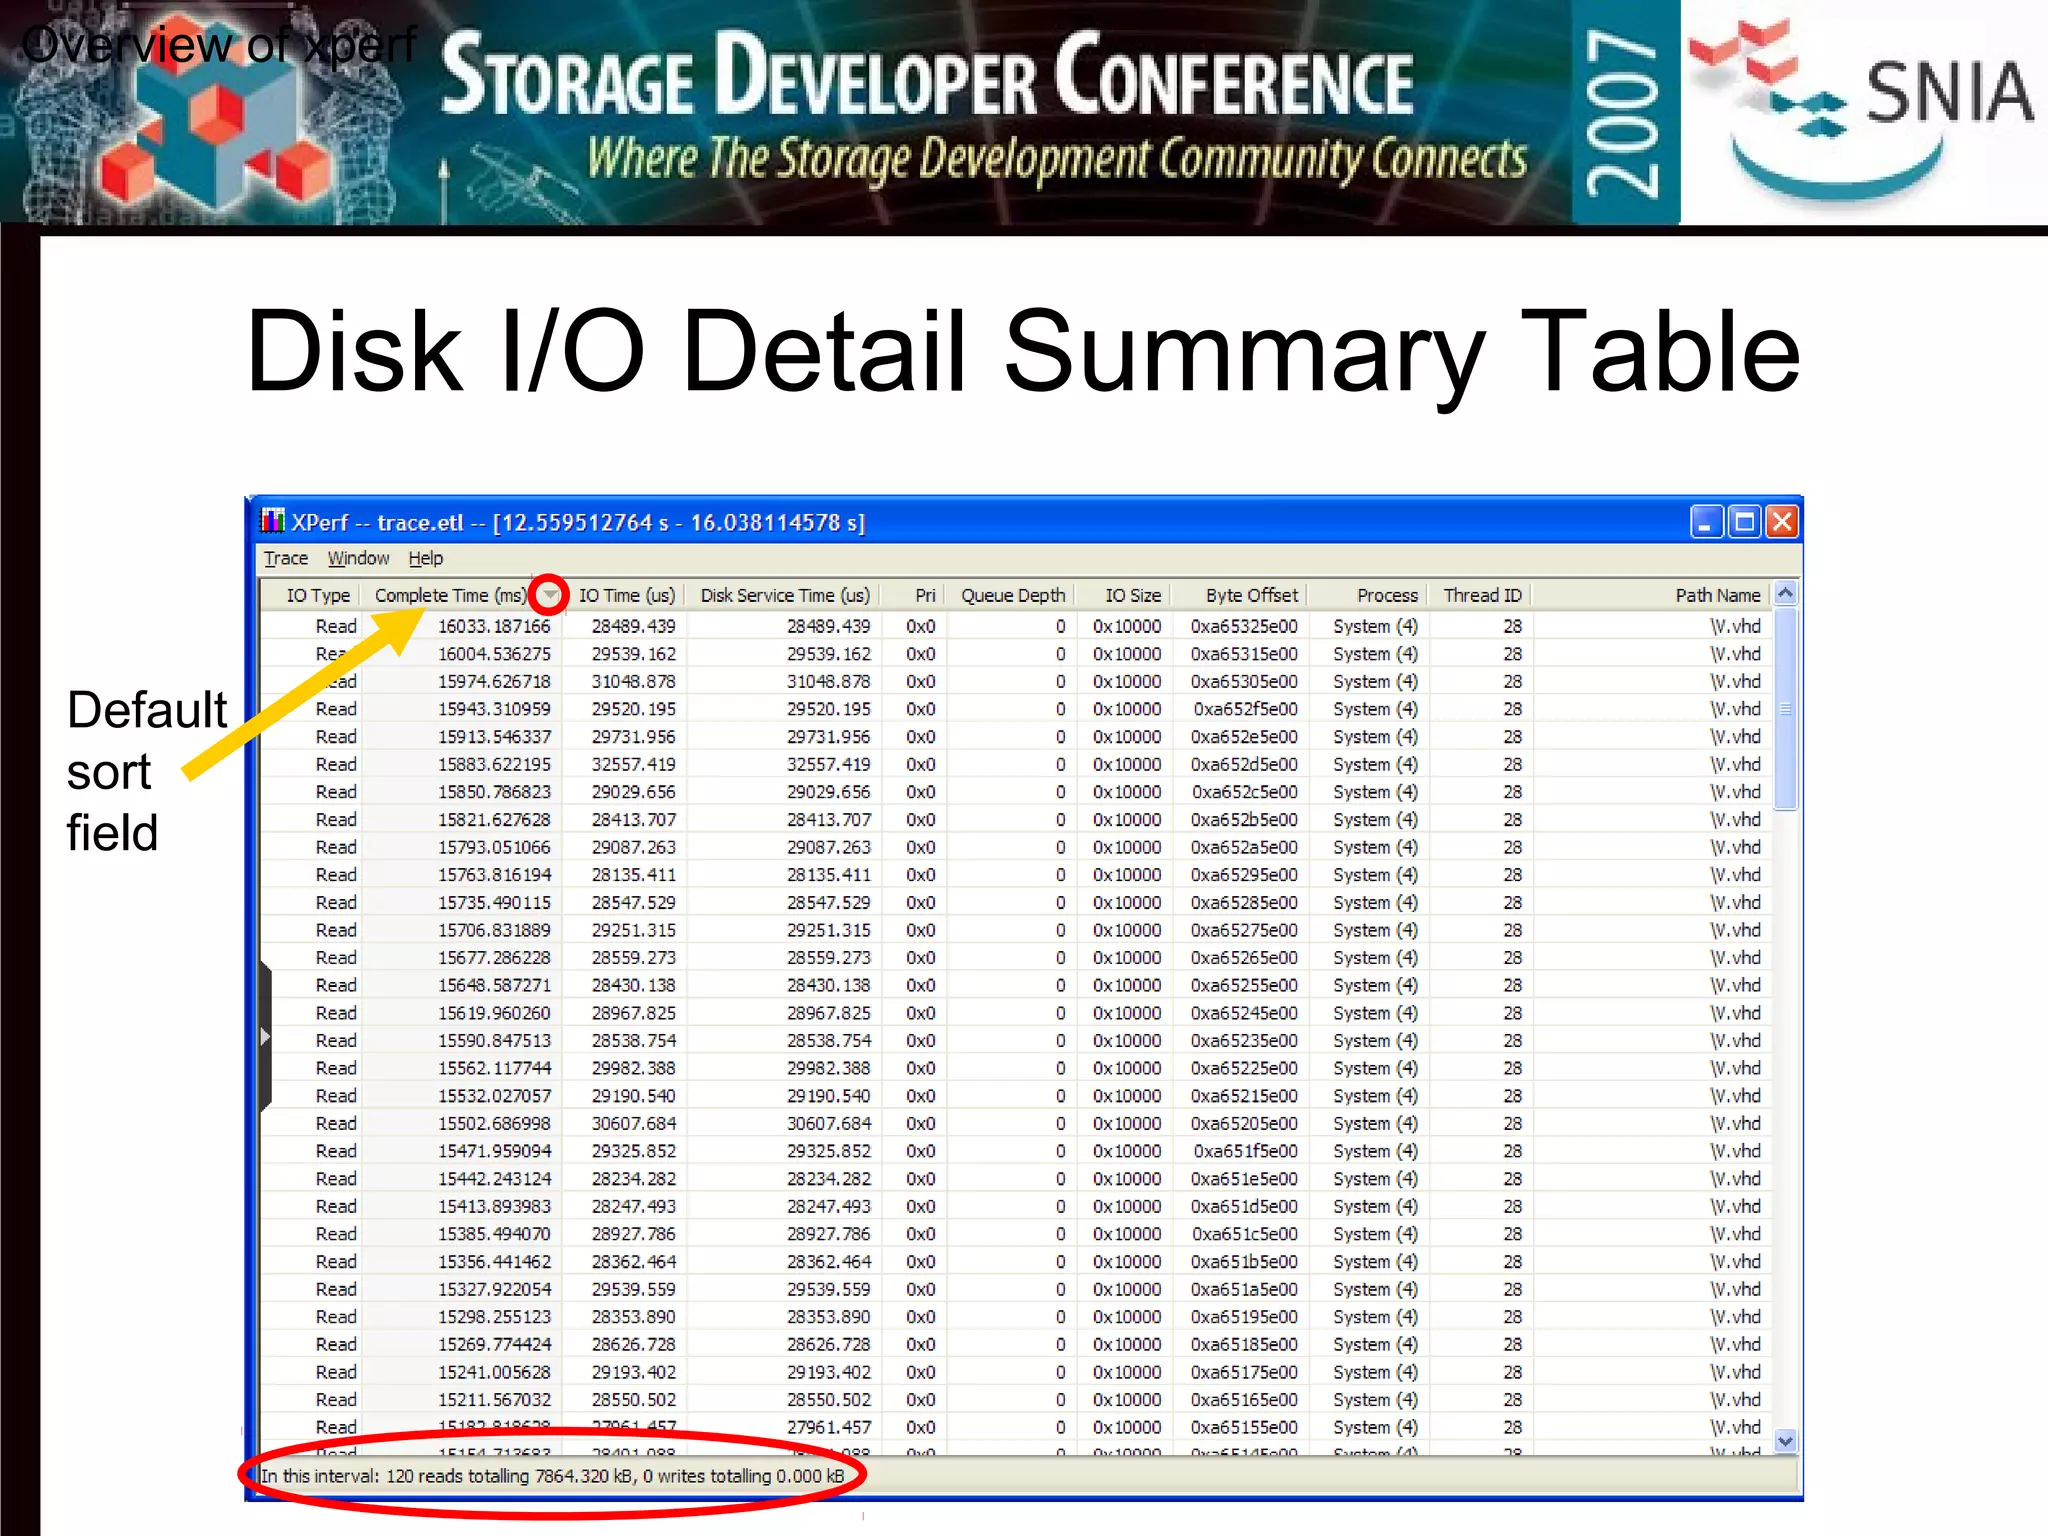
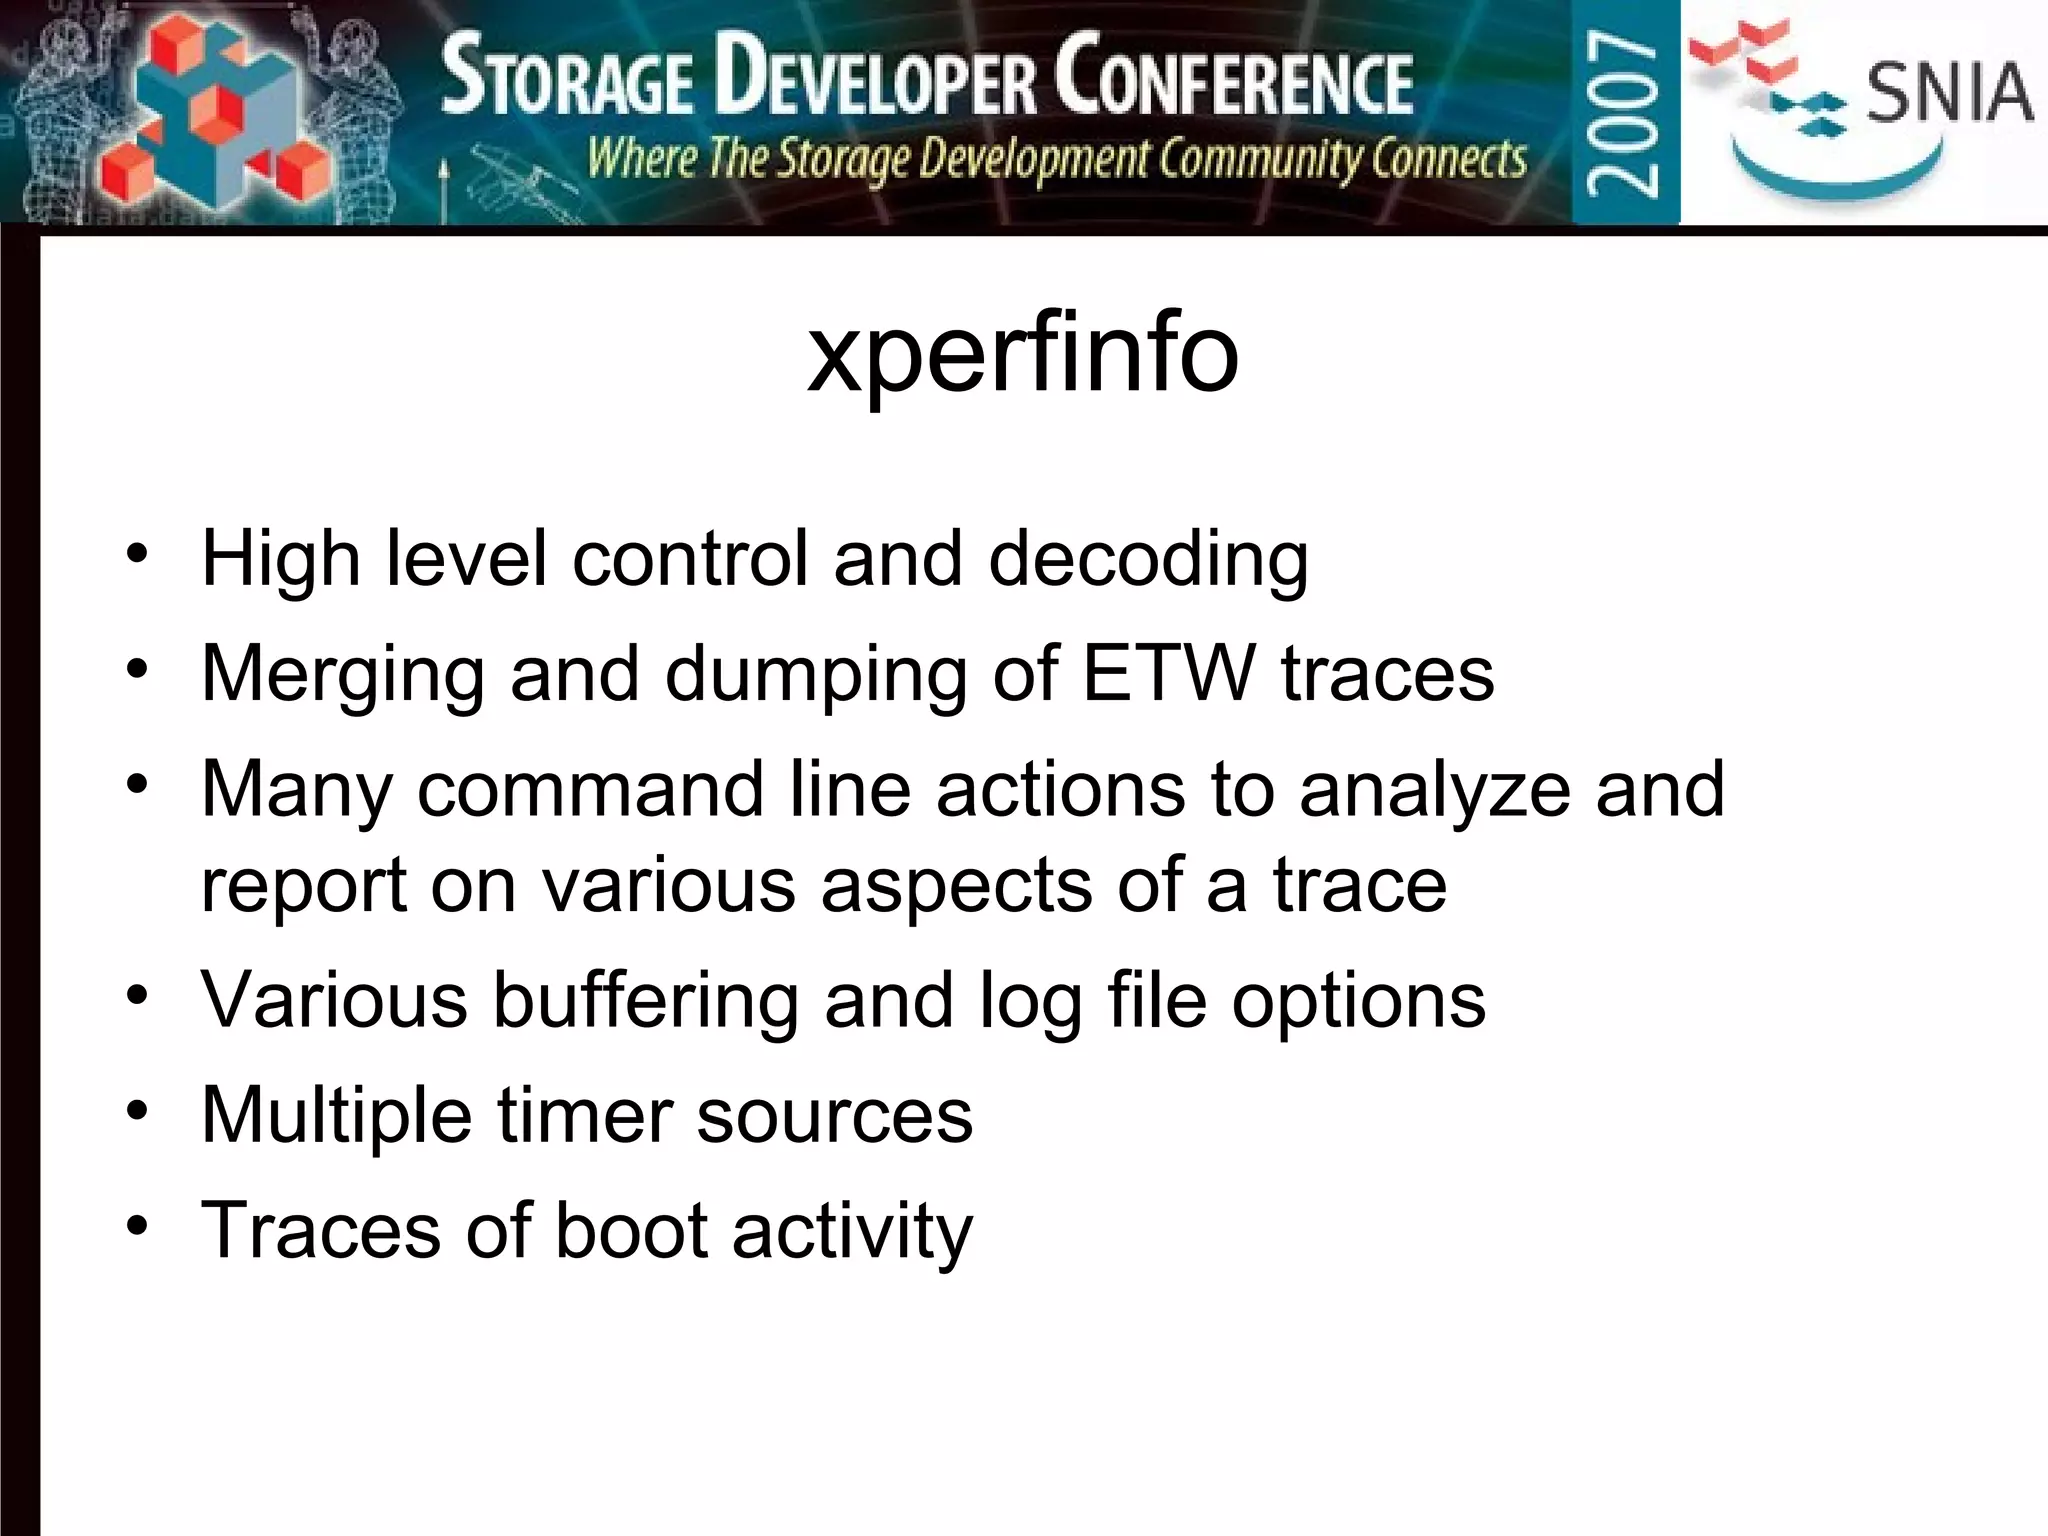
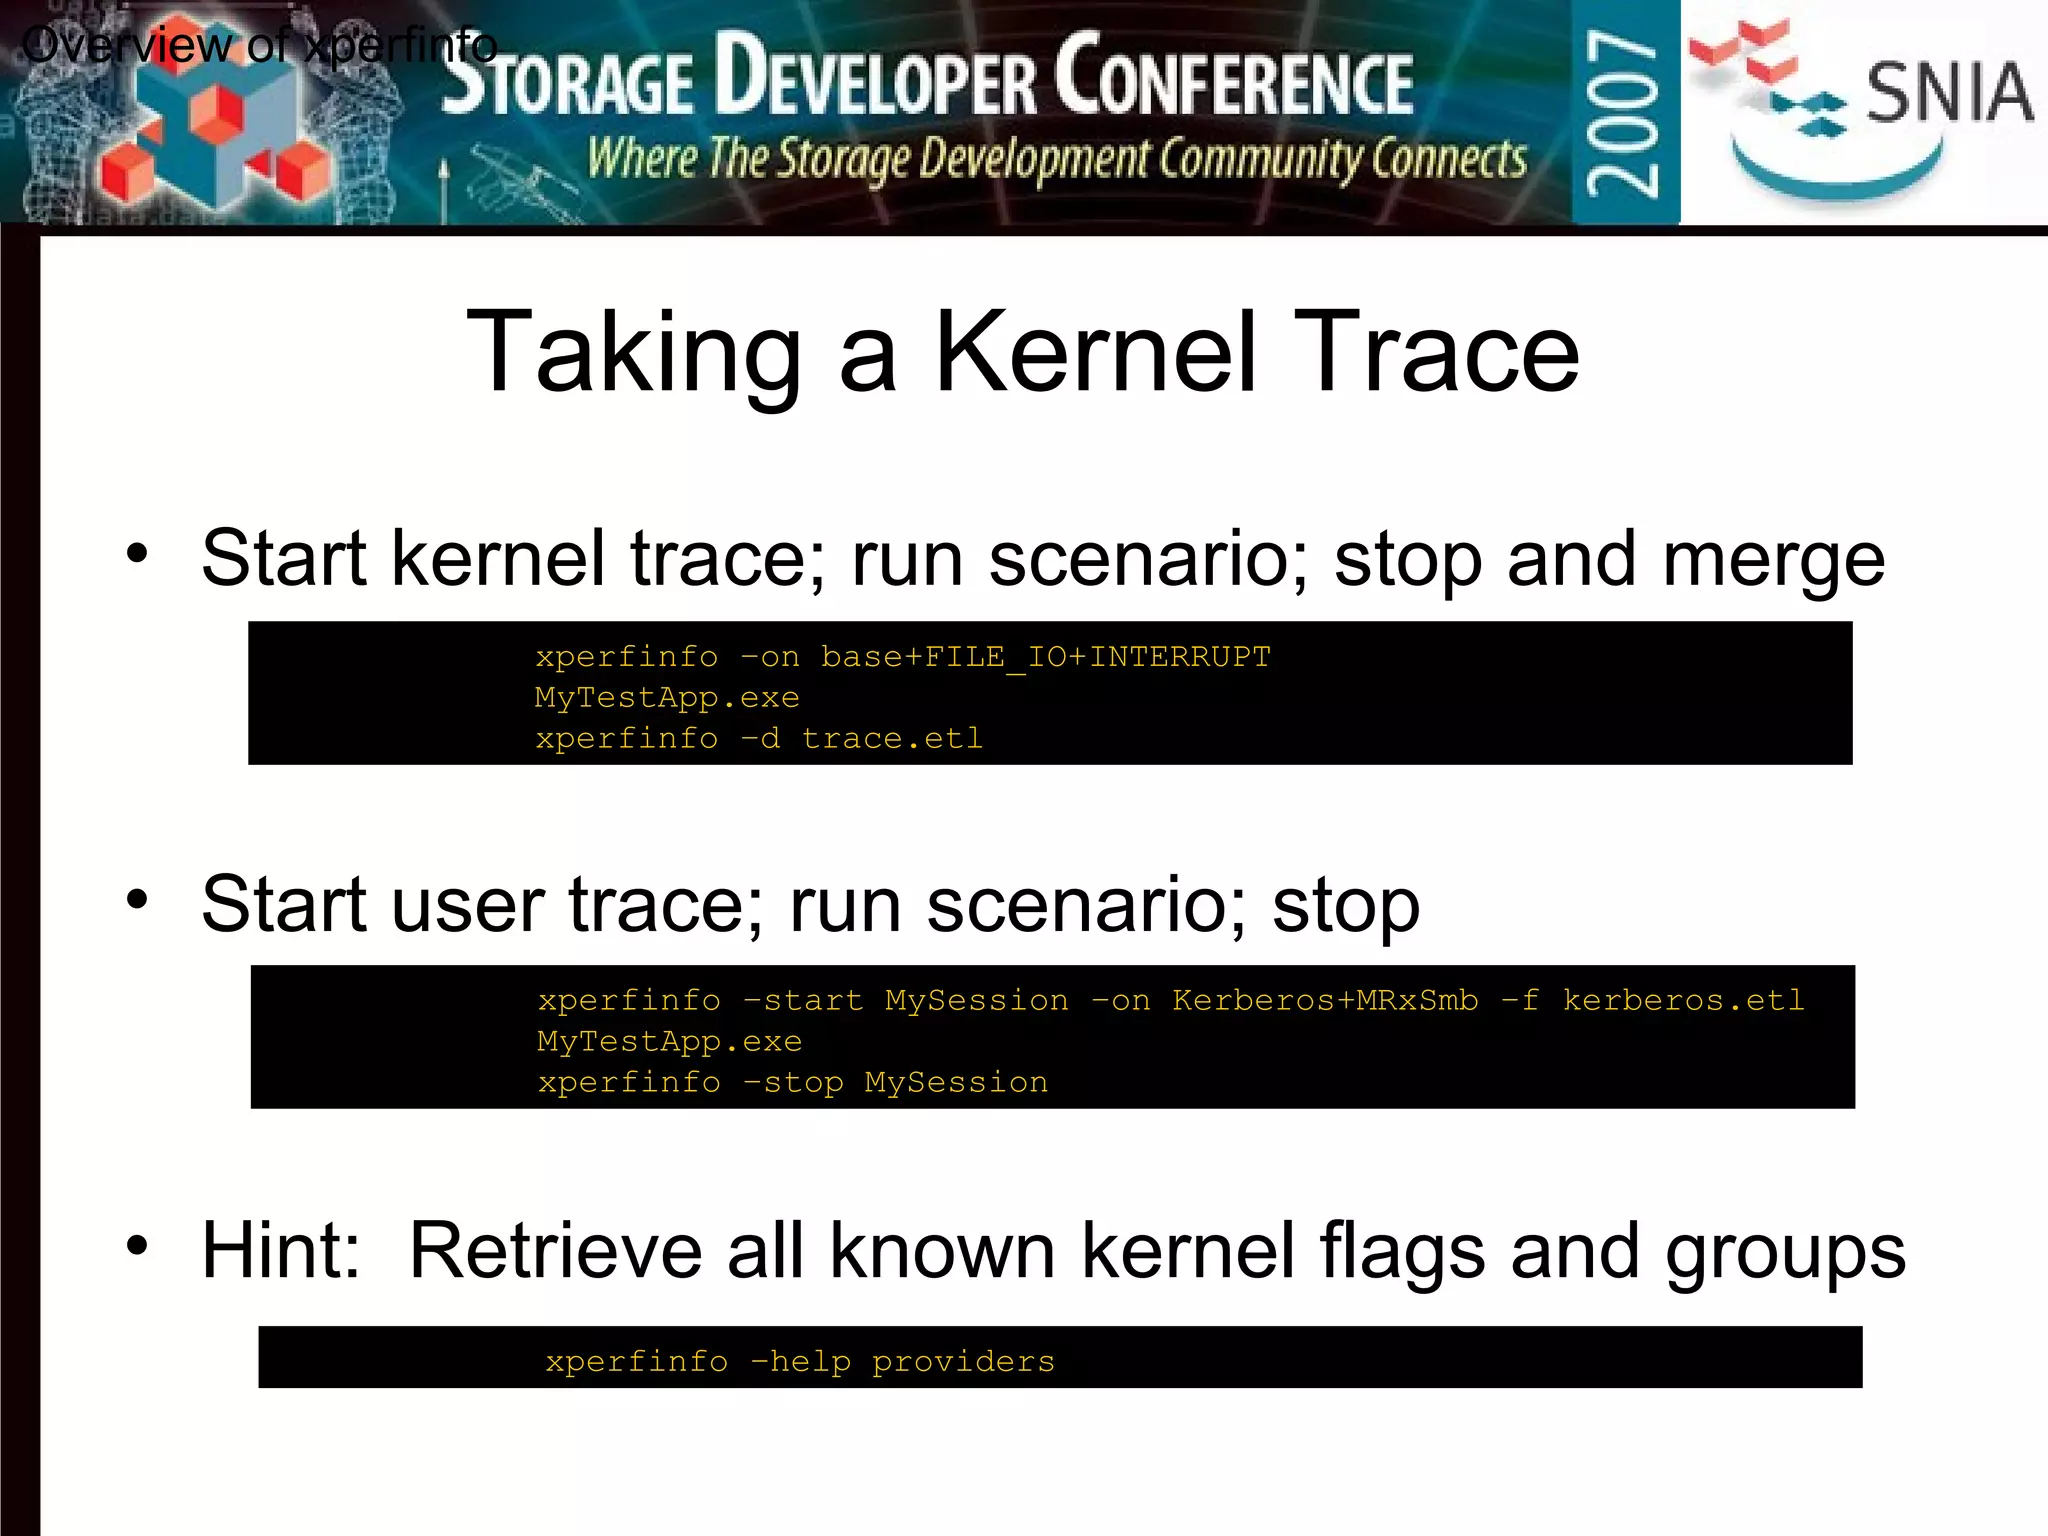
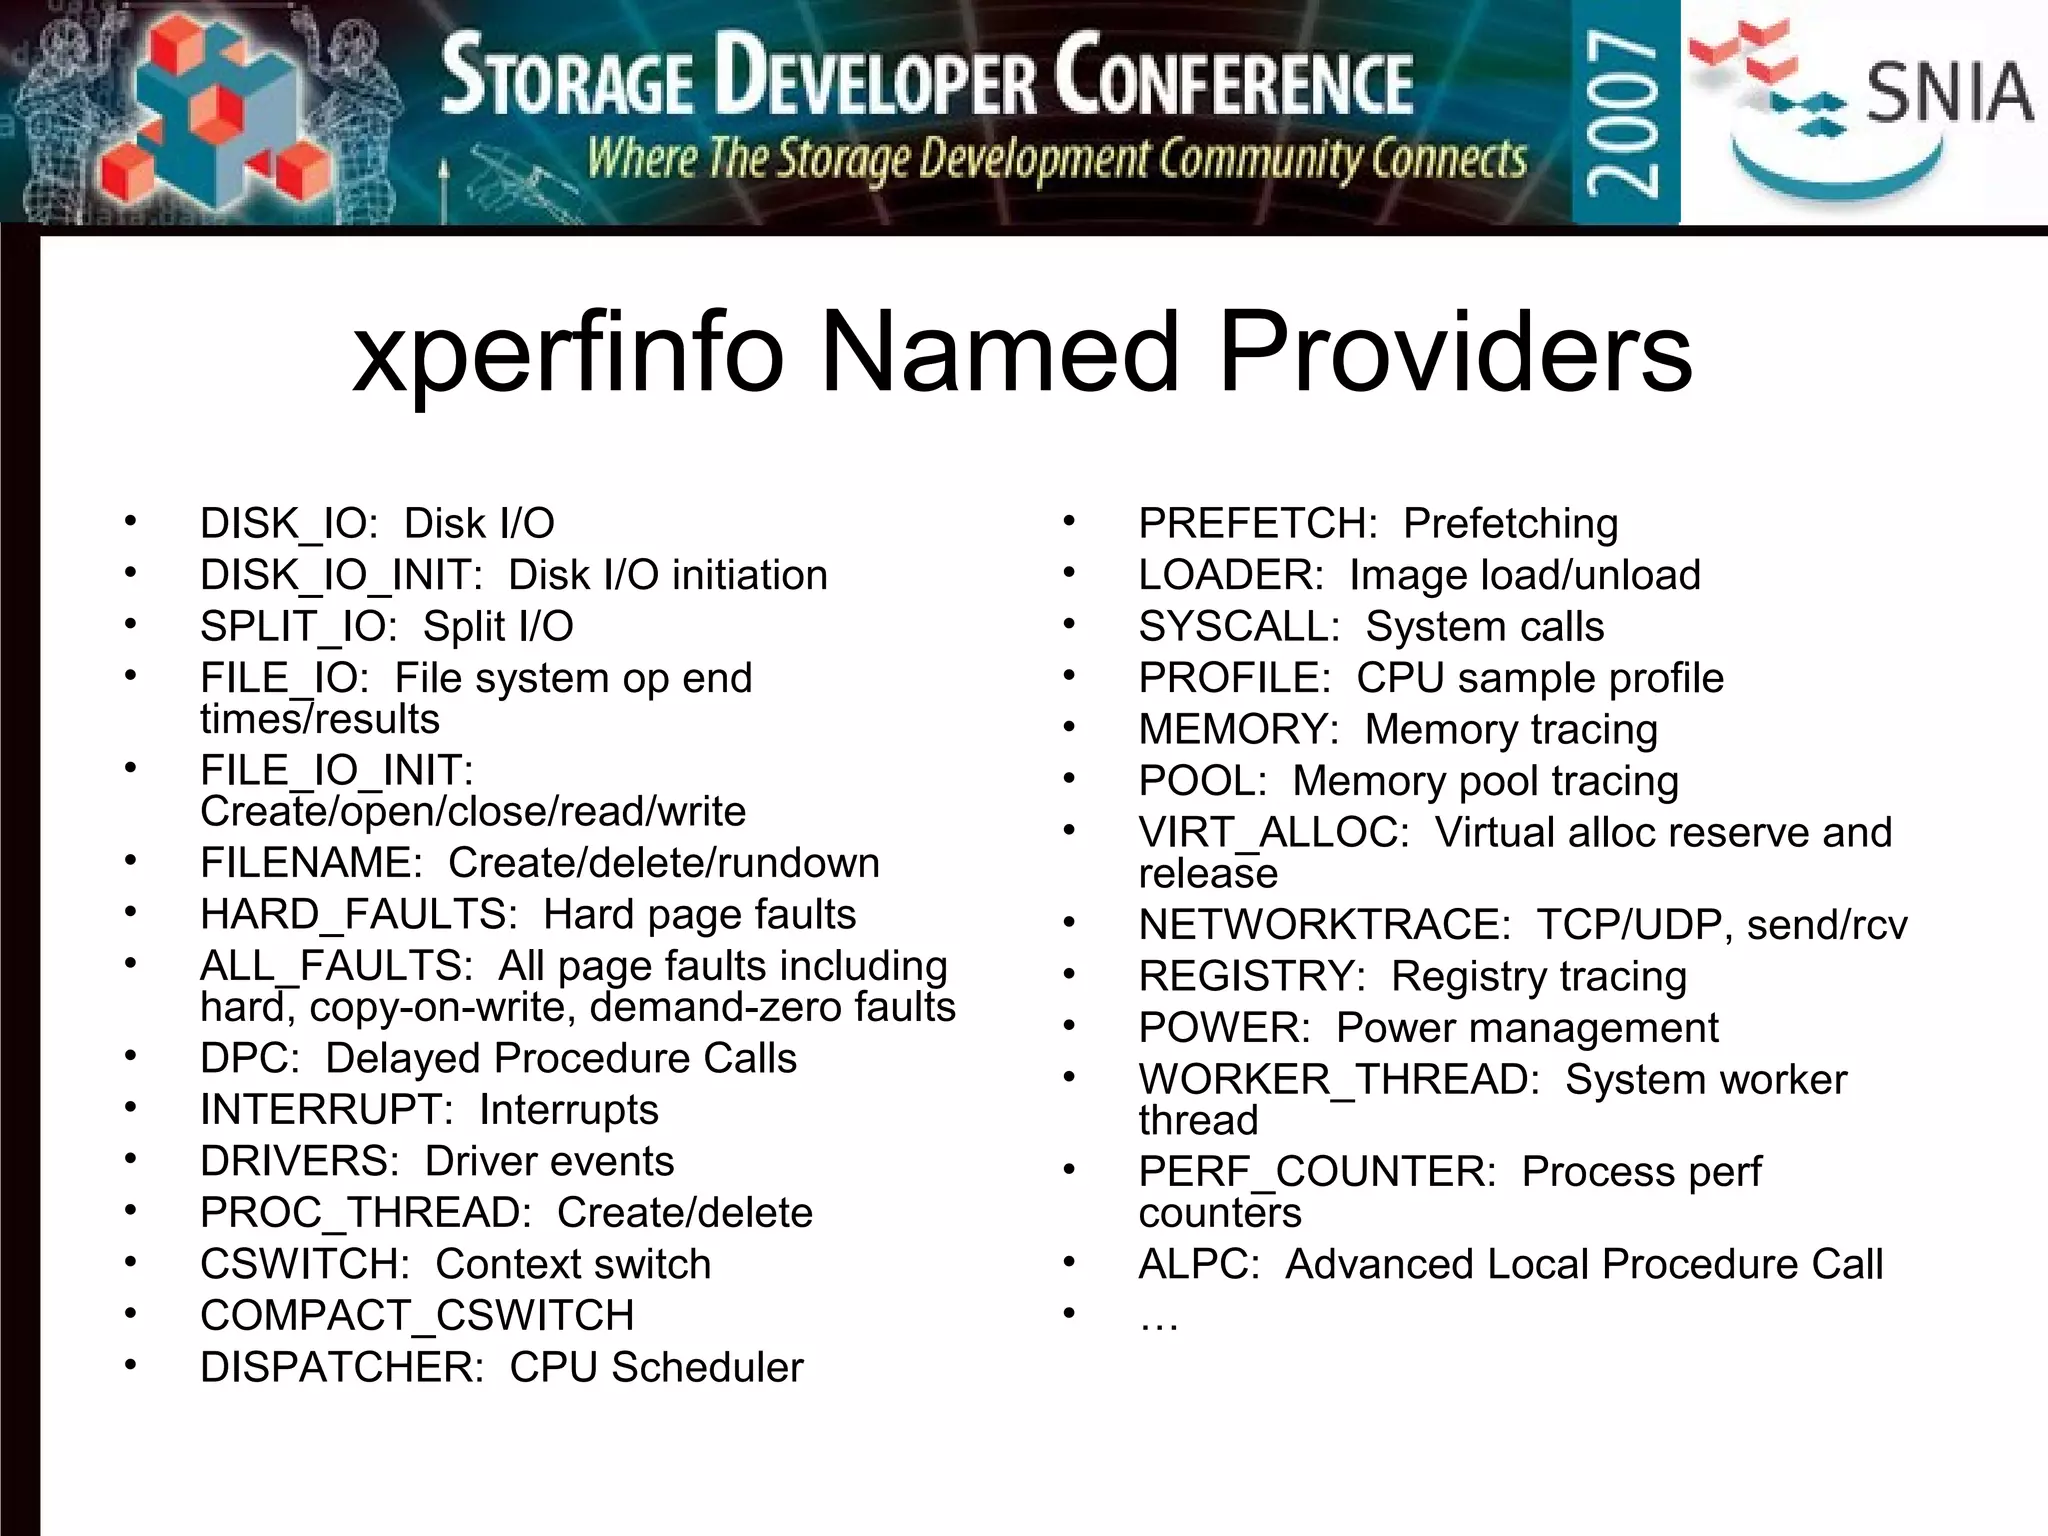
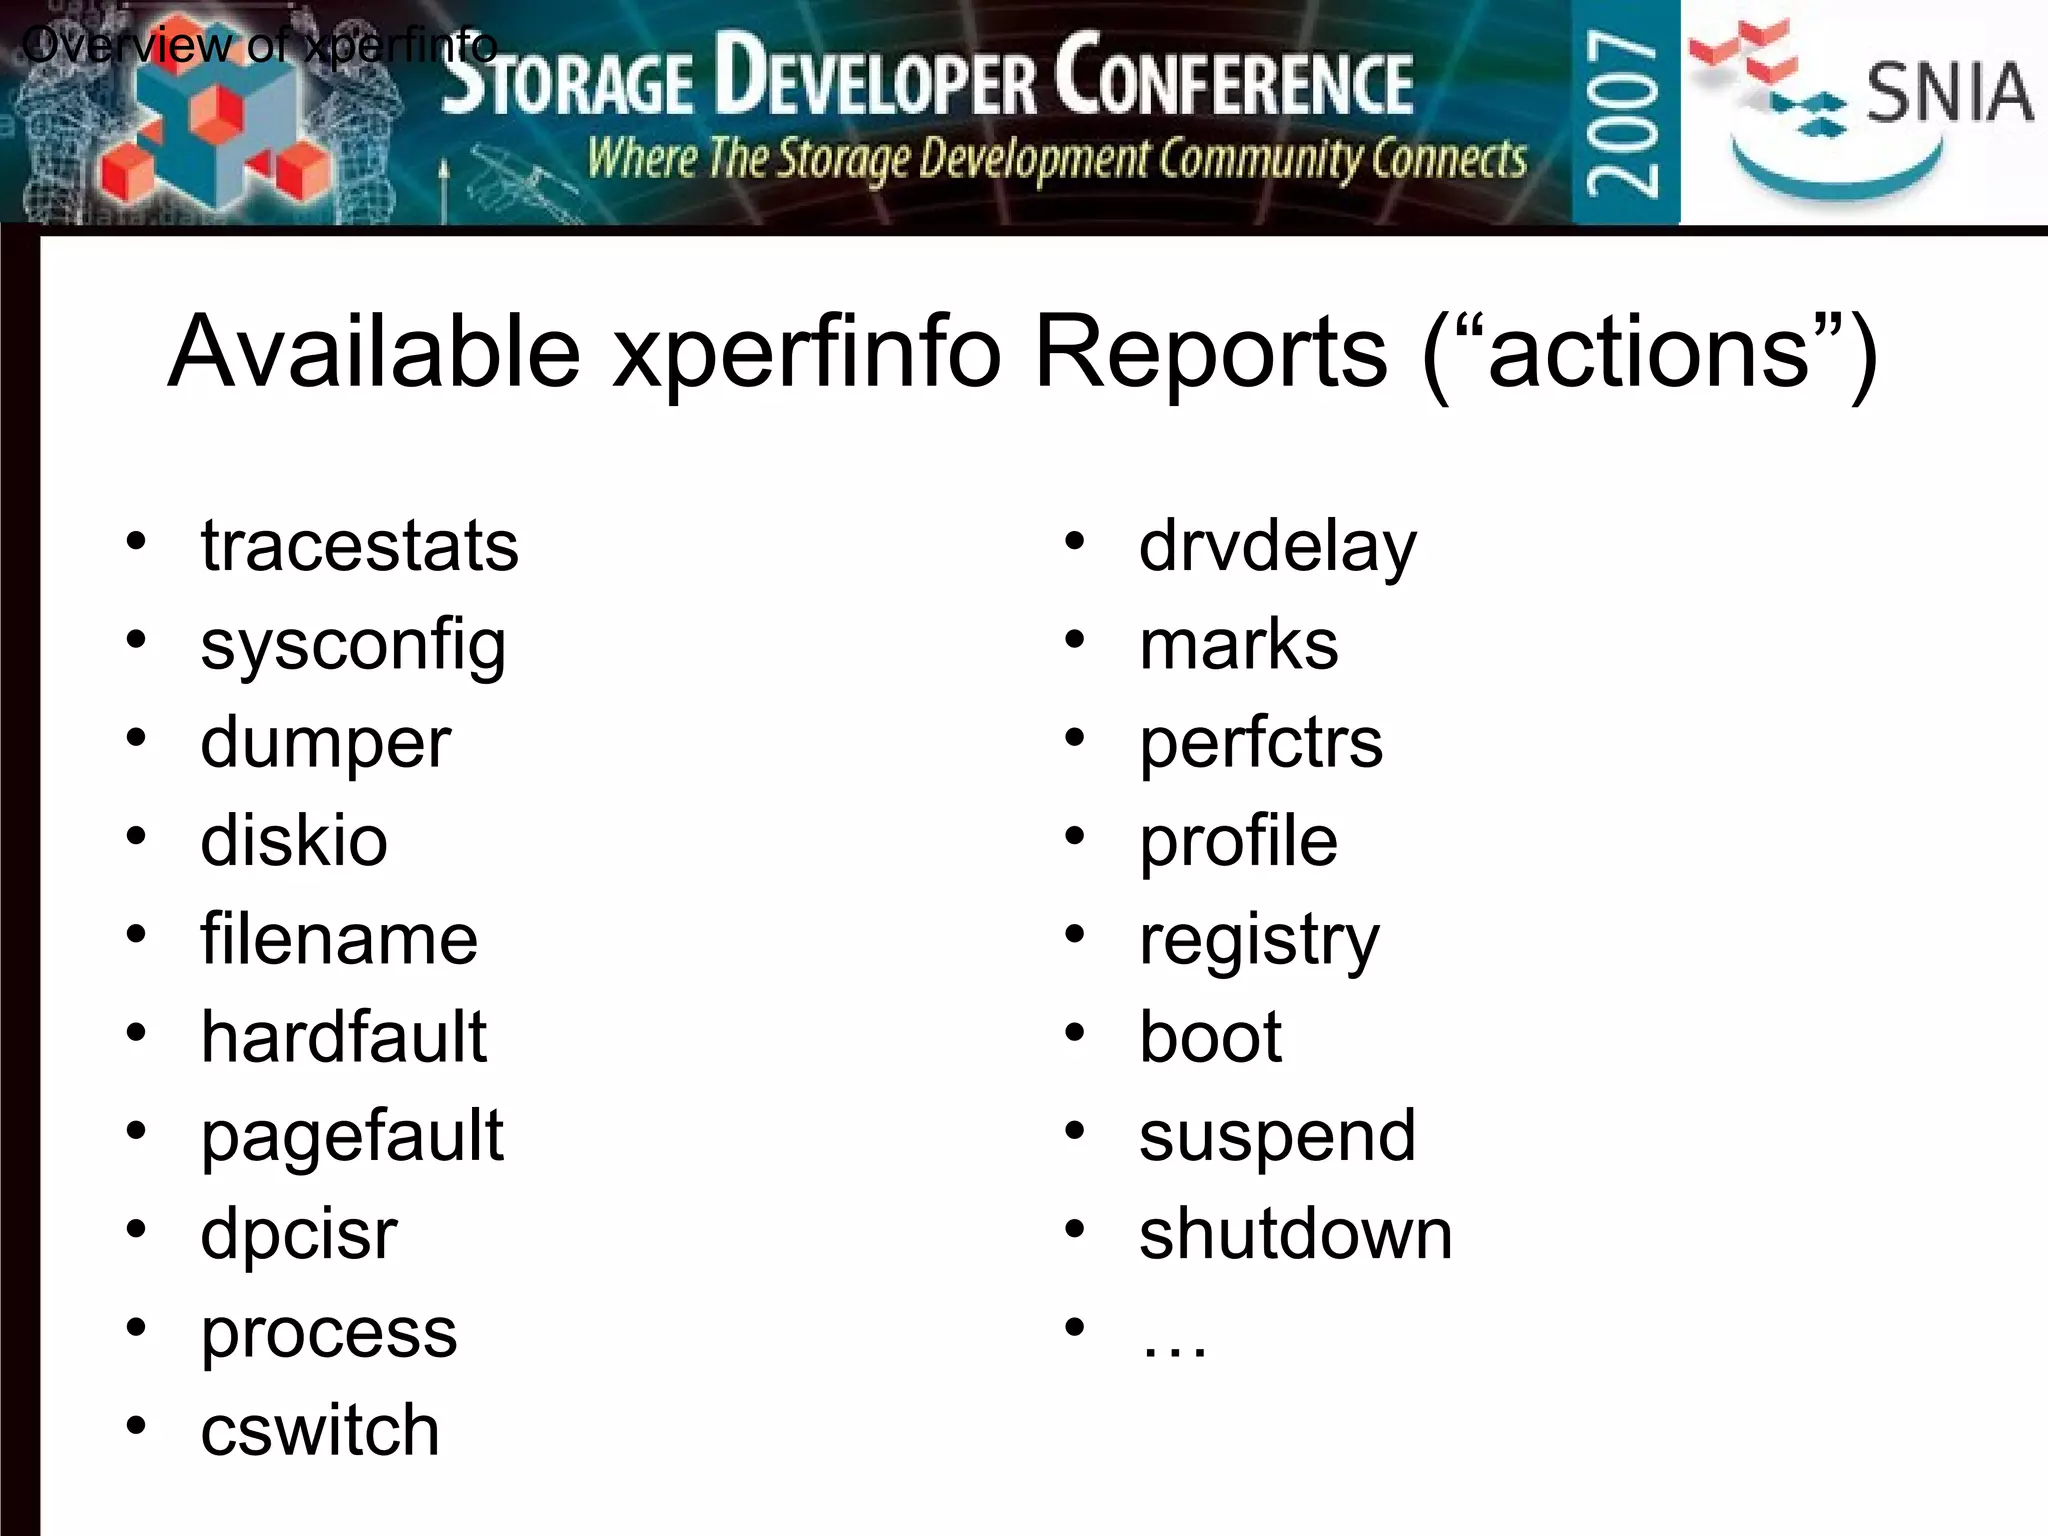
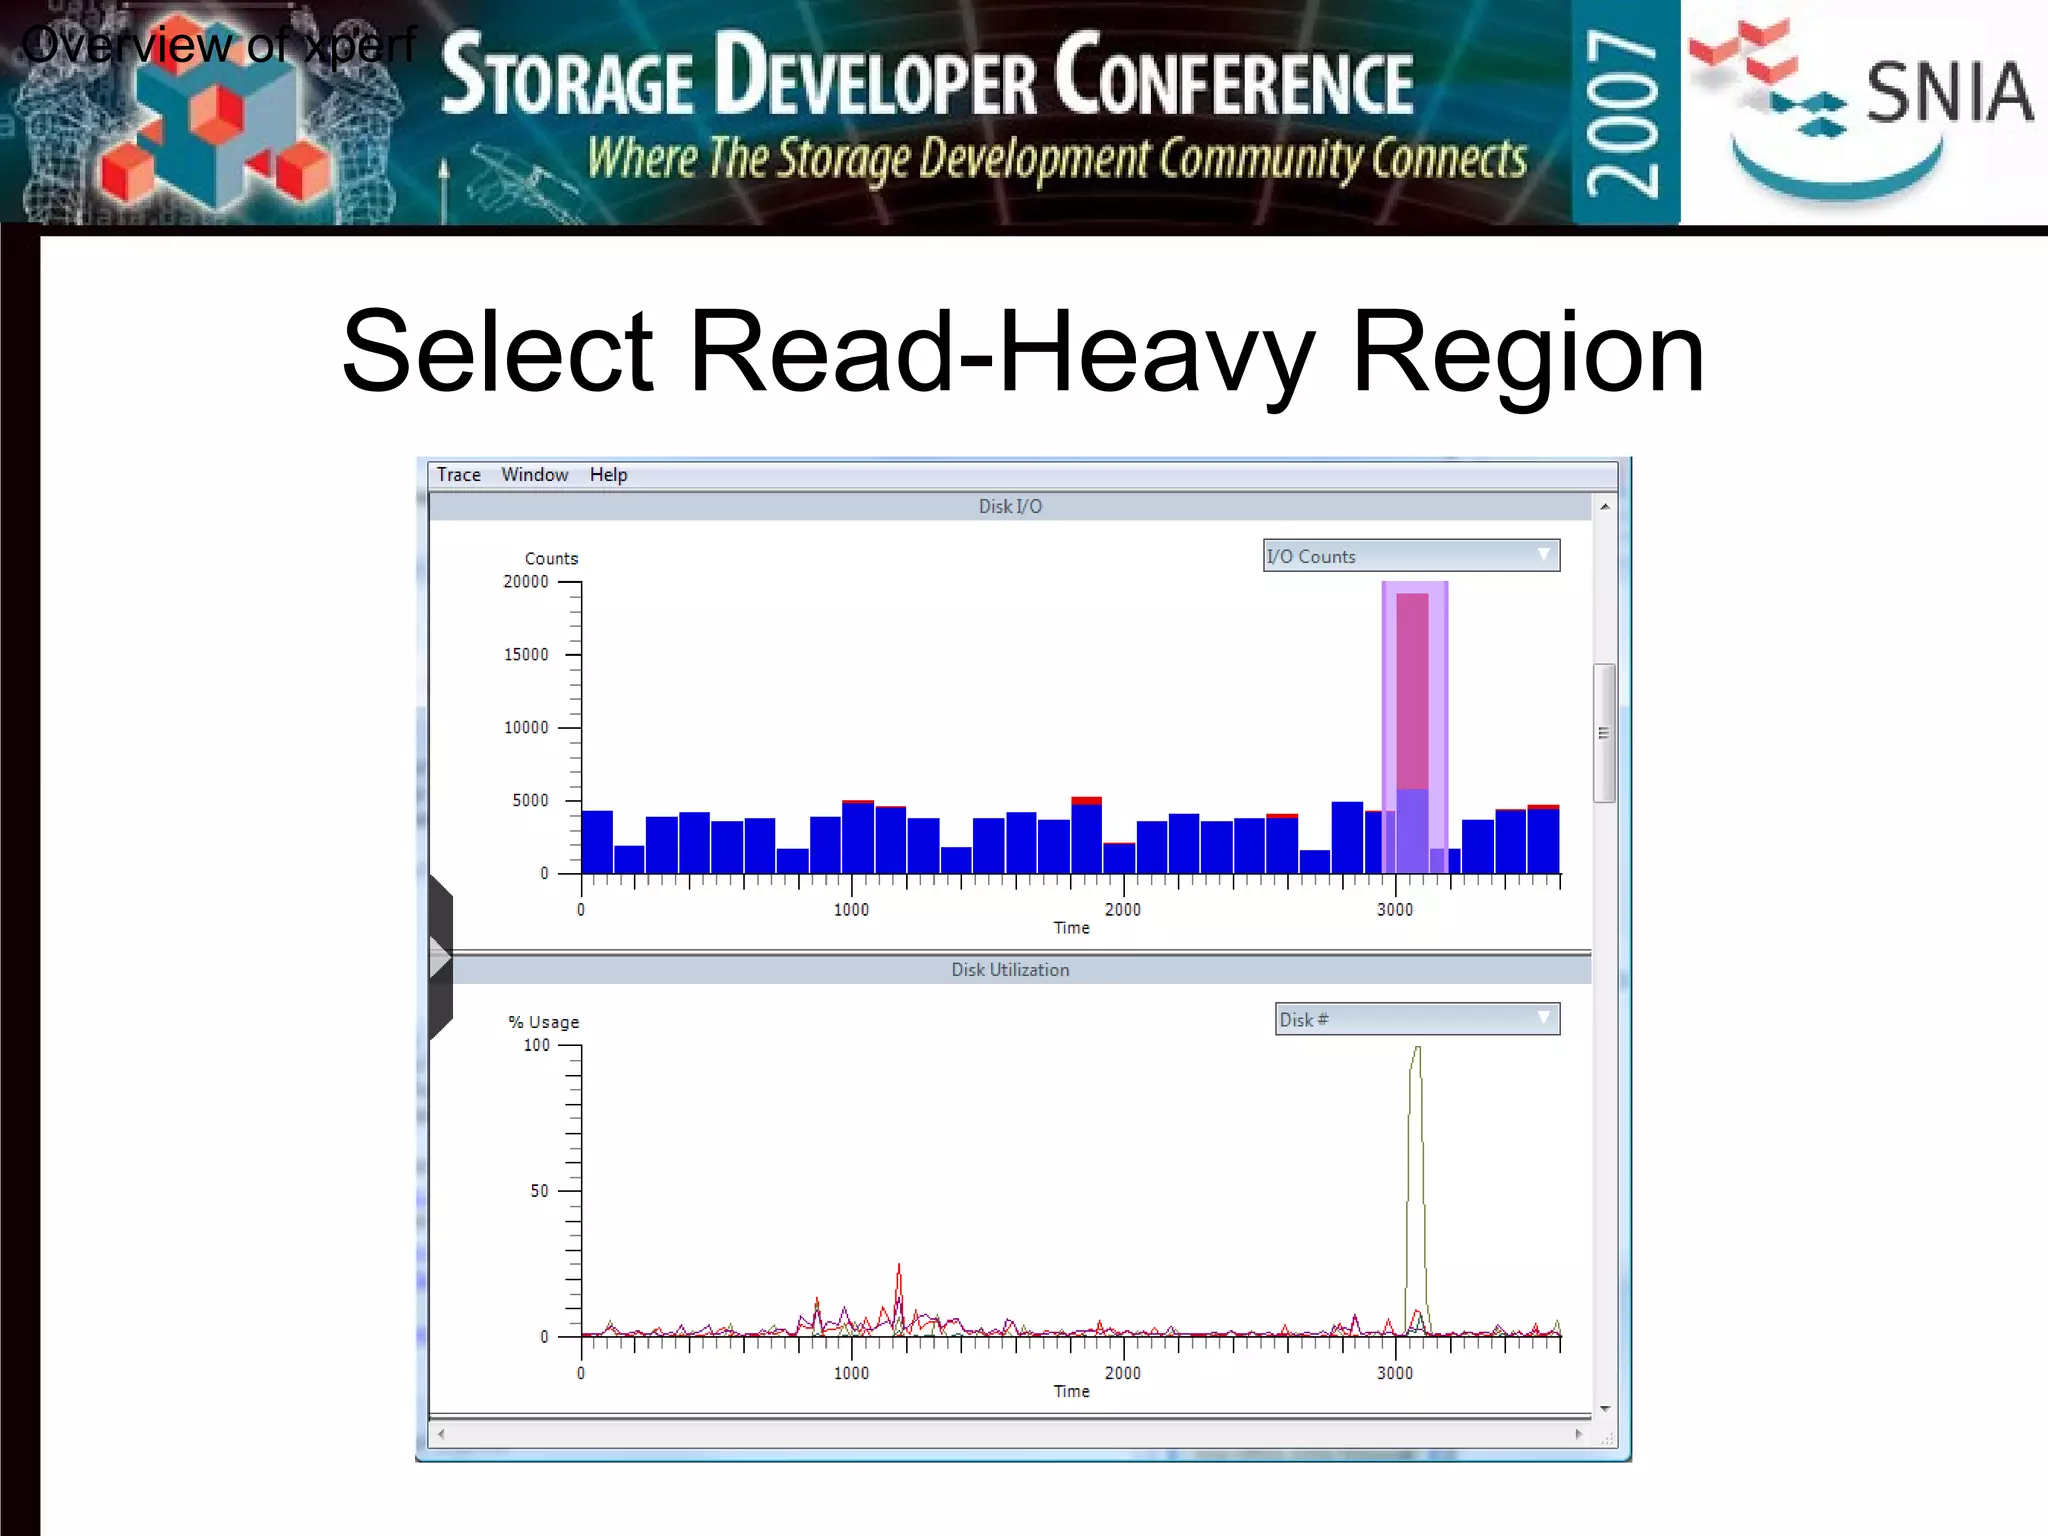
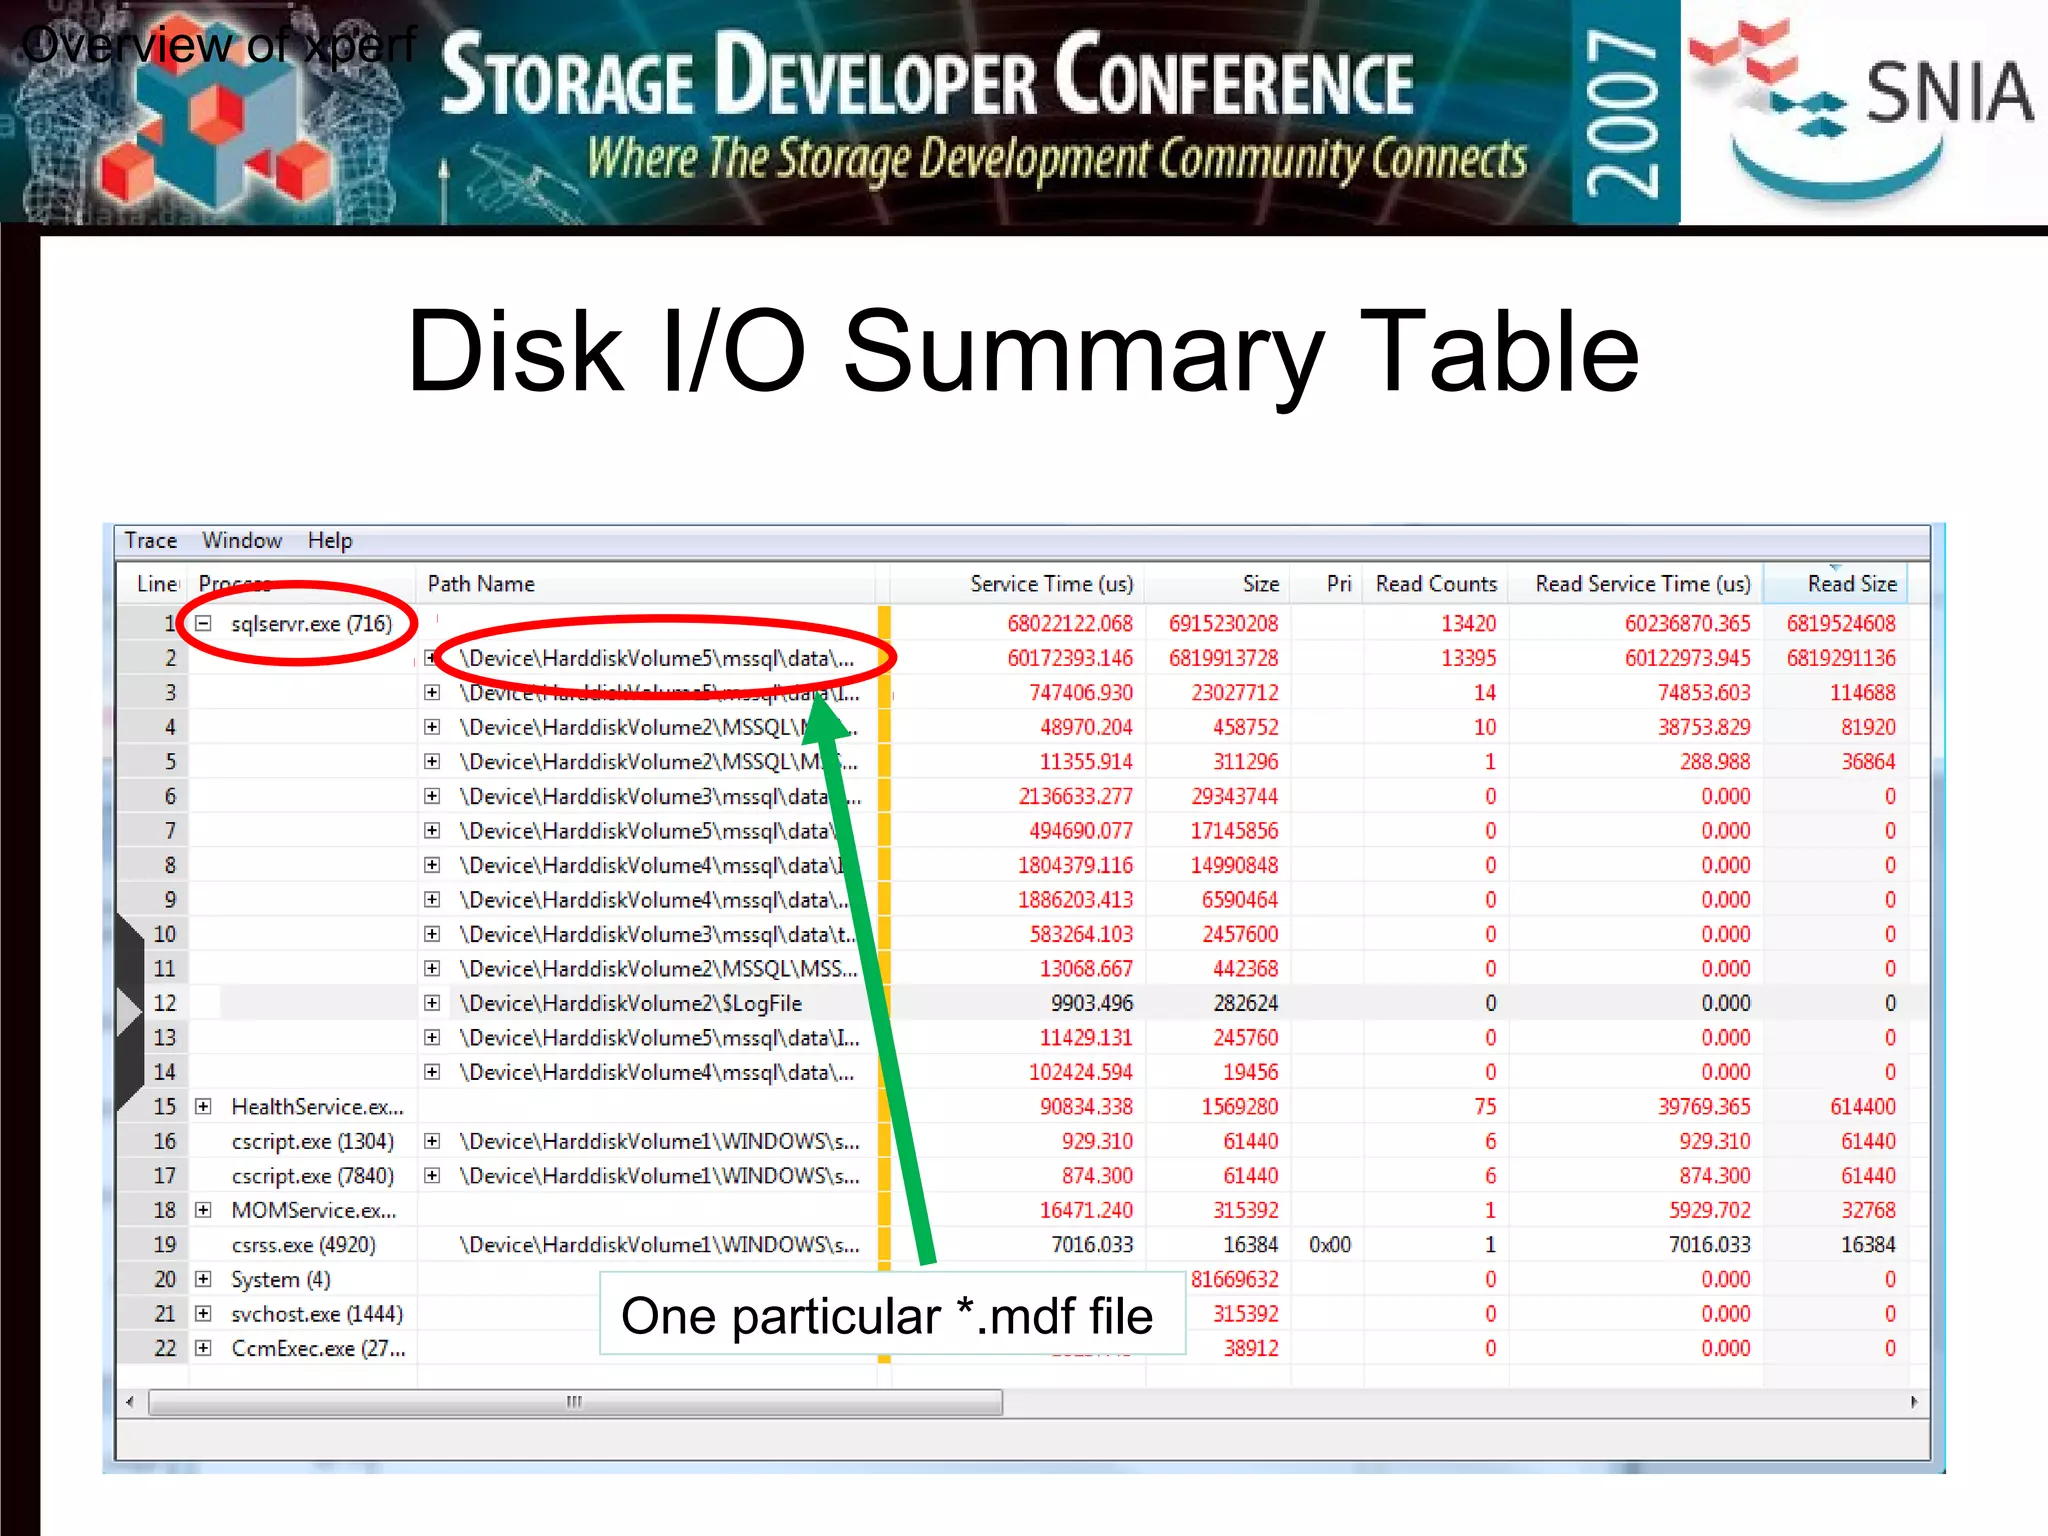
Overview of xperfinfo
C:analysis> xperfinfo -i trace.etl –o trace.txt
[1/2] 100.0%
[2/2] 100.0%
C:analysis> notepad trace.txt](https://image.slidesharecdn.com/capturingcomprehensivestorageworkloadtracesinwindows-150919172405-lva1-app6891/75/Capturing-comprehensive-storage-workload-traces-in-windows-31-2048.jpg)
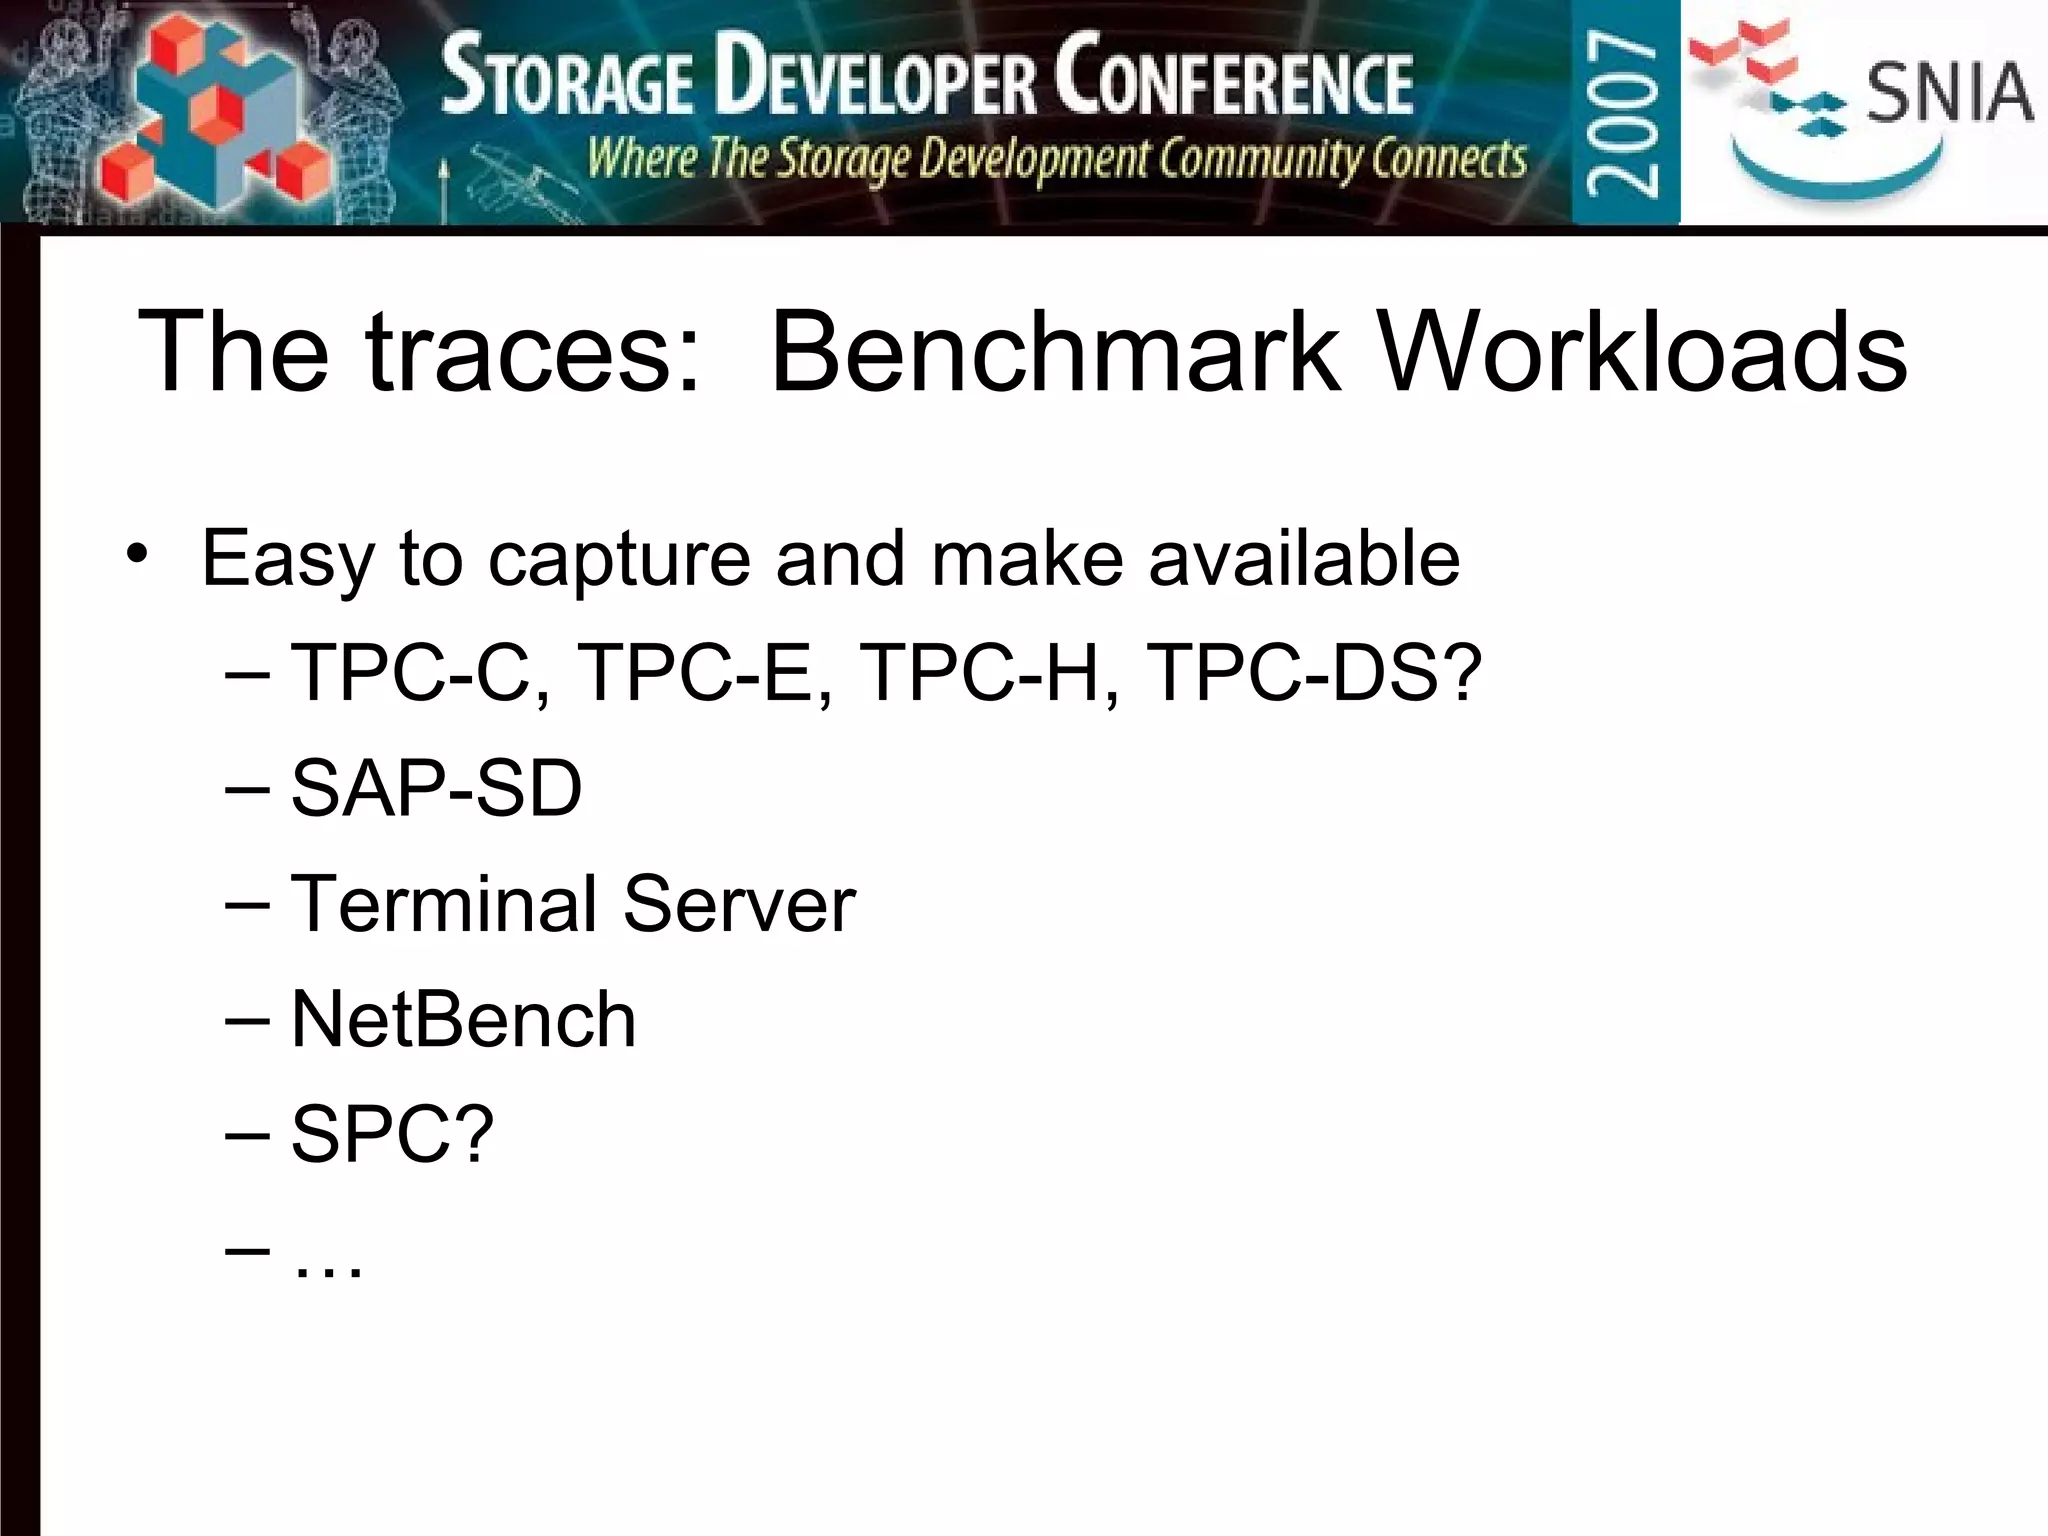
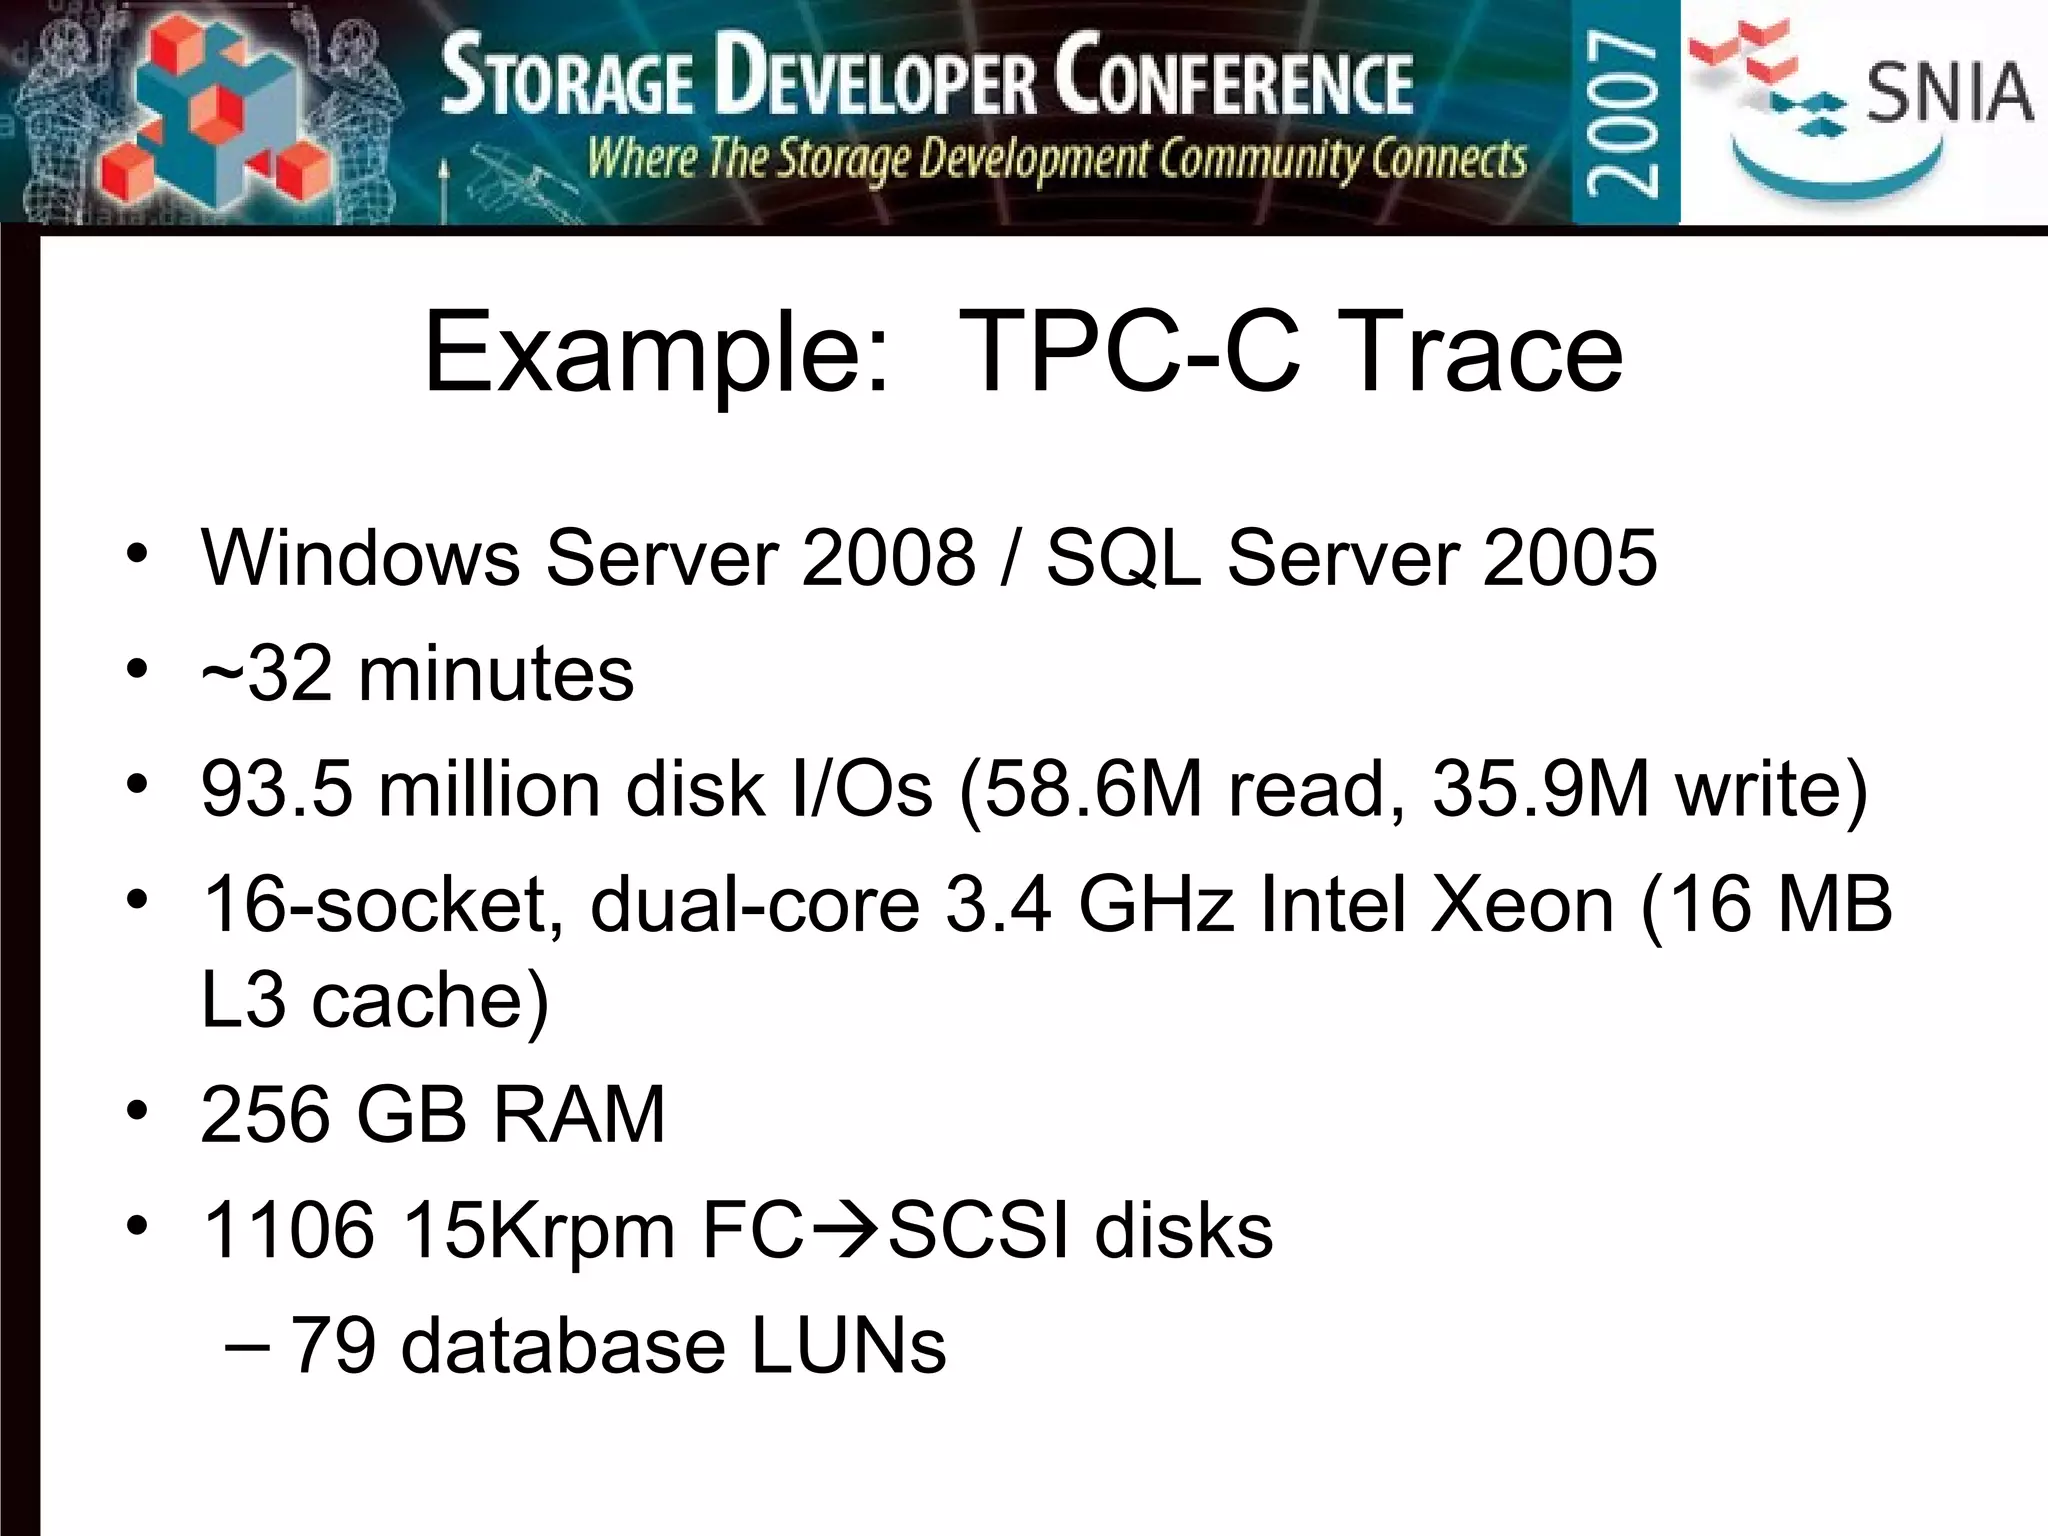
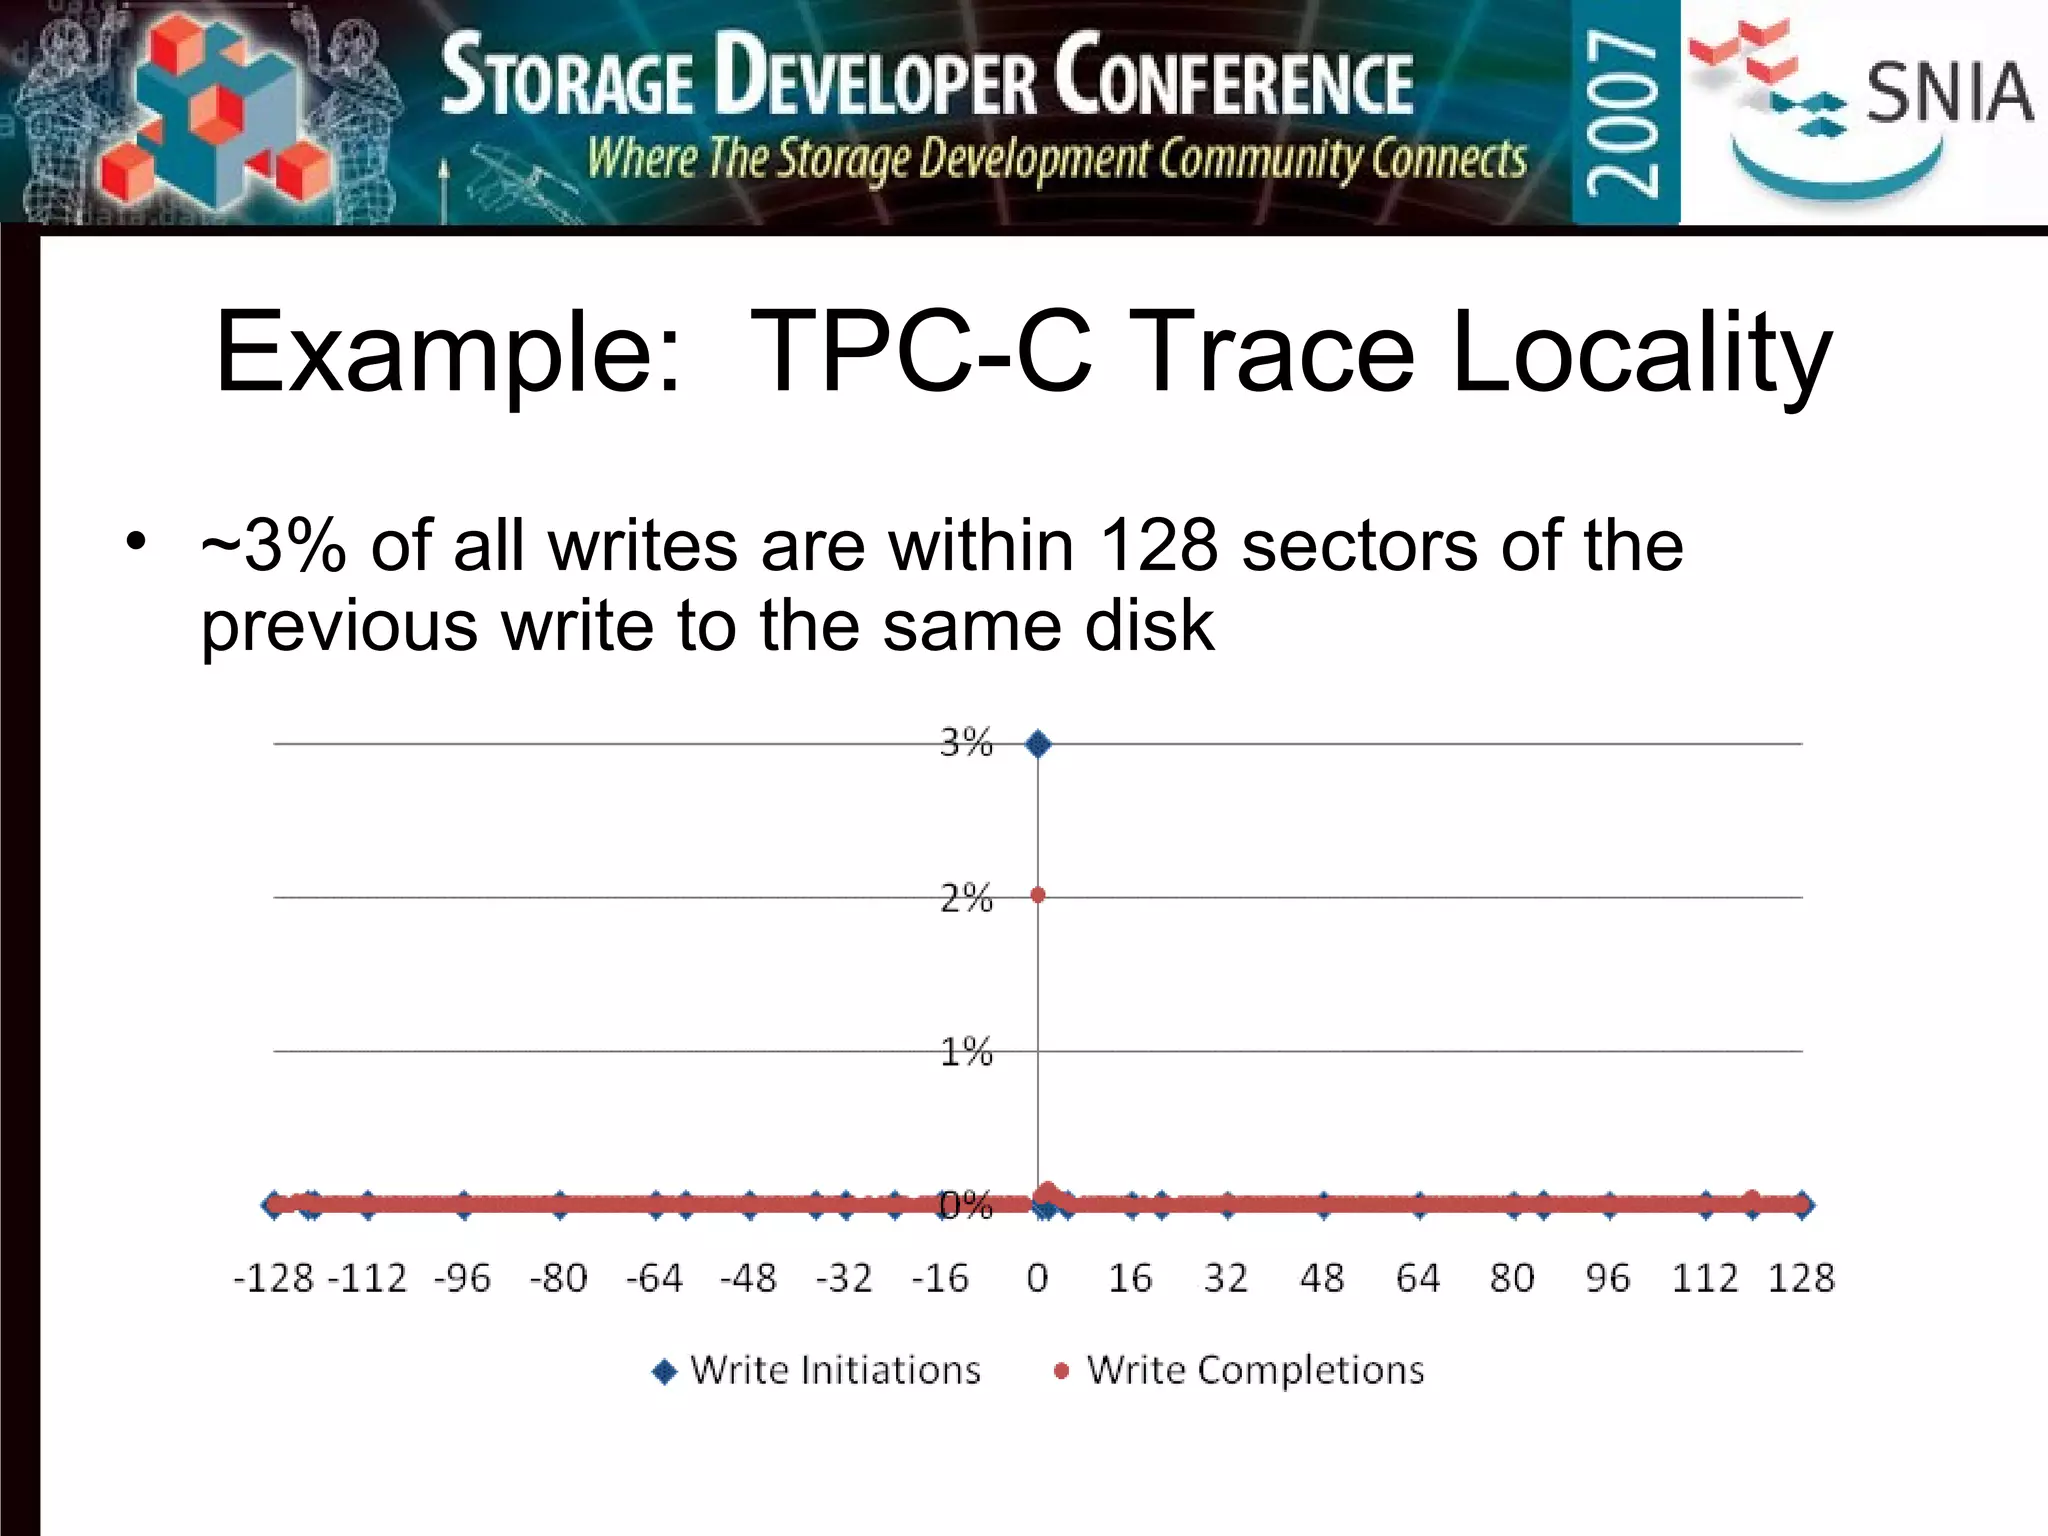
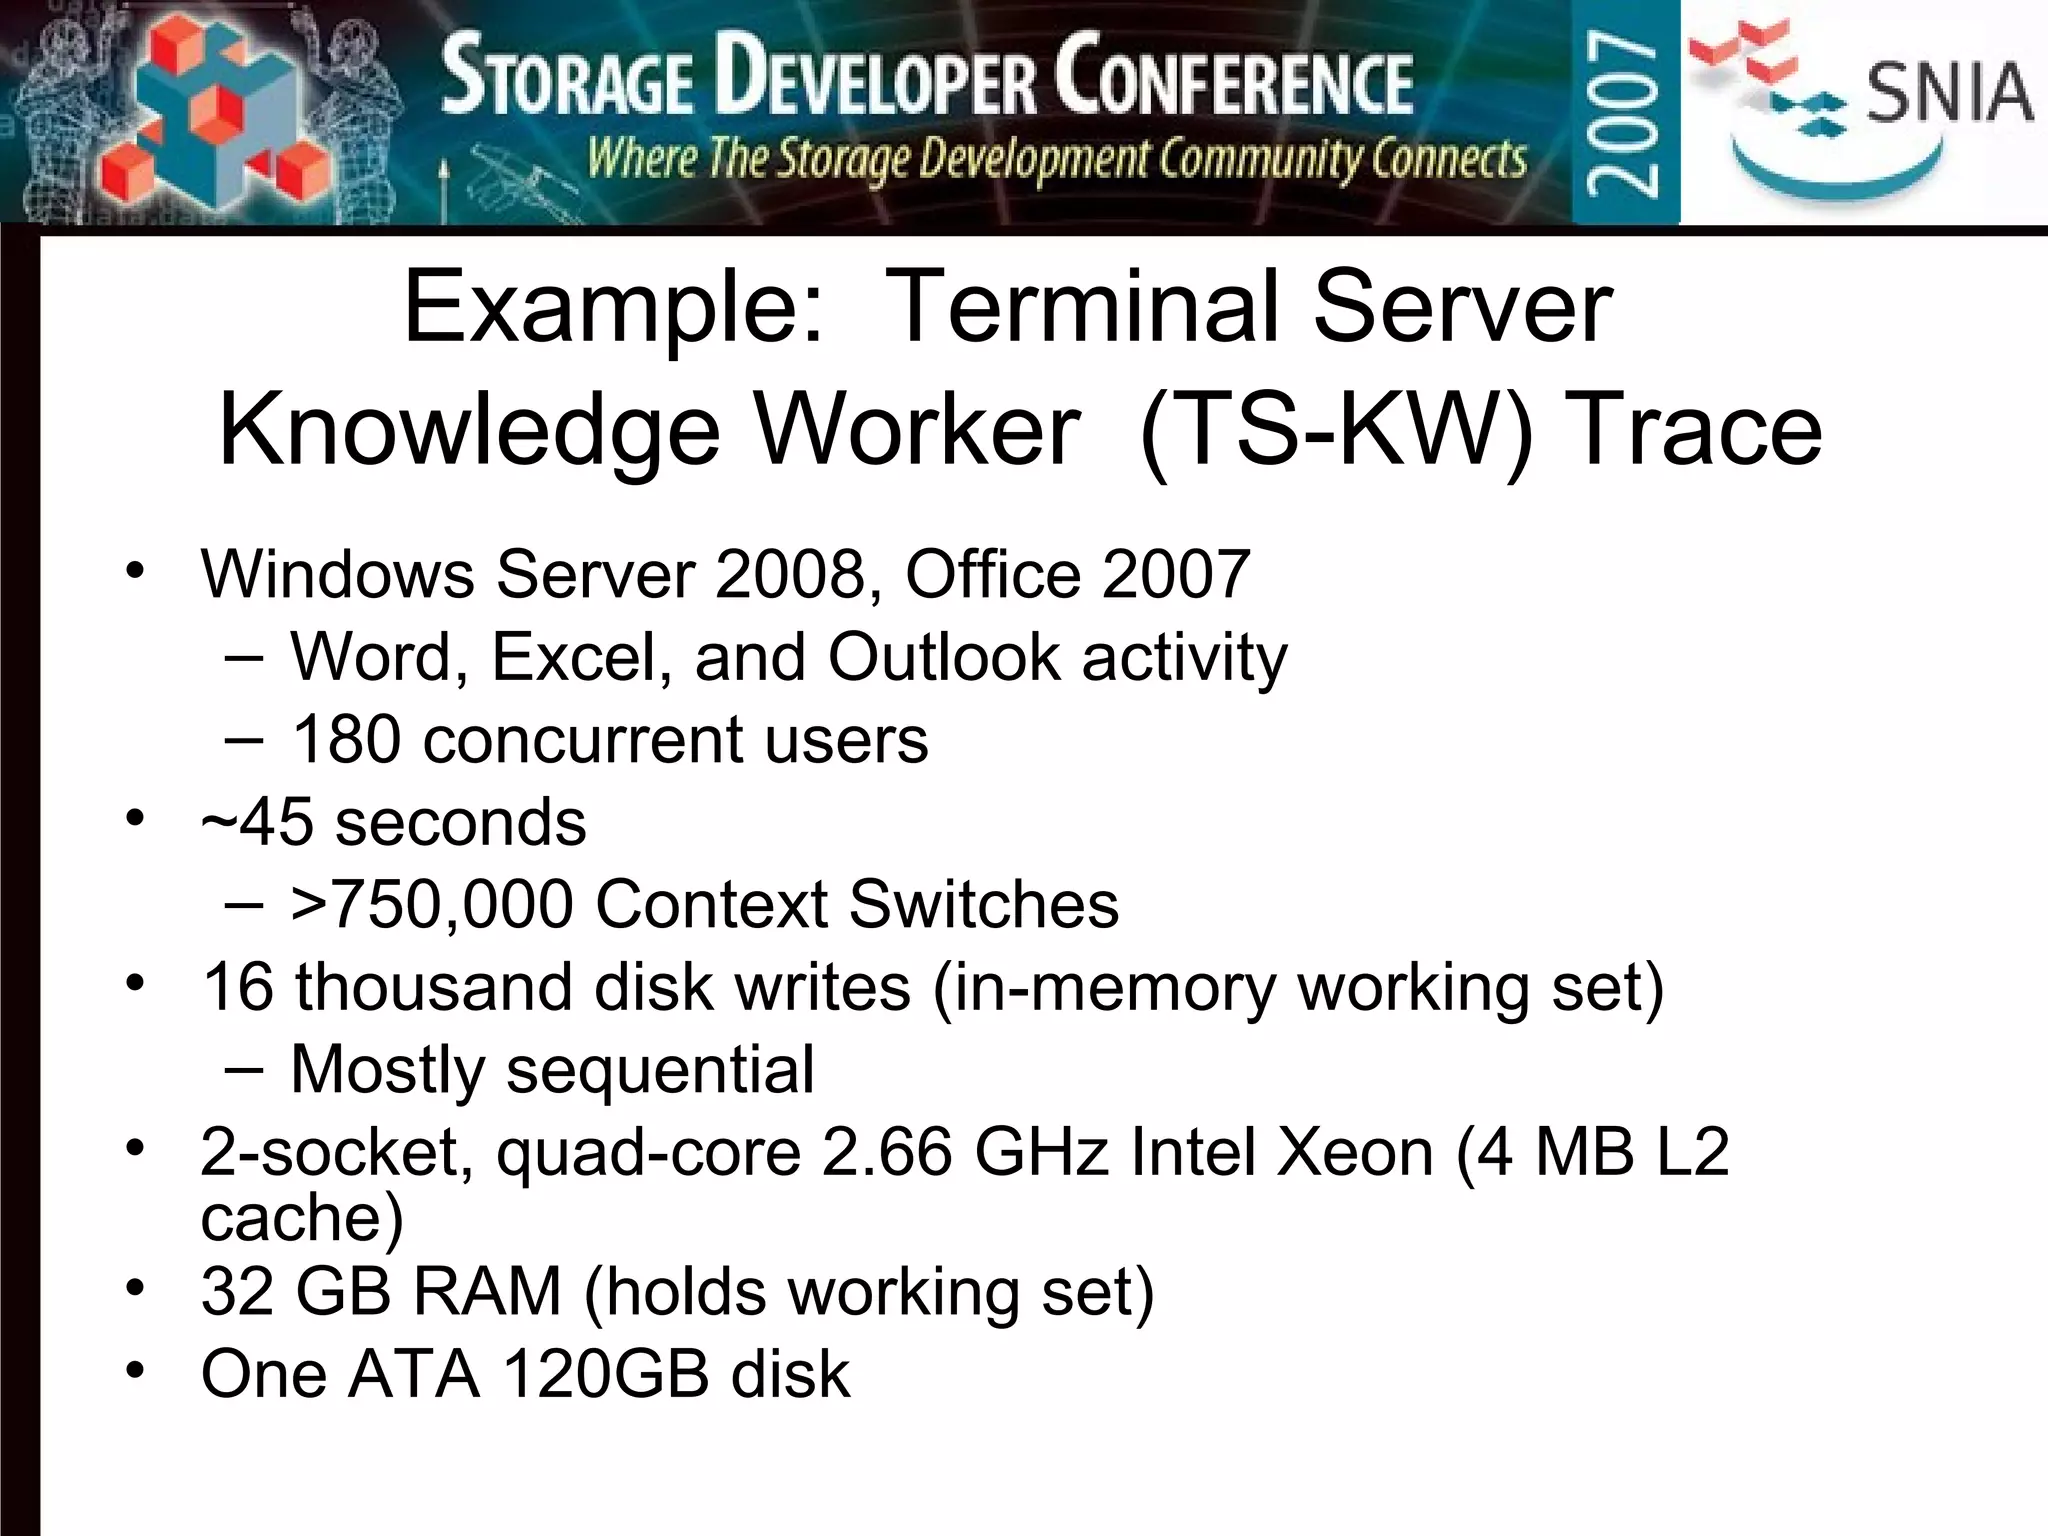
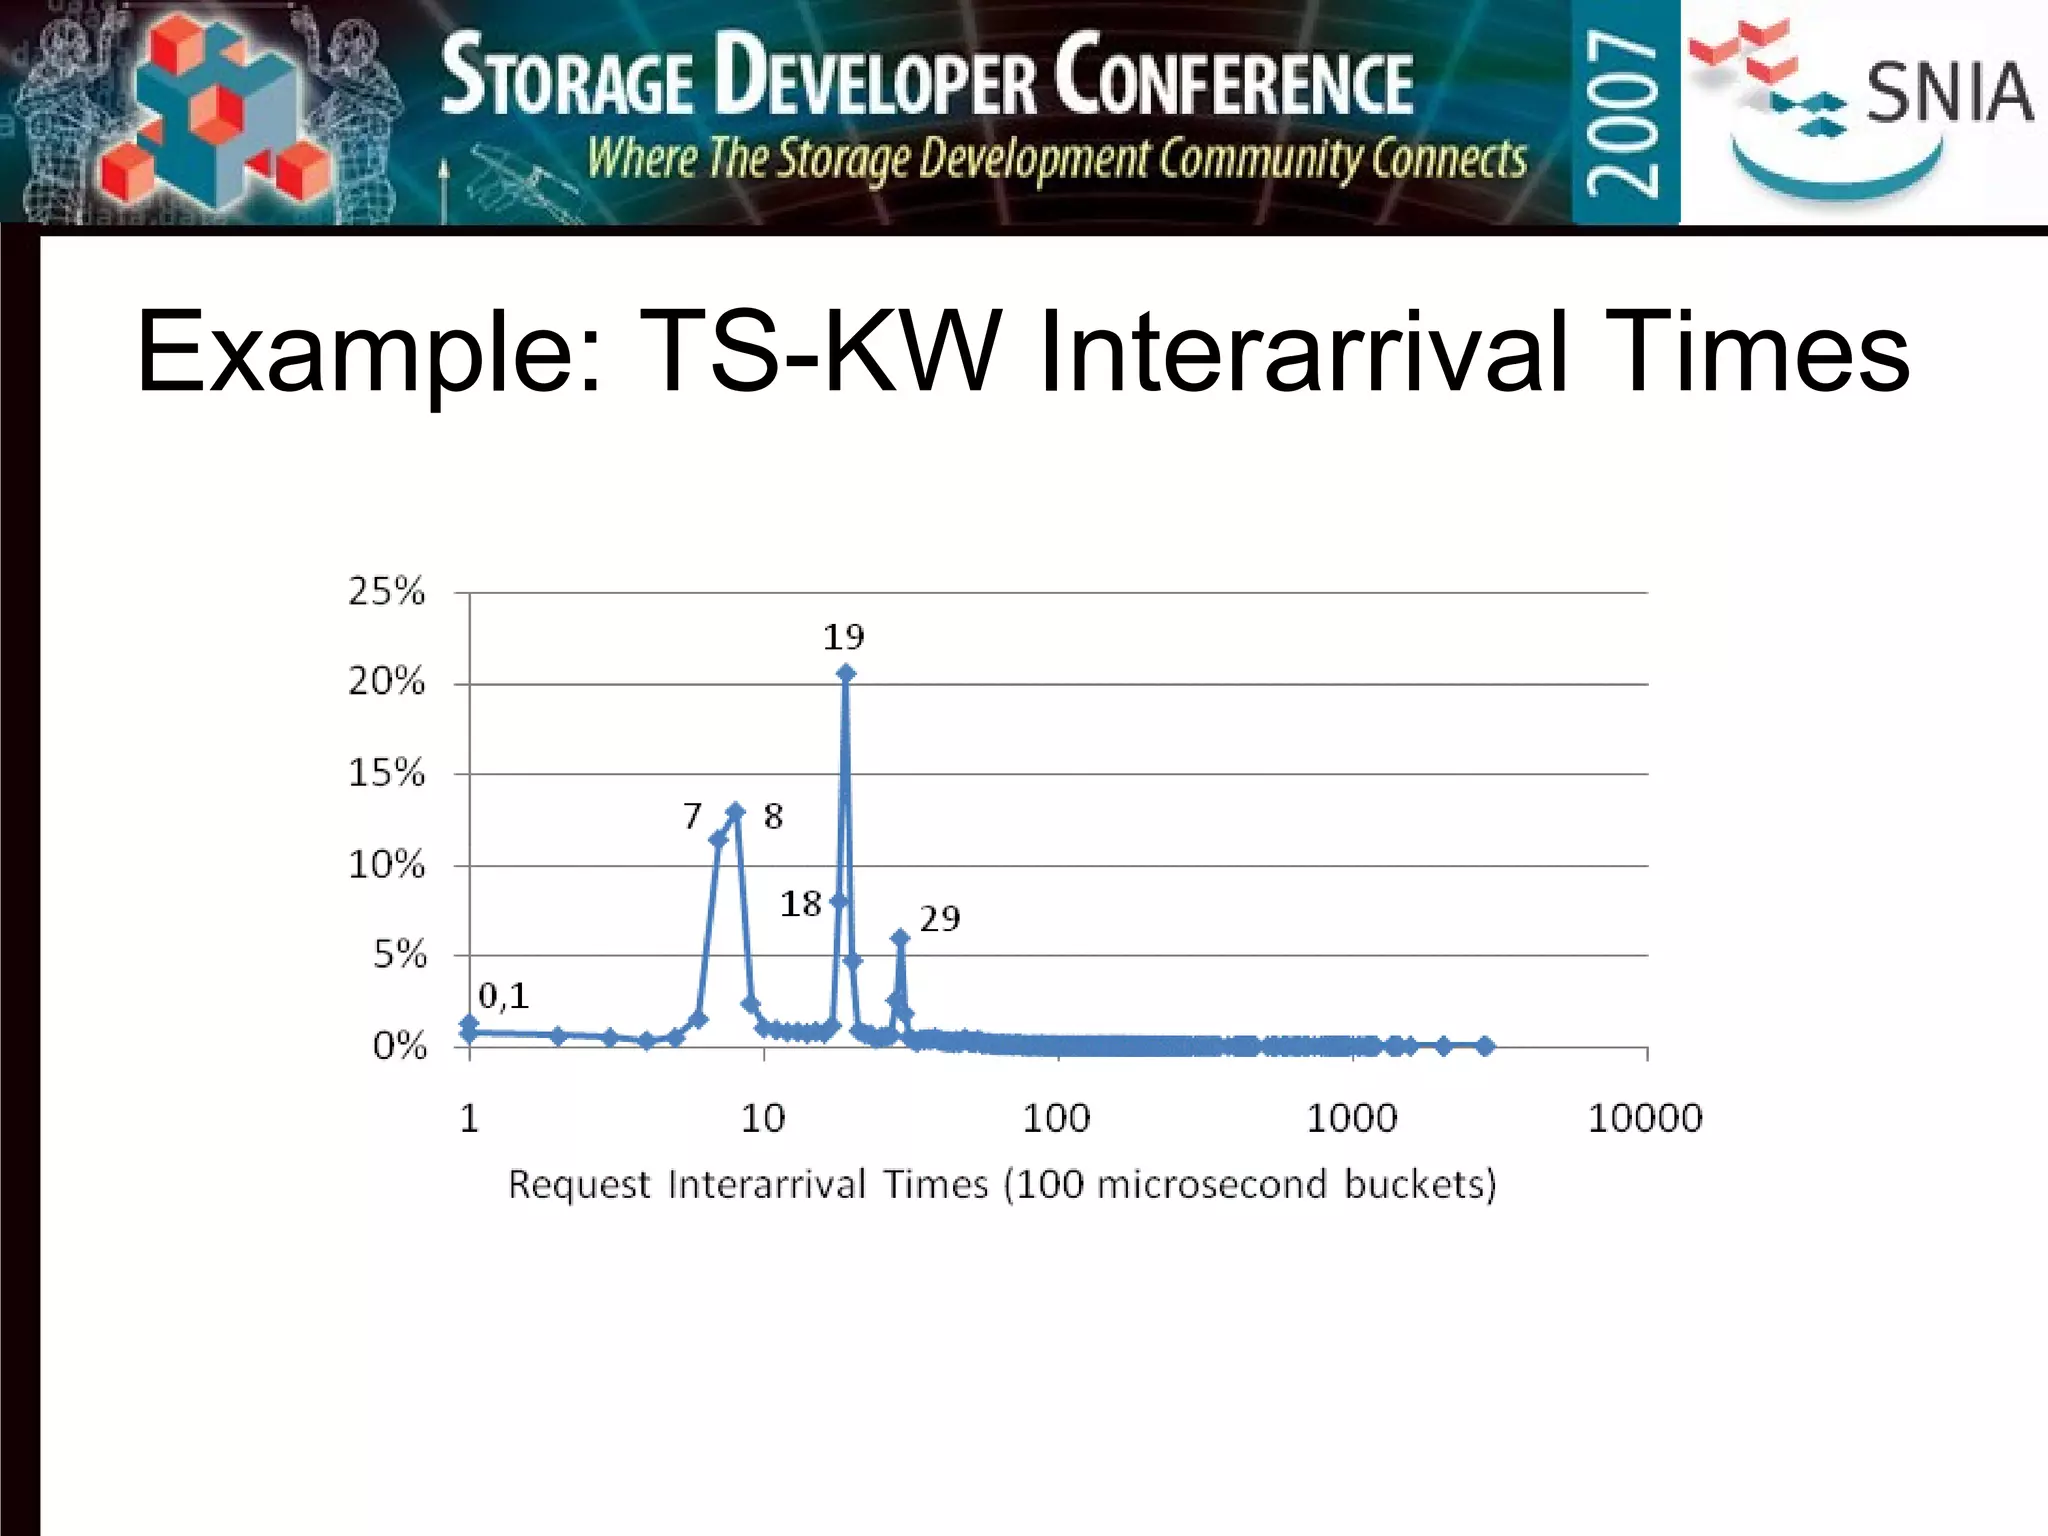
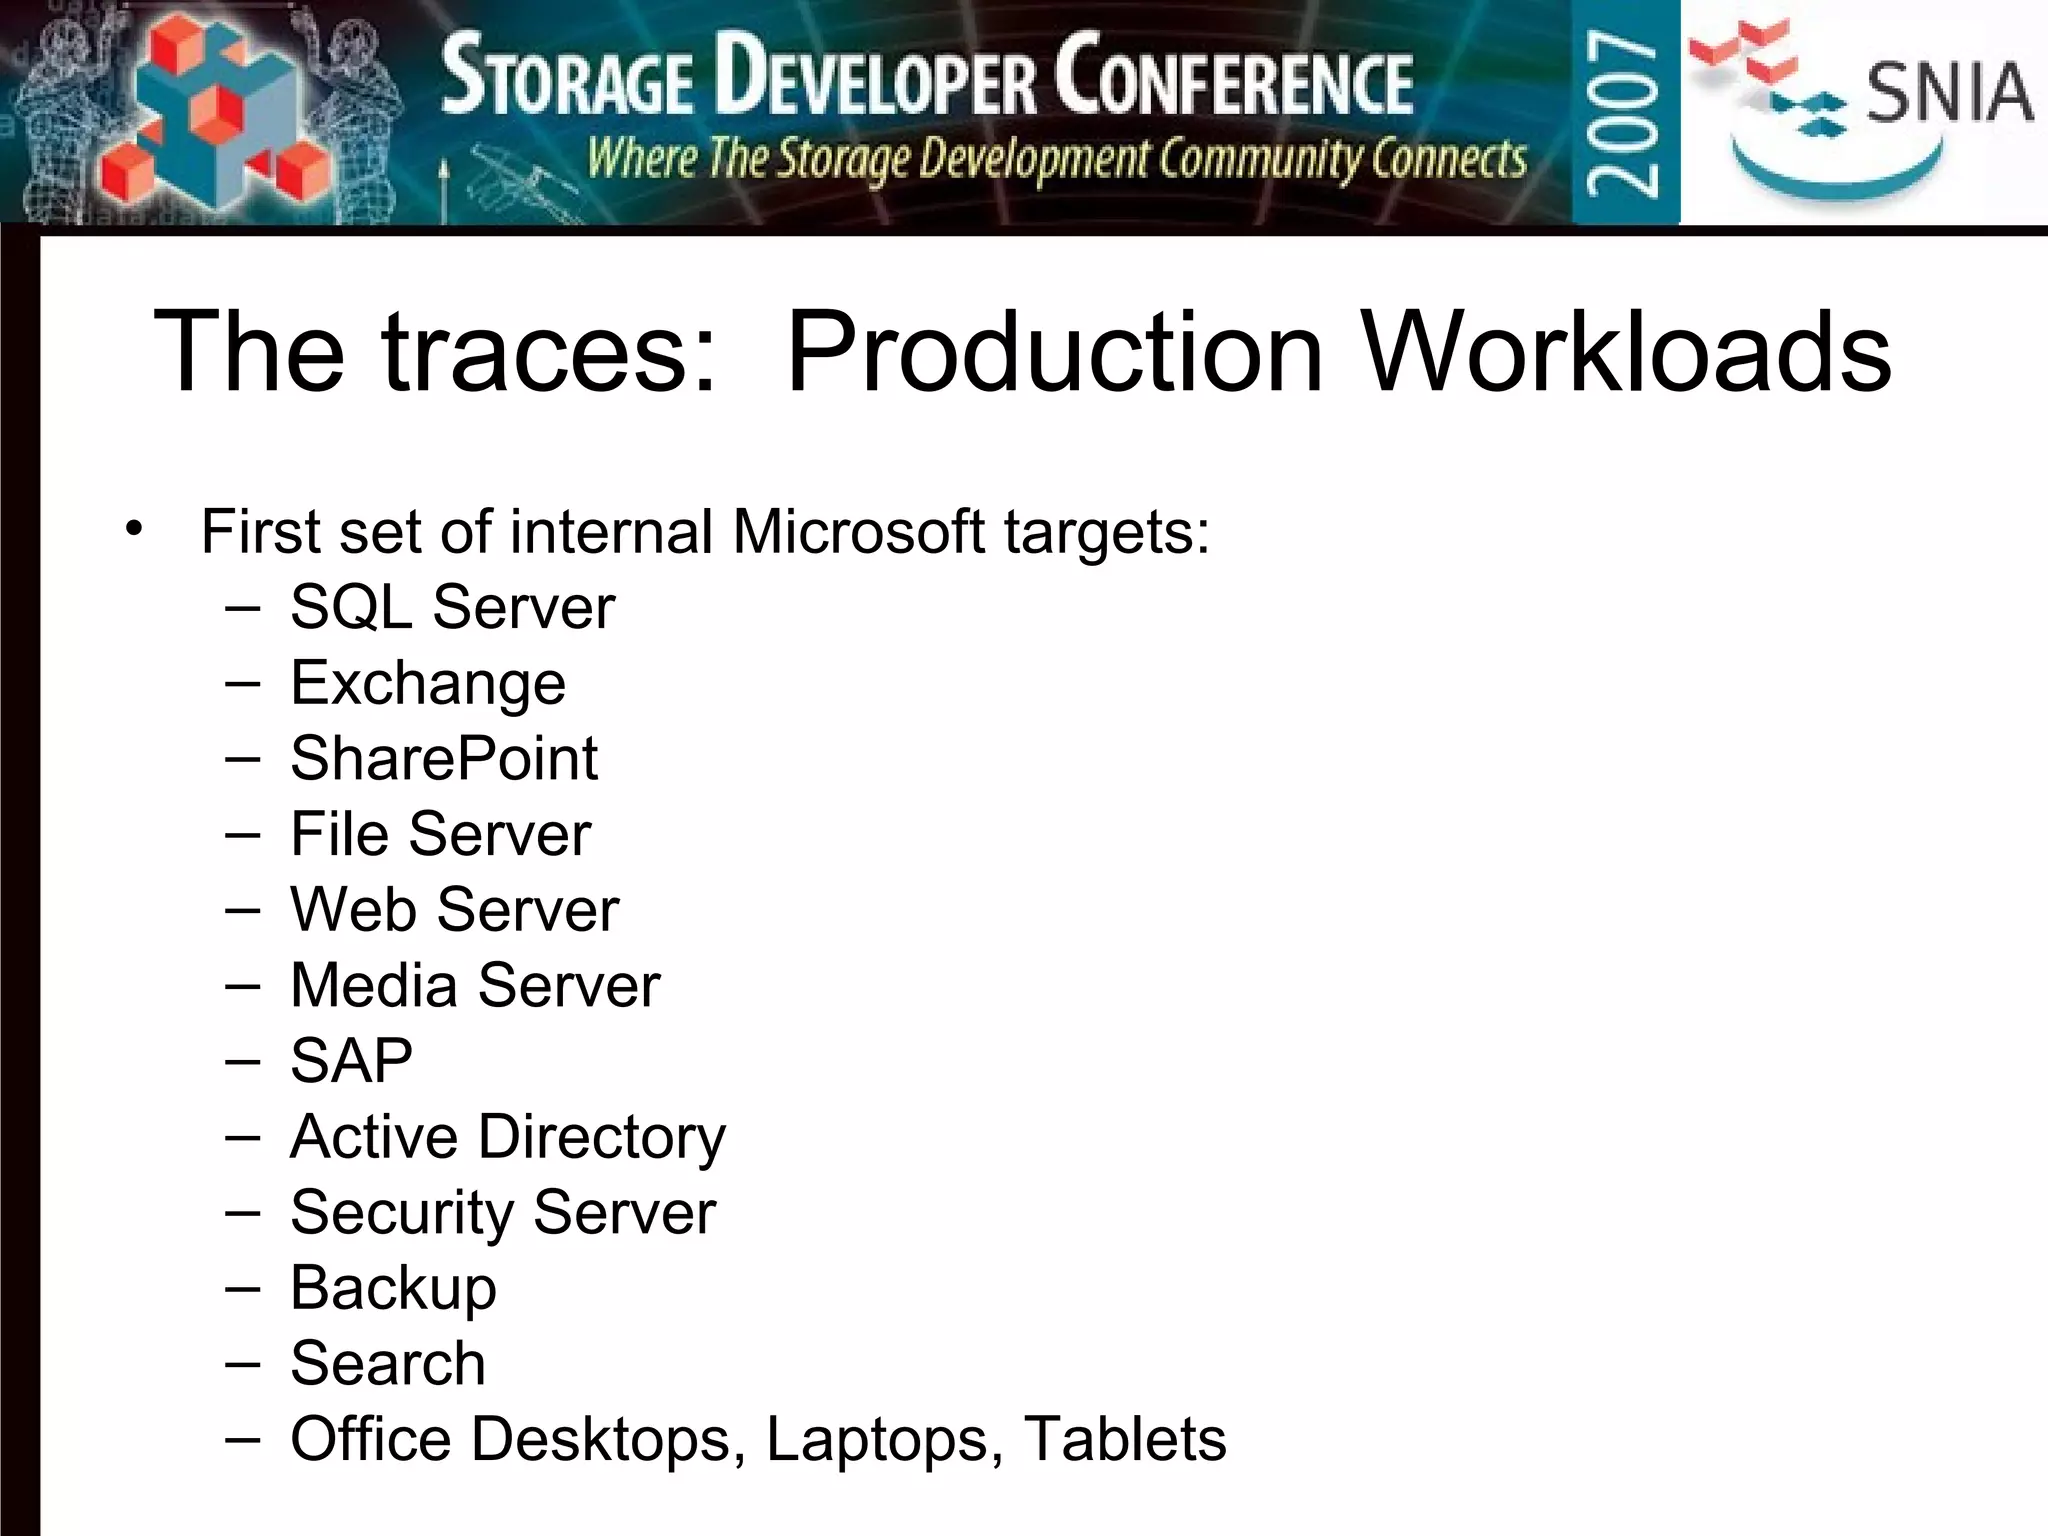
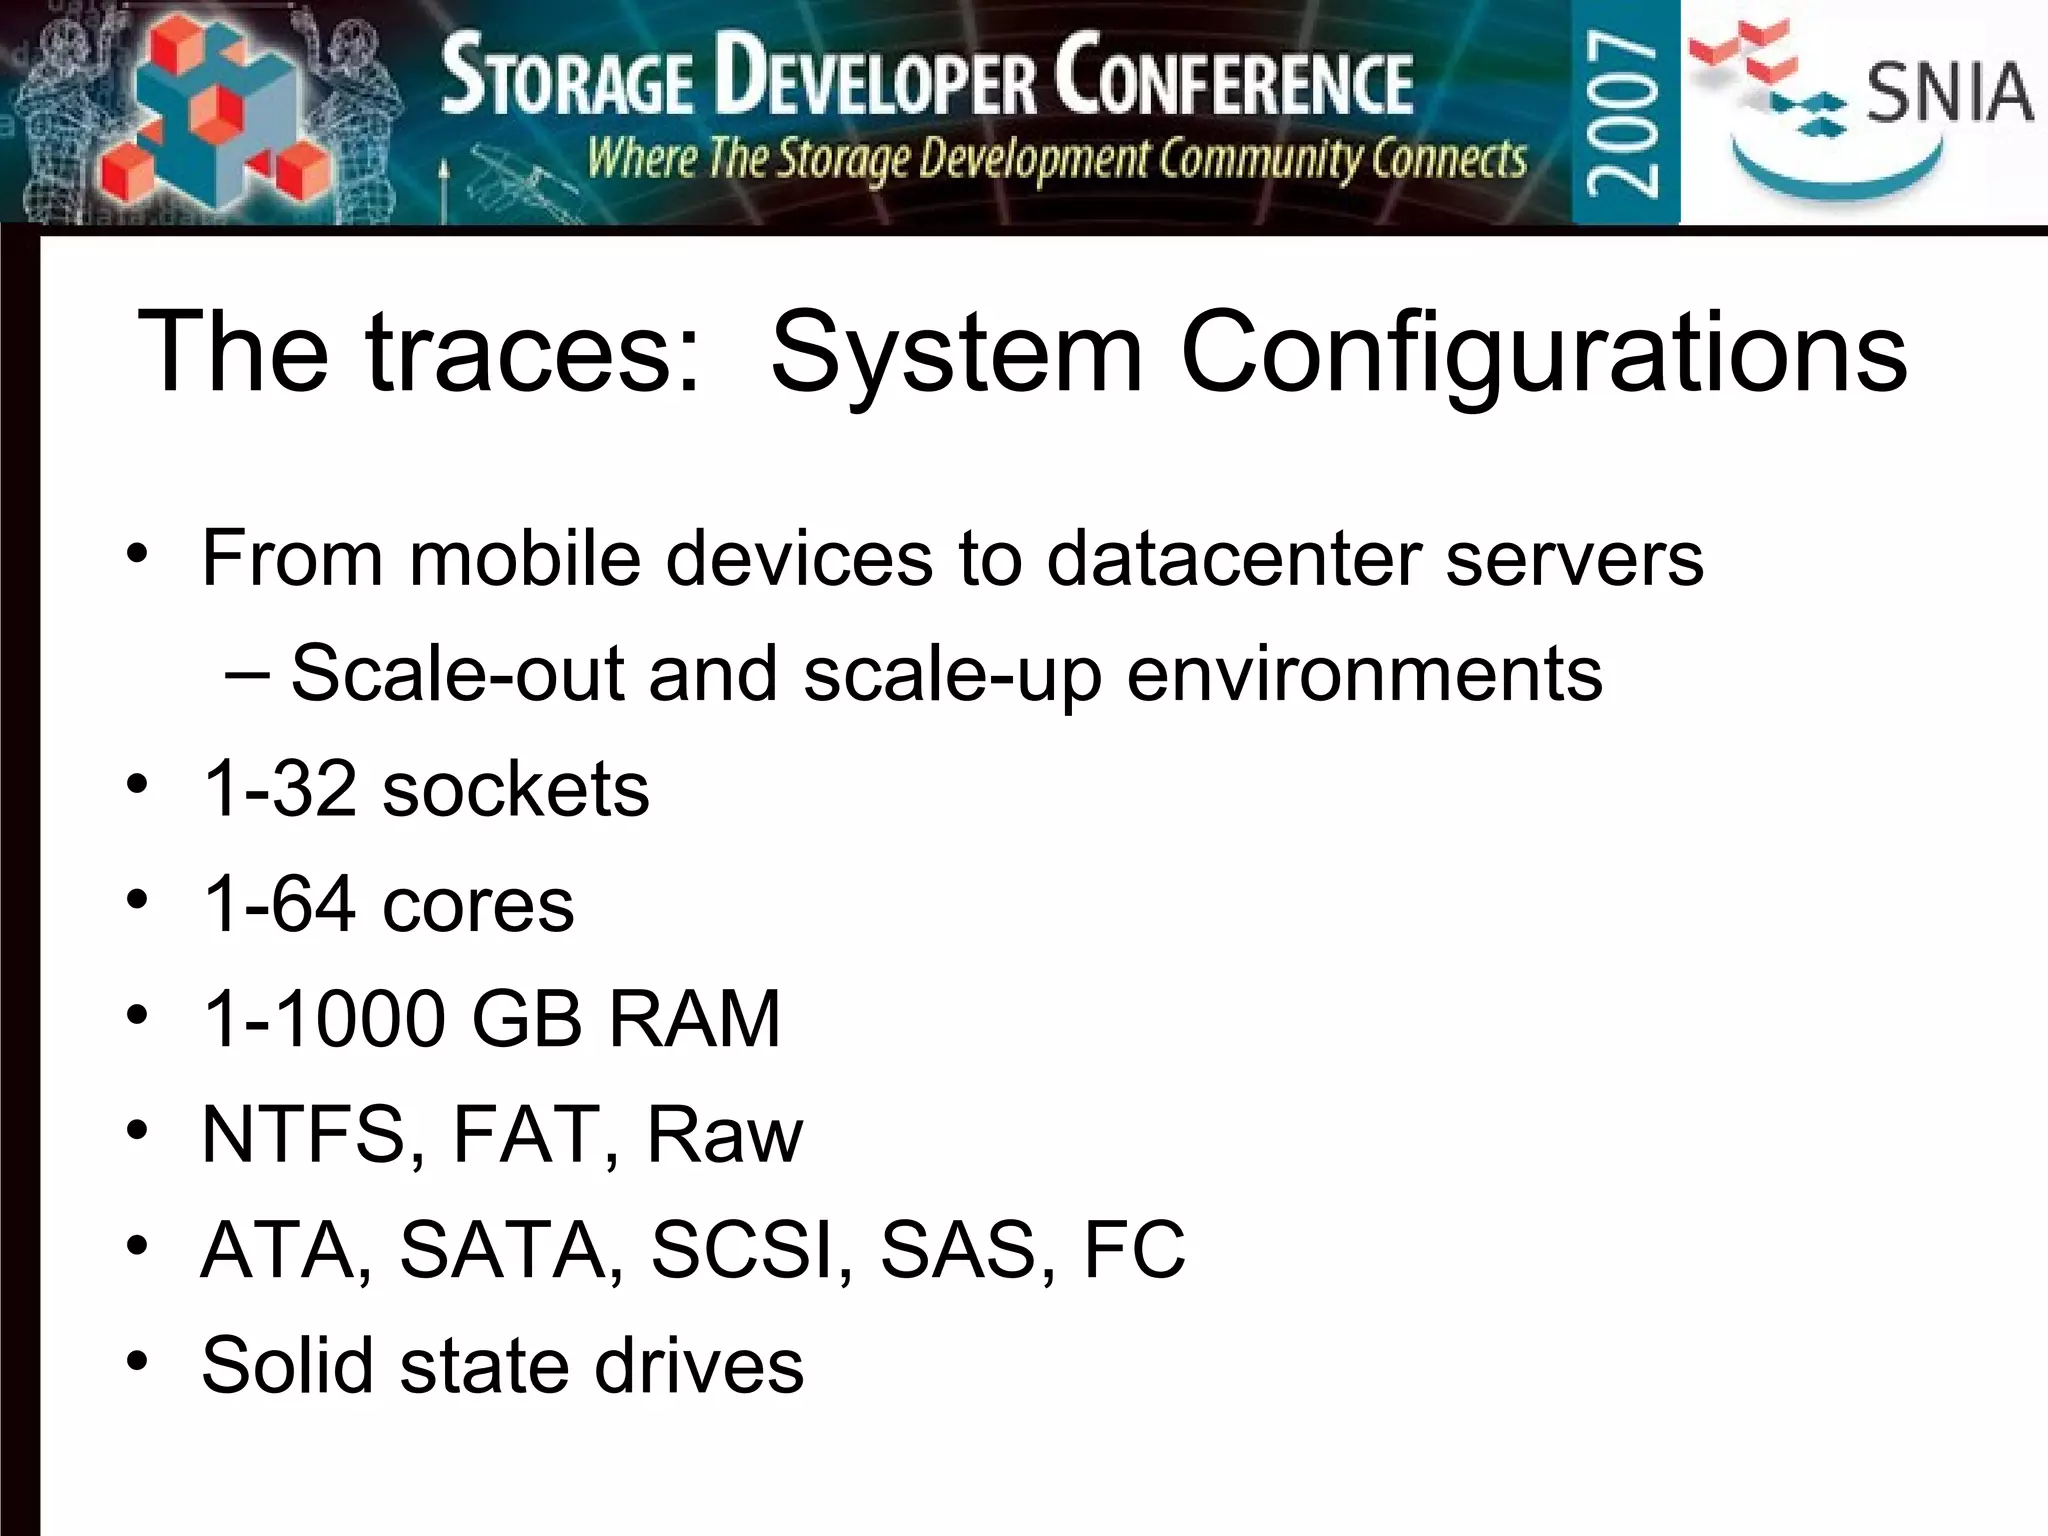


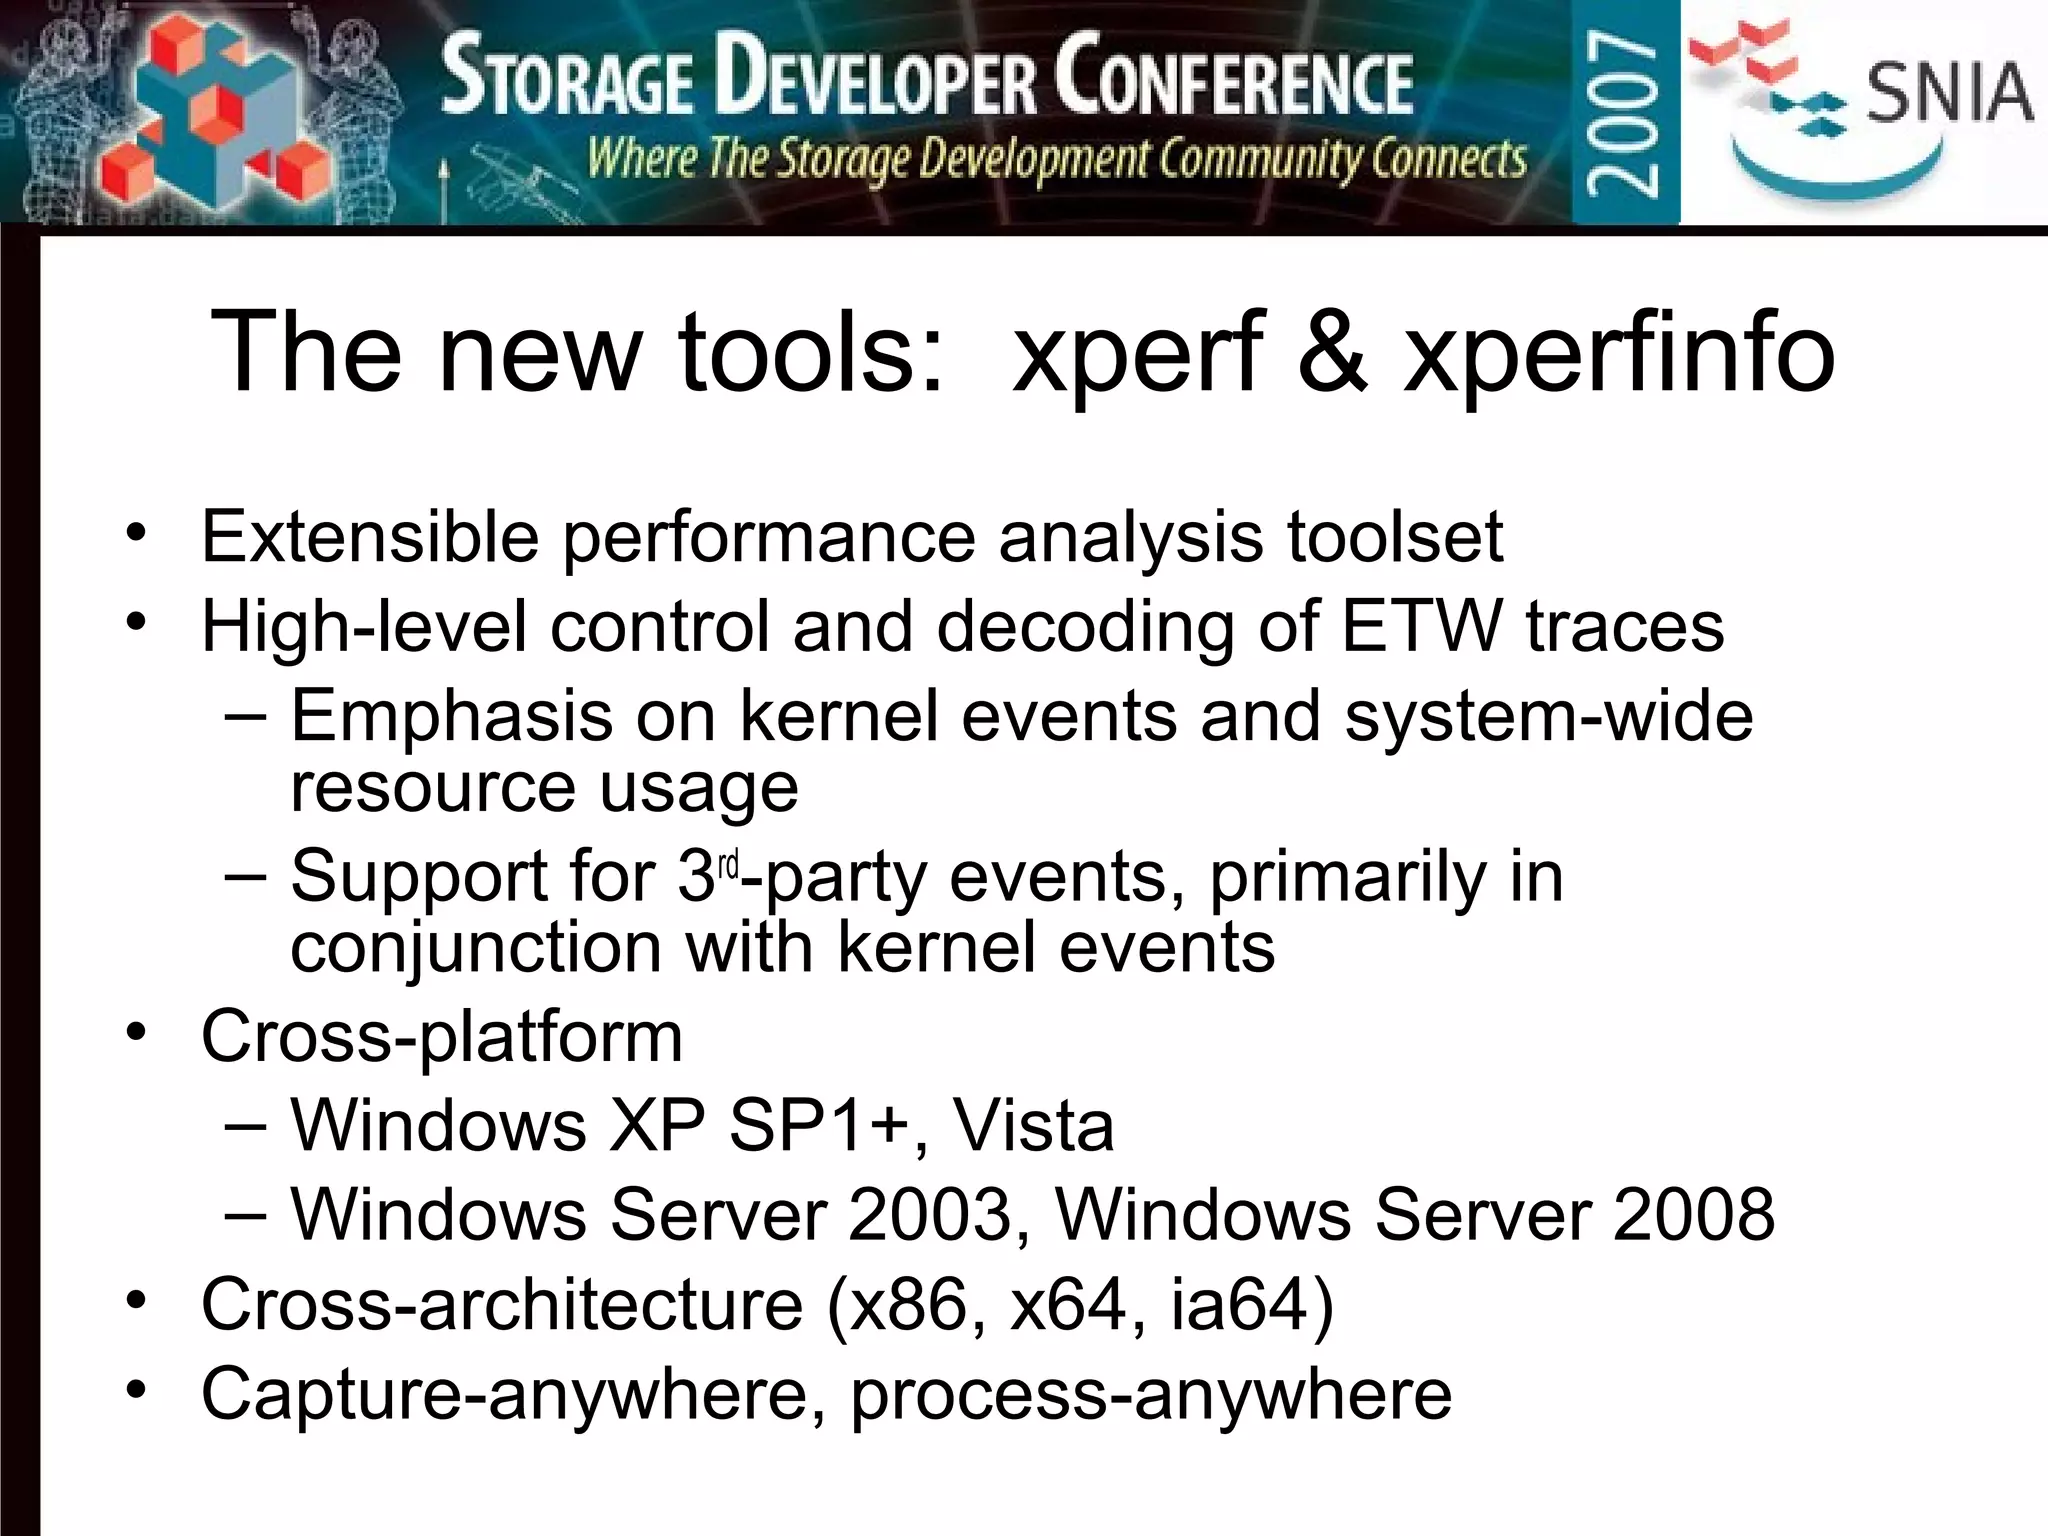
- The document discusses tools for capturing comprehensive storage workload traces in Windows, including Event Tracing for Windows (ETW), xperf, and xperfinfo. - Examples of traces that will be provided include benchmarks like TPC-C and production workloads from SQL Server, Exchange, and file servers. - The goal is to supply researchers with long-term real-world traces and tools to enable better storage performance analysis and research.


![The power of linux advanced tracer [POUG18]](https://cdn.slidesharecdn.com/ss_thumbnails/thepoweroflinuxadvancedtracer-180909125236-thumbnail.jpg?width=640&height=640&fit=bounds)


