Downloaded 224 times
![Time Management – Sample Cheat Sheet
Time Processes(6): Activity Definition, Activity Sequencing, Activity Resource Estimating, Activity
Duration Estimating, Schedule Development, Schedule Control
Sequence Activities:
PDM or AON (FS, FF, SS, SF)
GERT (rarely used)-(loops between activities)
Dependencies [Mandatory (hard logic), Discretionary (soft logic), External]
LEADS and LAGS:
[Leads: starts activity before predecessor is complete] [Shortens the schedule]
[Lags: Inserted between activities] [Delays activity start]
Activity Resource Estimating: Equipment, materials, and People
Activity Duration Estimating: (PADDDING is BAD)
One-Point:( one per activity) (expert judgment) (guessing)
Analogous: (Top Down) (expert judgment and historical information to predict the future)
Parametric: (heuristics-80/20 rule) (Regression analysis – scatter diagram, Learning curve)
Three-Point (PERT): EAD=(P+4M+O)/6, SD=P-O/6, Variance=(((p-o)/6))2, Range=EAD+/-SD
Reserve Analysis: (Risk Contingency – time reserves and management reserves)
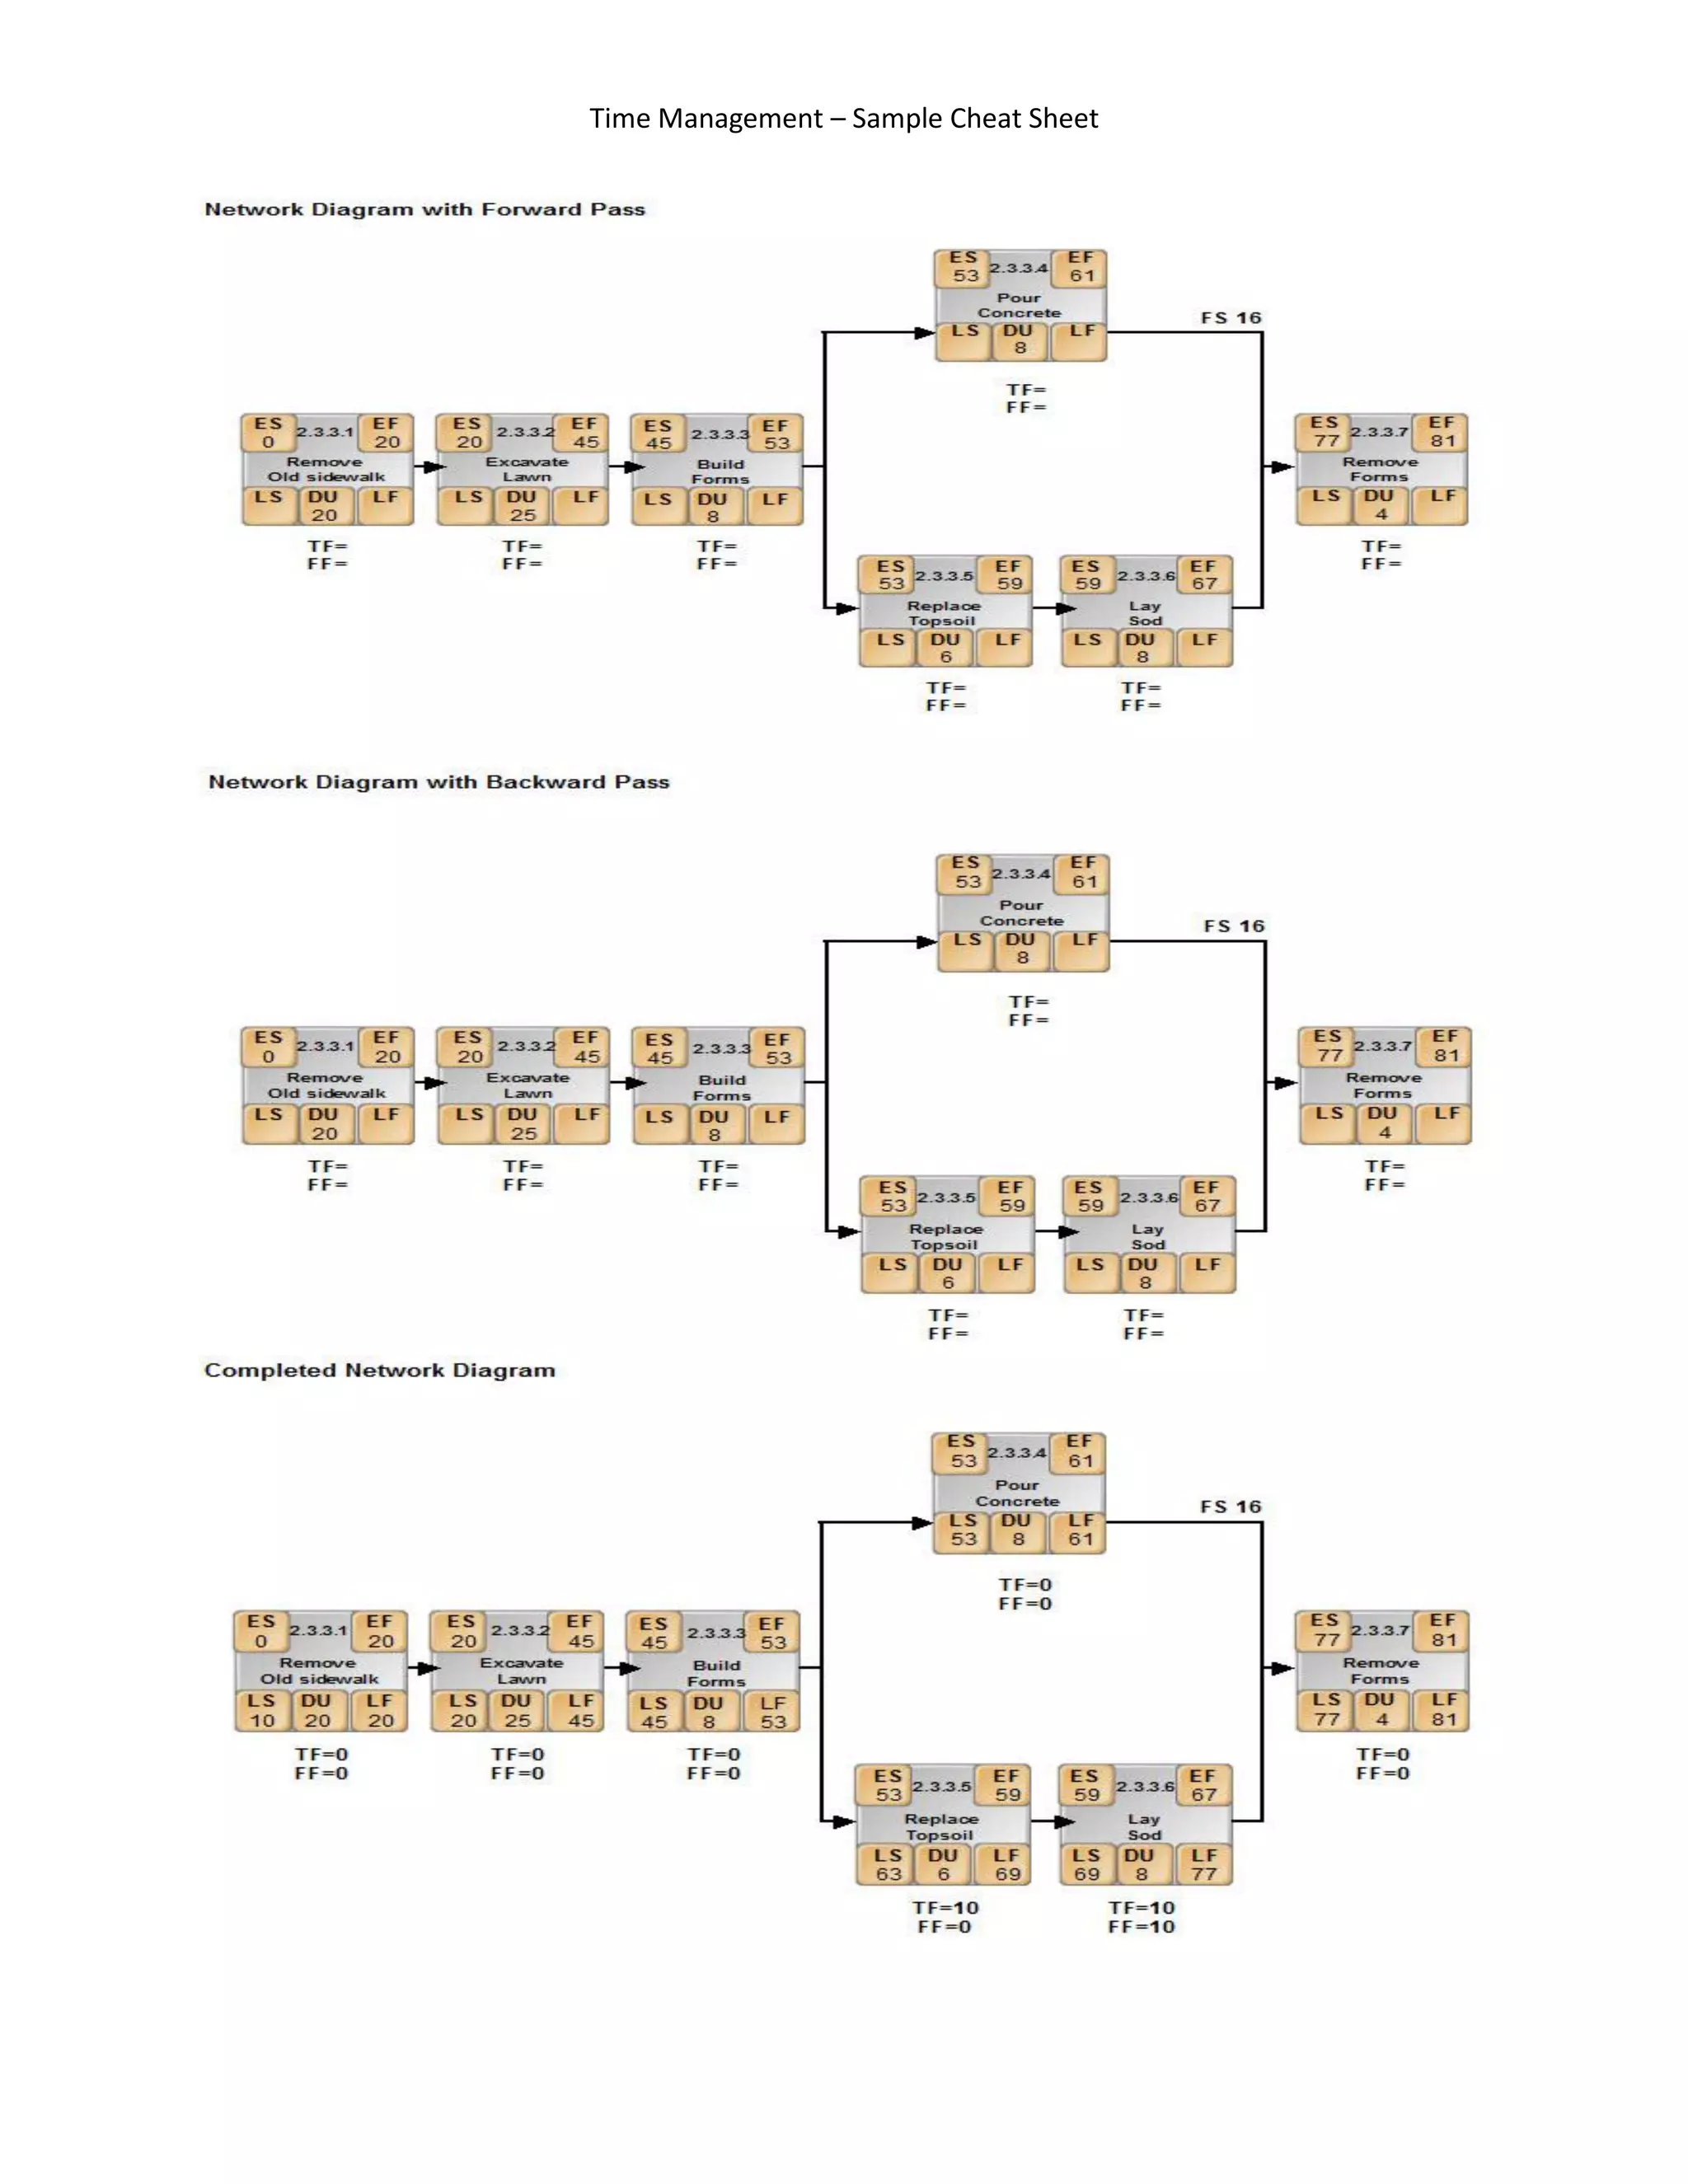
Schedule Network:
Critical Path Method CPM:
Schedule Compression: (Fast track, Crash) Critical Path-(forward/backward pass)
What-If Analysis: (Monte Carlo) Near Critical Path
Resource Leveling: (schedule slips and cost increases) TF=LF-EF, FF=LS-ES
Critical Chain Method: FLOAT is SLACK
-(takes into account, directly, both activity and resource dependencies)
-(duration buffers built into the chain at critical milestones)
Project Schedule:
Network Diagram
Milestone chart: have no duration; good for reporting to management and the customer
Bar Chart: completed after the WBS and the network diagram for tracking progress
Schedule Baseline:
(manages the project and the schedule that the team’s performance is measured against)
(only changed with approved changes)
Control Schedule: (means measure) (measure against the plan)
Looking for things causing changes and influencing them to change
Re-Estimating at least ONCE over the life of the project
Work performance measurements, changes to schedule baseline and any part of the project](https://image.slidesharecdn.com/capmprocesscheatsheet-110620163321-phpapp01/75/Capm-process-cheat-sheet-1-2048.jpg)

This document provides an overview of key time management processes and techniques: 1) It outlines the six main time processes as activity definition, sequencing, resource estimating, duration estimating, schedule development, and schedule control. 2) Methods for sequencing activities include precedence diagramming method (PDM), arrow diagramming method (ADM), and generalized activity on node (AON) diagrams. 3) Schedule development techniques include critical path method (CPM), schedule compression methods like crashing and fast tracking, resource leveling, critical chain method, and network diagrams, bar charts, and milestone charts.


![Vibe Coding vs. Spec-Driven Development [Free Meetup]](https://cdn.slidesharecdn.com/ss_thumbnails/vibecodingvsspecdrivendevelopment-251209105622-43f455e7-thumbnail.jpg?width=640&height=640&fit=bounds)


