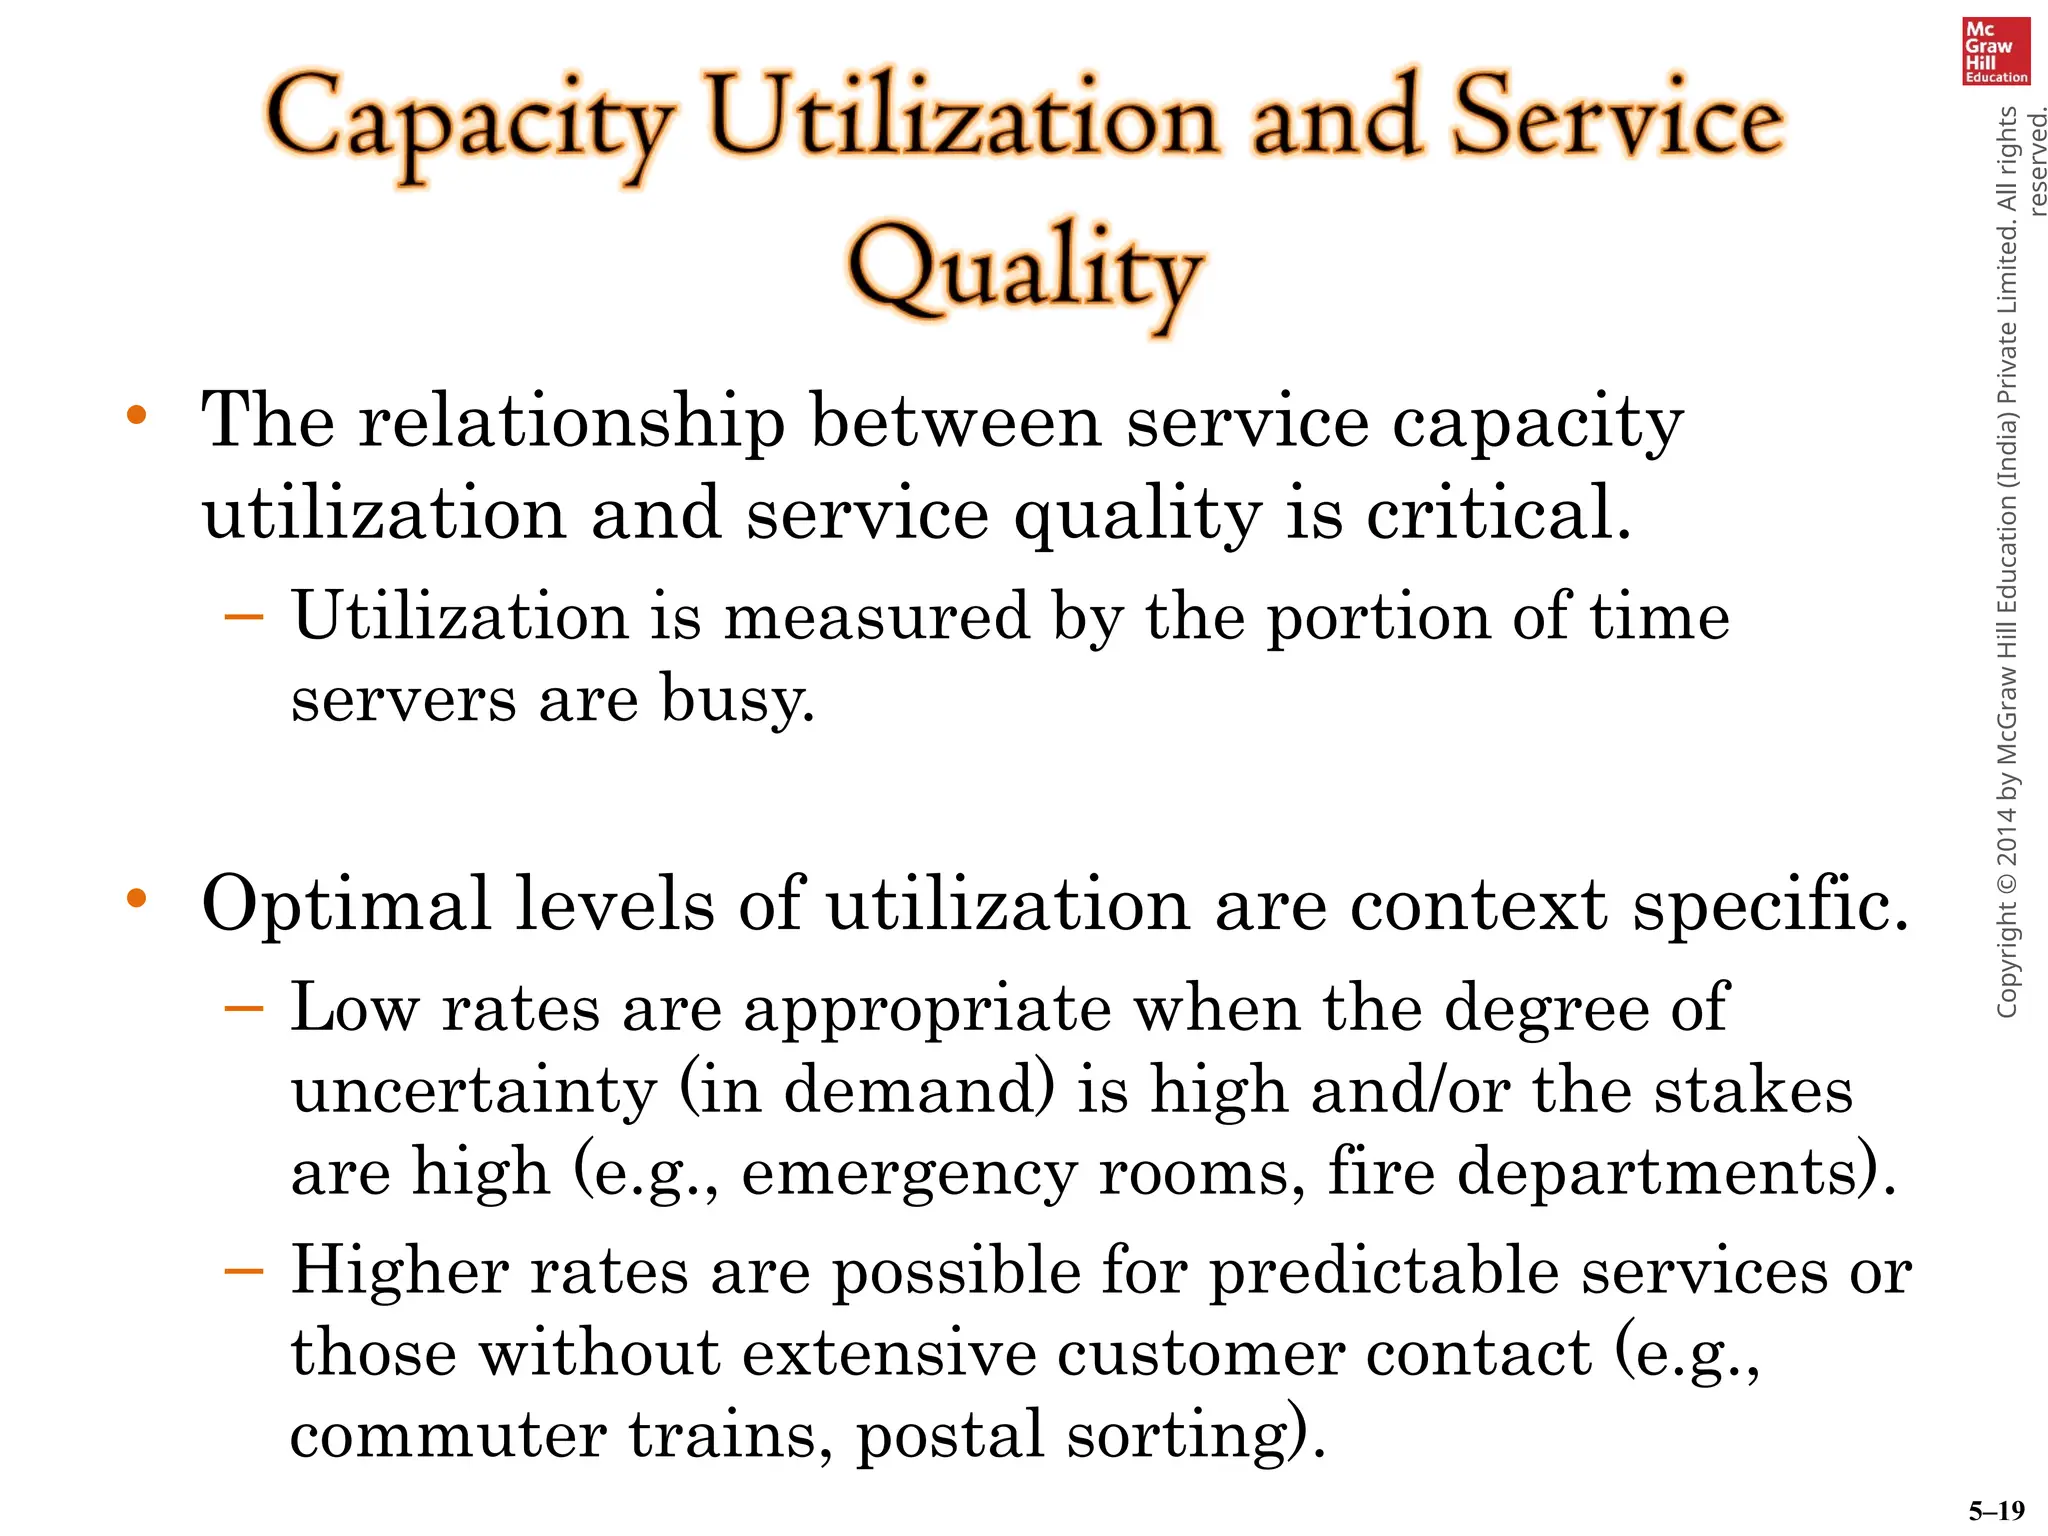
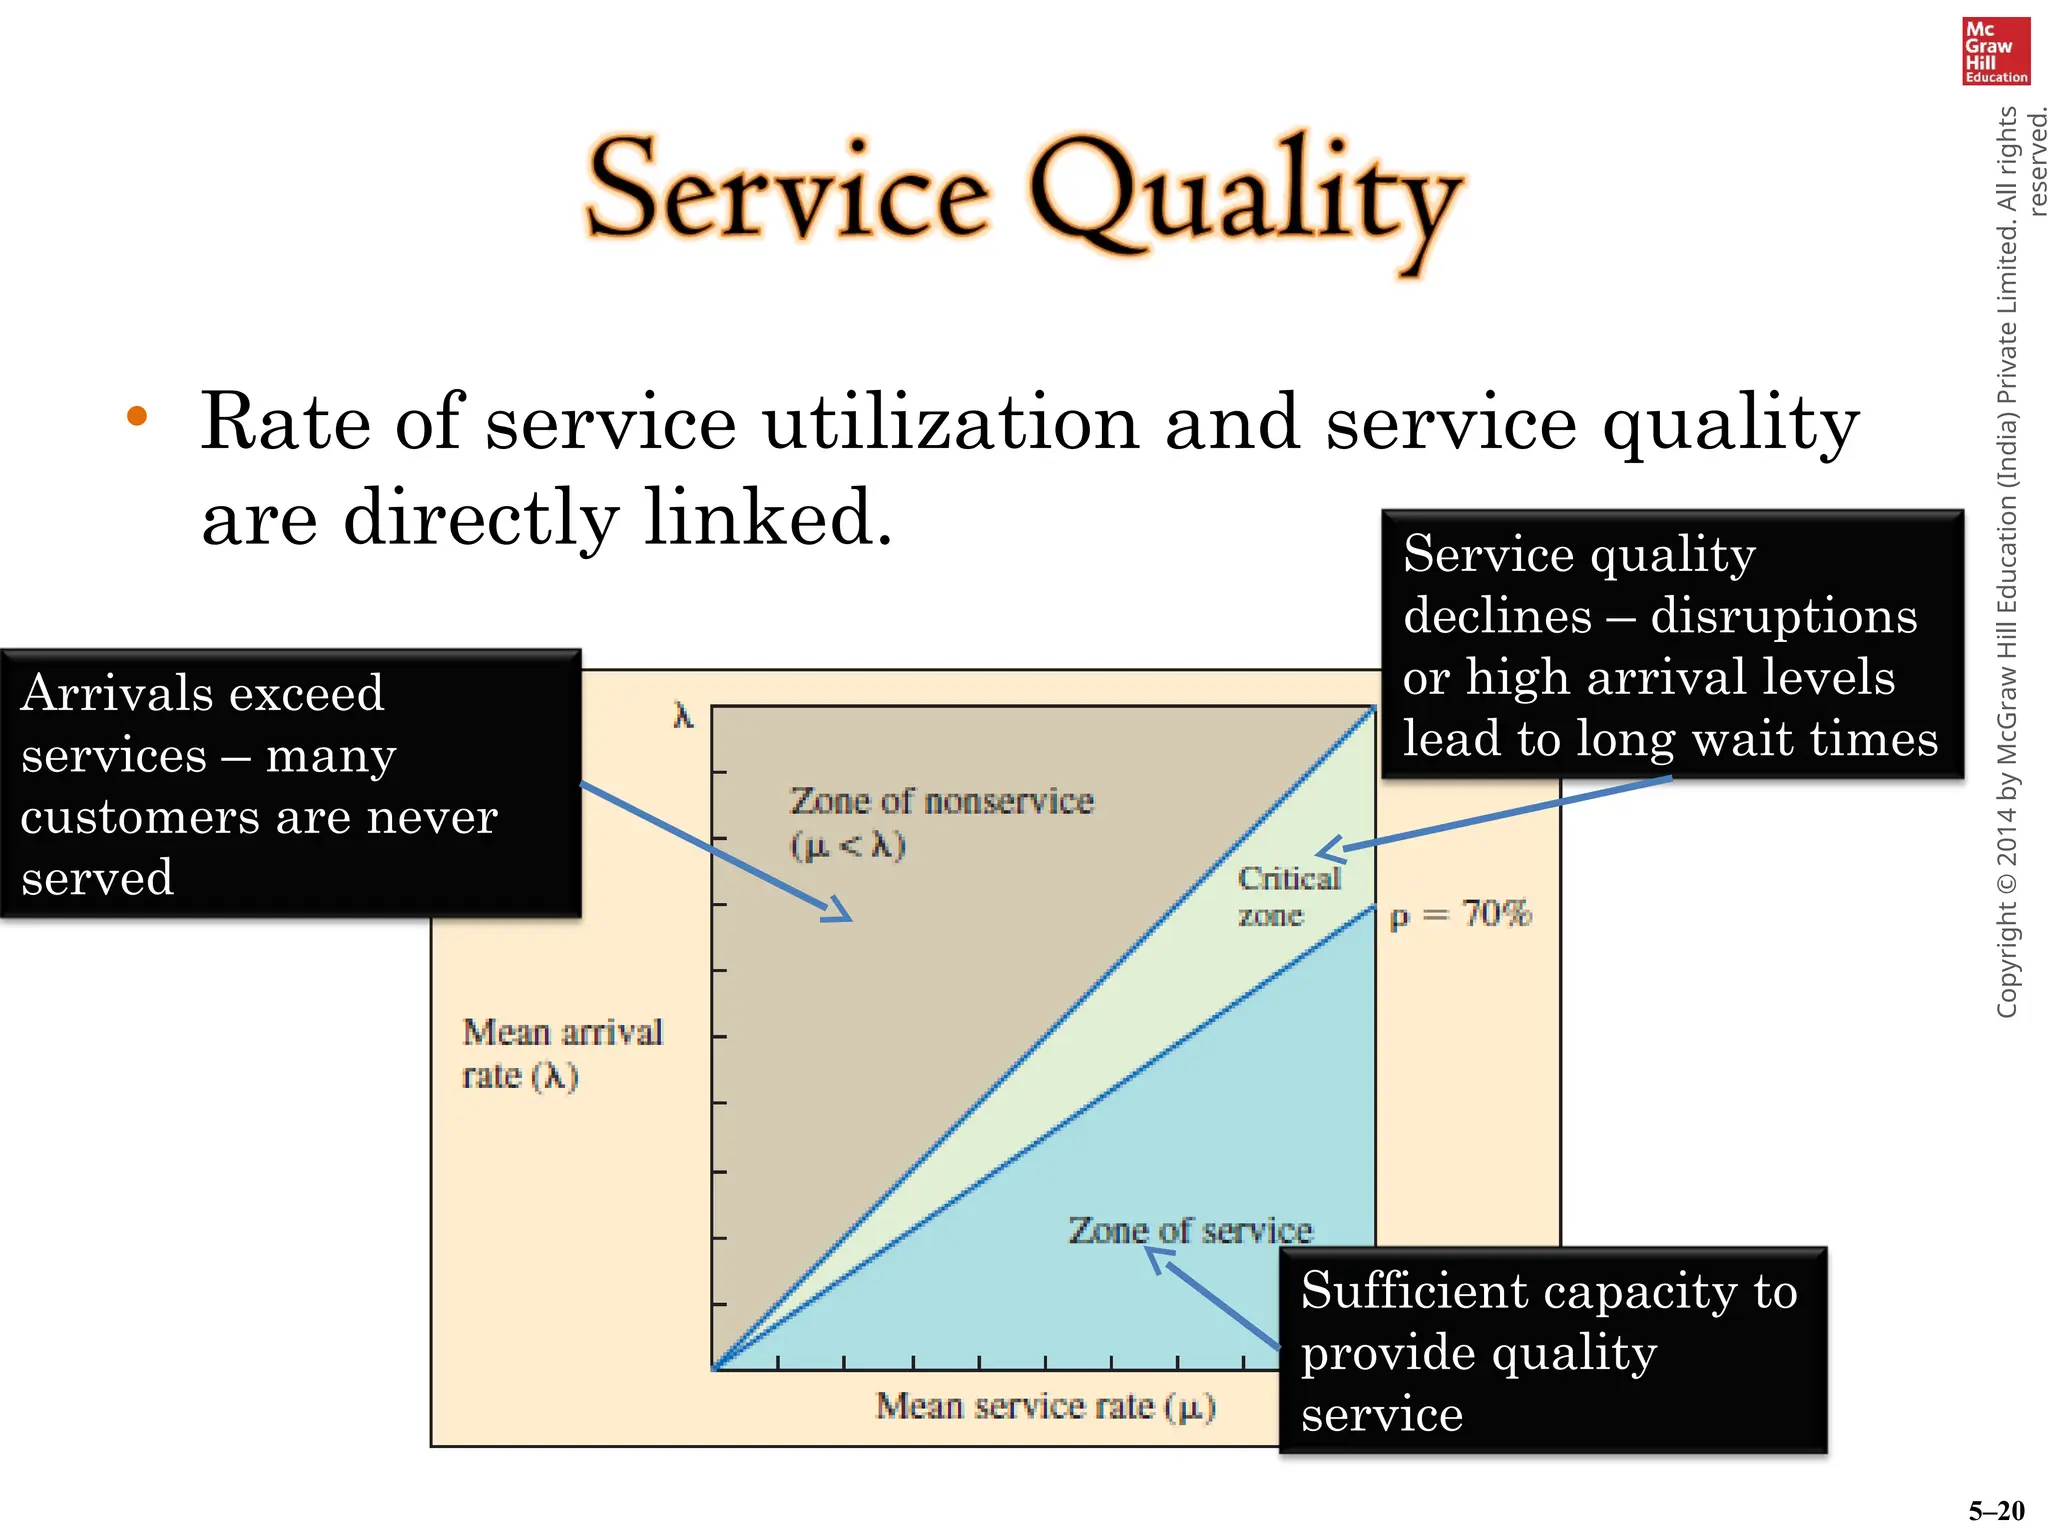
•
Tata McGraw
Chapter 5
Strategic Capacity
Management
• Strategic Capacity Planning Defined
• Capacity Utilization & Best Operating
Level
• Economies & Diseconomies of Scale
• The Experience Curve
• Capacity Focus, Flexibility & Planning
• Determining Capacity Requirements
• Capacity Utilization & Service Quality
OBJECTIVES
5-3
Strategic Capacity Planning
• Capacity can be defined as the ability to
hold, receive, store, or accommodate
• Strategic capacity planning is an
approach for determining the overall
capacity level of capital intensive
resources, including facilities,
equipment, and overall labor force size
5-4
Capacity Utilization
• Where
• Capacity used
– rate of output actually achieved
• Best operating level
– capacity for which the process was designed
level
operating
Best
used
Capacity
rate
n
utilizatio
Capacity 
5-5
5–6
Copyright
©
2014
by
McGraw
Hill
Education
(India)
Private
Limited.
All
rights
reserved.
• Capacity utilization rate – a measure of how
close the firm is to its best possible operating
level
• Economies of scale – the idea that as a planet
gets larger and volume increases, the average
cost per unit tends to drop
• Diseconomies of scale – at some point, the plant
becomes too large and average cost per unit
begins to increase
5–7
Copyright
©
2014
by
McGraw
Hill
Education
(India)
Private
Limited.
All
rights
reserved.
Best Operating Level
Example: Engineers design engines and assembly lines to
operate at an ideal or “best operating level” to maximize
output and minimize ware
Underutilization
Best Operating
Level
Average
unit cost
of output
Volume
Overutilization
5-8
Example of Capacity Utilization
• During one week of production, a plant
produced 83 units of a product. Its
historic highest or best utilization
recorded was 120 units per week. What
is this plant’s capacity utilization rate?
 Answer:
Capacity utilization rate = Capacity used
Best operating
level
= 83/120
=0.69 or 69%
5-9
Economies & Diseconomies of Scale
100-unit
plant
200-unit
plant 300-unit
plant
400-unit
plant
Volume
Average
unit cost
of output
Economies of Scale and the Learning Curve working
Diseconomies of Scale start working
5-10
The Learning Curve
As plants produce more products, they
gain experience in the best production
methods and reduce their costs per unit
Total accumulated production of units
Cost or
price
per unit
Yesterday
Today
Tomorrow
5-11
5–12
Copyright
©
2014
by
McGraw
Hill
Education
(India)
Private
Limited.
All
rights
reserved.
• Capacity focus – the idea that a production
facility works best when it is concentrated on a
limited set of production objectives
– Focused factory or plant within a plant (PWP)
concept
• Capacity flexibility – the ability to rapidly
increase or decrease product levels or the ability
to shift rapidly from one product or service to
another
– Comes from the plant, processes, and workers or
from strategies that use the capacity of other
organizations
Capacity Planning: Balance
Stage 1 Stage 2 Stage 3
Units
per
month
6,000 7,000 5,000
Unbalanced stages of production
Stage 1 Stage 2 Stage 3
Units
per
month
6,000 6,000 6,000
Balanced stages of production
Maintaining System Balance: Output of one stage is
the exact input requirements for the next stage
5-13
Determining Capacity Requirements
1. Forecast sales within each
individual product line
2. Calculate equipment and labor
requirements to meet the forecasts
3. Project equipment and labor
availability over the planning
horizon
5-14
Example of Capacity Requirements
A manufacturer produces two lines of mustard,
FancyFine and Generic line. Each is sold in
small and family-size plastic bottles.
The following table shows forecast demand for
the next four years.
Year: 1 2 3 4
FancyFine
Small (000s) 50 60 80 100
Family (000s) 35 50 70 90
Generic
Small (000s) 100 110 120 140
Family (000s) 80 90 100 110
5-15
Example of Capacity Requirements (Continued): Product from a Capacity
Viewpoint
• Question: Are we really producing
two different types of mustards
from the standpoint of capacity
requirements?
• Answer: No, it’s the same product
just packaged differently.
5-16
Example of Capacity Requirements (Continued) : Equipment and Labor
Requirements
Year: 1 2 3 4
Small (000s) 150 170 200 240
Family (000s) 115 140 170 200
•Three 100,000 units-per-year machines are available
for small-bottle production. Two operators required
per machine.
•Two 120,000 units-per-year machines are available for
family-sized-bottle production. Three operators
required per machine.
5-17
5–18
Copyright
©
2014
by
McGraw
Hill
Education
(India)
Private
Limited.
All
rights
reserved.
5–19
Copyright
©
2014
by
McGraw
Hill
Education
(India)
Private
Limited.
All
rights
reserved.
• The relationship between service capacity
utilization and service quality is critical.
– Utilization is measured by the portion of time
servers are busy.
• Optimal levels of utilization are context specific.
– Low rates are appropriate when the degree of
uncertainty (in demand) is high and/or the stakes
are high (e.g., emergency rooms, fire departments).
– Higher rates are possible for predictable services or
those without extensive customer contact (e.g.,
commuter trains, postal sorting).
5–20
Copyright
©
2014
by
McGraw
Hill
Education
(India)
Private
Limited.
All
rights
reserved.
• Rate of service utilization and service quality
are directly linked.
Arrivals exceed
services – many
customers are never
served
Sufficient capacity to
provide quality
service
Service quality
declines – disruptions
or high arrival levels
lead to long wait times
Capacity Utilization &
Service Quality
• Best operating point is near 70%
of capacity
• From 70% to 100% of service
capacity, what do you think
happens to service quality?
5-21
1-22
End of Chapter 5
5-22

capacity management in operations management

  • 1.
  • 2.
  • 3.
    • Strategic CapacityPlanning Defined • Capacity Utilization & Best Operating Level • Economies & Diseconomies of Scale • The Experience Curve • Capacity Focus, Flexibility & Planning • Determining Capacity Requirements • Capacity Utilization & Service Quality OBJECTIVES 5-3
  • 4.
    Strategic Capacity Planning •Capacity can be defined as the ability to hold, receive, store, or accommodate • Strategic capacity planning is an approach for determining the overall capacity level of capital intensive resources, including facilities, equipment, and overall labor force size 5-4
  • 5.
    Capacity Utilization • Where •Capacity used – rate of output actually achieved • Best operating level – capacity for which the process was designed level operating Best used Capacity rate n utilizatio Capacity  5-5
  • 6.
    5–6 Copyright © 2014 by McGraw Hill Education (India) Private Limited. All rights reserved. • Capacity utilizationrate – a measure of how close the firm is to its best possible operating level • Economies of scale – the idea that as a planet gets larger and volume increases, the average cost per unit tends to drop • Diseconomies of scale – at some point, the plant becomes too large and average cost per unit begins to increase
  • 7.
  • 8.
    Best Operating Level Example:Engineers design engines and assembly lines to operate at an ideal or “best operating level” to maximize output and minimize ware Underutilization Best Operating Level Average unit cost of output Volume Overutilization 5-8
  • 9.
    Example of CapacityUtilization • During one week of production, a plant produced 83 units of a product. Its historic highest or best utilization recorded was 120 units per week. What is this plant’s capacity utilization rate?  Answer: Capacity utilization rate = Capacity used Best operating level = 83/120 =0.69 or 69% 5-9
  • 10.
    Economies & Diseconomiesof Scale 100-unit plant 200-unit plant 300-unit plant 400-unit plant Volume Average unit cost of output Economies of Scale and the Learning Curve working Diseconomies of Scale start working 5-10
  • 11.
    The Learning Curve Asplants produce more products, they gain experience in the best production methods and reduce their costs per unit Total accumulated production of units Cost or price per unit Yesterday Today Tomorrow 5-11
  • 12.
    5–12 Copyright © 2014 by McGraw Hill Education (India) Private Limited. All rights reserved. • Capacity focus– the idea that a production facility works best when it is concentrated on a limited set of production objectives – Focused factory or plant within a plant (PWP) concept • Capacity flexibility – the ability to rapidly increase or decrease product levels or the ability to shift rapidly from one product or service to another – Comes from the plant, processes, and workers or from strategies that use the capacity of other organizations
  • 13.
    Capacity Planning: Balance Stage1 Stage 2 Stage 3 Units per month 6,000 7,000 5,000 Unbalanced stages of production Stage 1 Stage 2 Stage 3 Units per month 6,000 6,000 6,000 Balanced stages of production Maintaining System Balance: Output of one stage is the exact input requirements for the next stage 5-13
  • 14.
    Determining Capacity Requirements 1.Forecast sales within each individual product line 2. Calculate equipment and labor requirements to meet the forecasts 3. Project equipment and labor availability over the planning horizon 5-14
  • 15.
    Example of CapacityRequirements A manufacturer produces two lines of mustard, FancyFine and Generic line. Each is sold in small and family-size plastic bottles. The following table shows forecast demand for the next four years. Year: 1 2 3 4 FancyFine Small (000s) 50 60 80 100 Family (000s) 35 50 70 90 Generic Small (000s) 100 110 120 140 Family (000s) 80 90 100 110 5-15
  • 16.
    Example of CapacityRequirements (Continued): Product from a Capacity Viewpoint • Question: Are we really producing two different types of mustards from the standpoint of capacity requirements? • Answer: No, it’s the same product just packaged differently. 5-16
  • 17.
    Example of CapacityRequirements (Continued) : Equipment and Labor Requirements Year: 1 2 3 4 Small (000s) 150 170 200 240 Family (000s) 115 140 170 200 •Three 100,000 units-per-year machines are available for small-bottle production. Two operators required per machine. •Two 120,000 units-per-year machines are available for family-sized-bottle production. Three operators required per machine. 5-17
  • 18.
  • 19.
    5–19 Copyright © 2014 by McGraw Hill Education (India) Private Limited. All rights reserved. • The relationshipbetween service capacity utilization and service quality is critical. – Utilization is measured by the portion of time servers are busy. • Optimal levels of utilization are context specific. – Low rates are appropriate when the degree of uncertainty (in demand) is high and/or the stakes are high (e.g., emergency rooms, fire departments). – Higher rates are possible for predictable services or those without extensive customer contact (e.g., commuter trains, postal sorting).
  • 20.
    5–20 Copyright © 2014 by McGraw Hill Education (India) Private Limited. All rights reserved. • Rate ofservice utilization and service quality are directly linked. Arrivals exceed services – many customers are never served Sufficient capacity to provide quality service Service quality declines – disruptions or high arrival levels lead to long wait times
  • 21.
    Capacity Utilization & ServiceQuality • Best operating point is near 70% of capacity • From 70% to 100% of service capacity, what do you think happens to service quality? 5-21
  • 22.