Downloaded 108 times


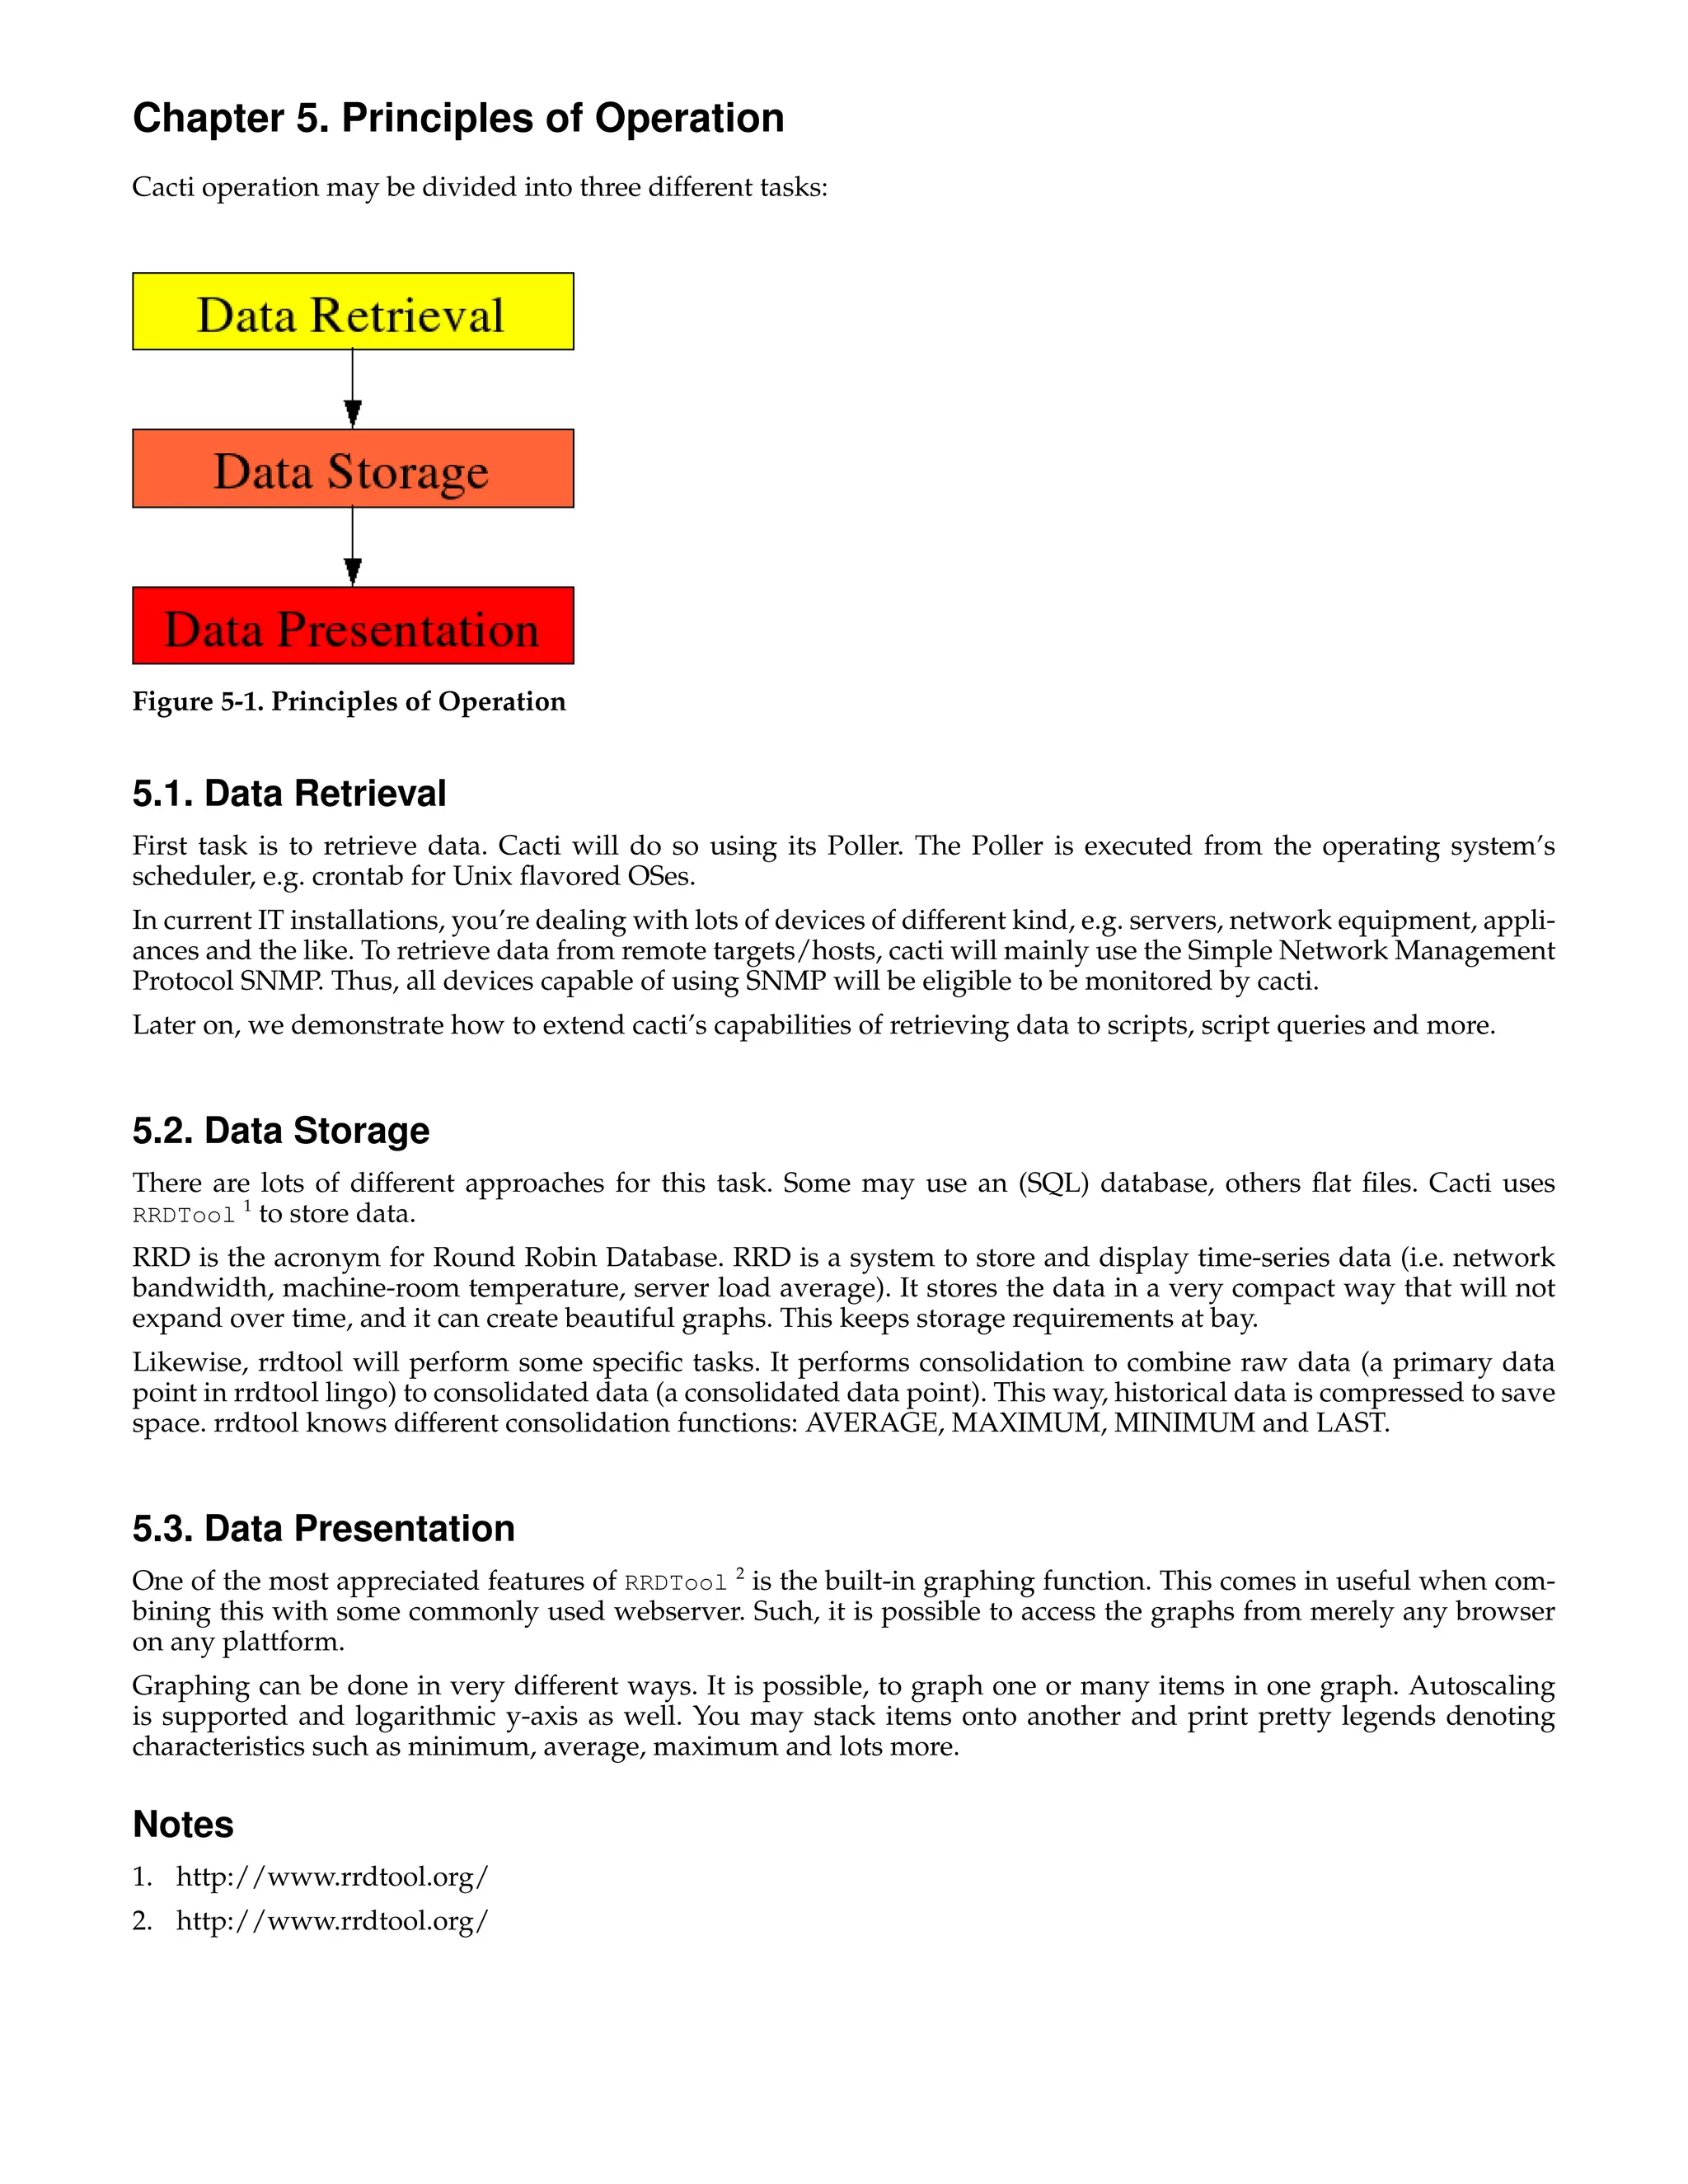

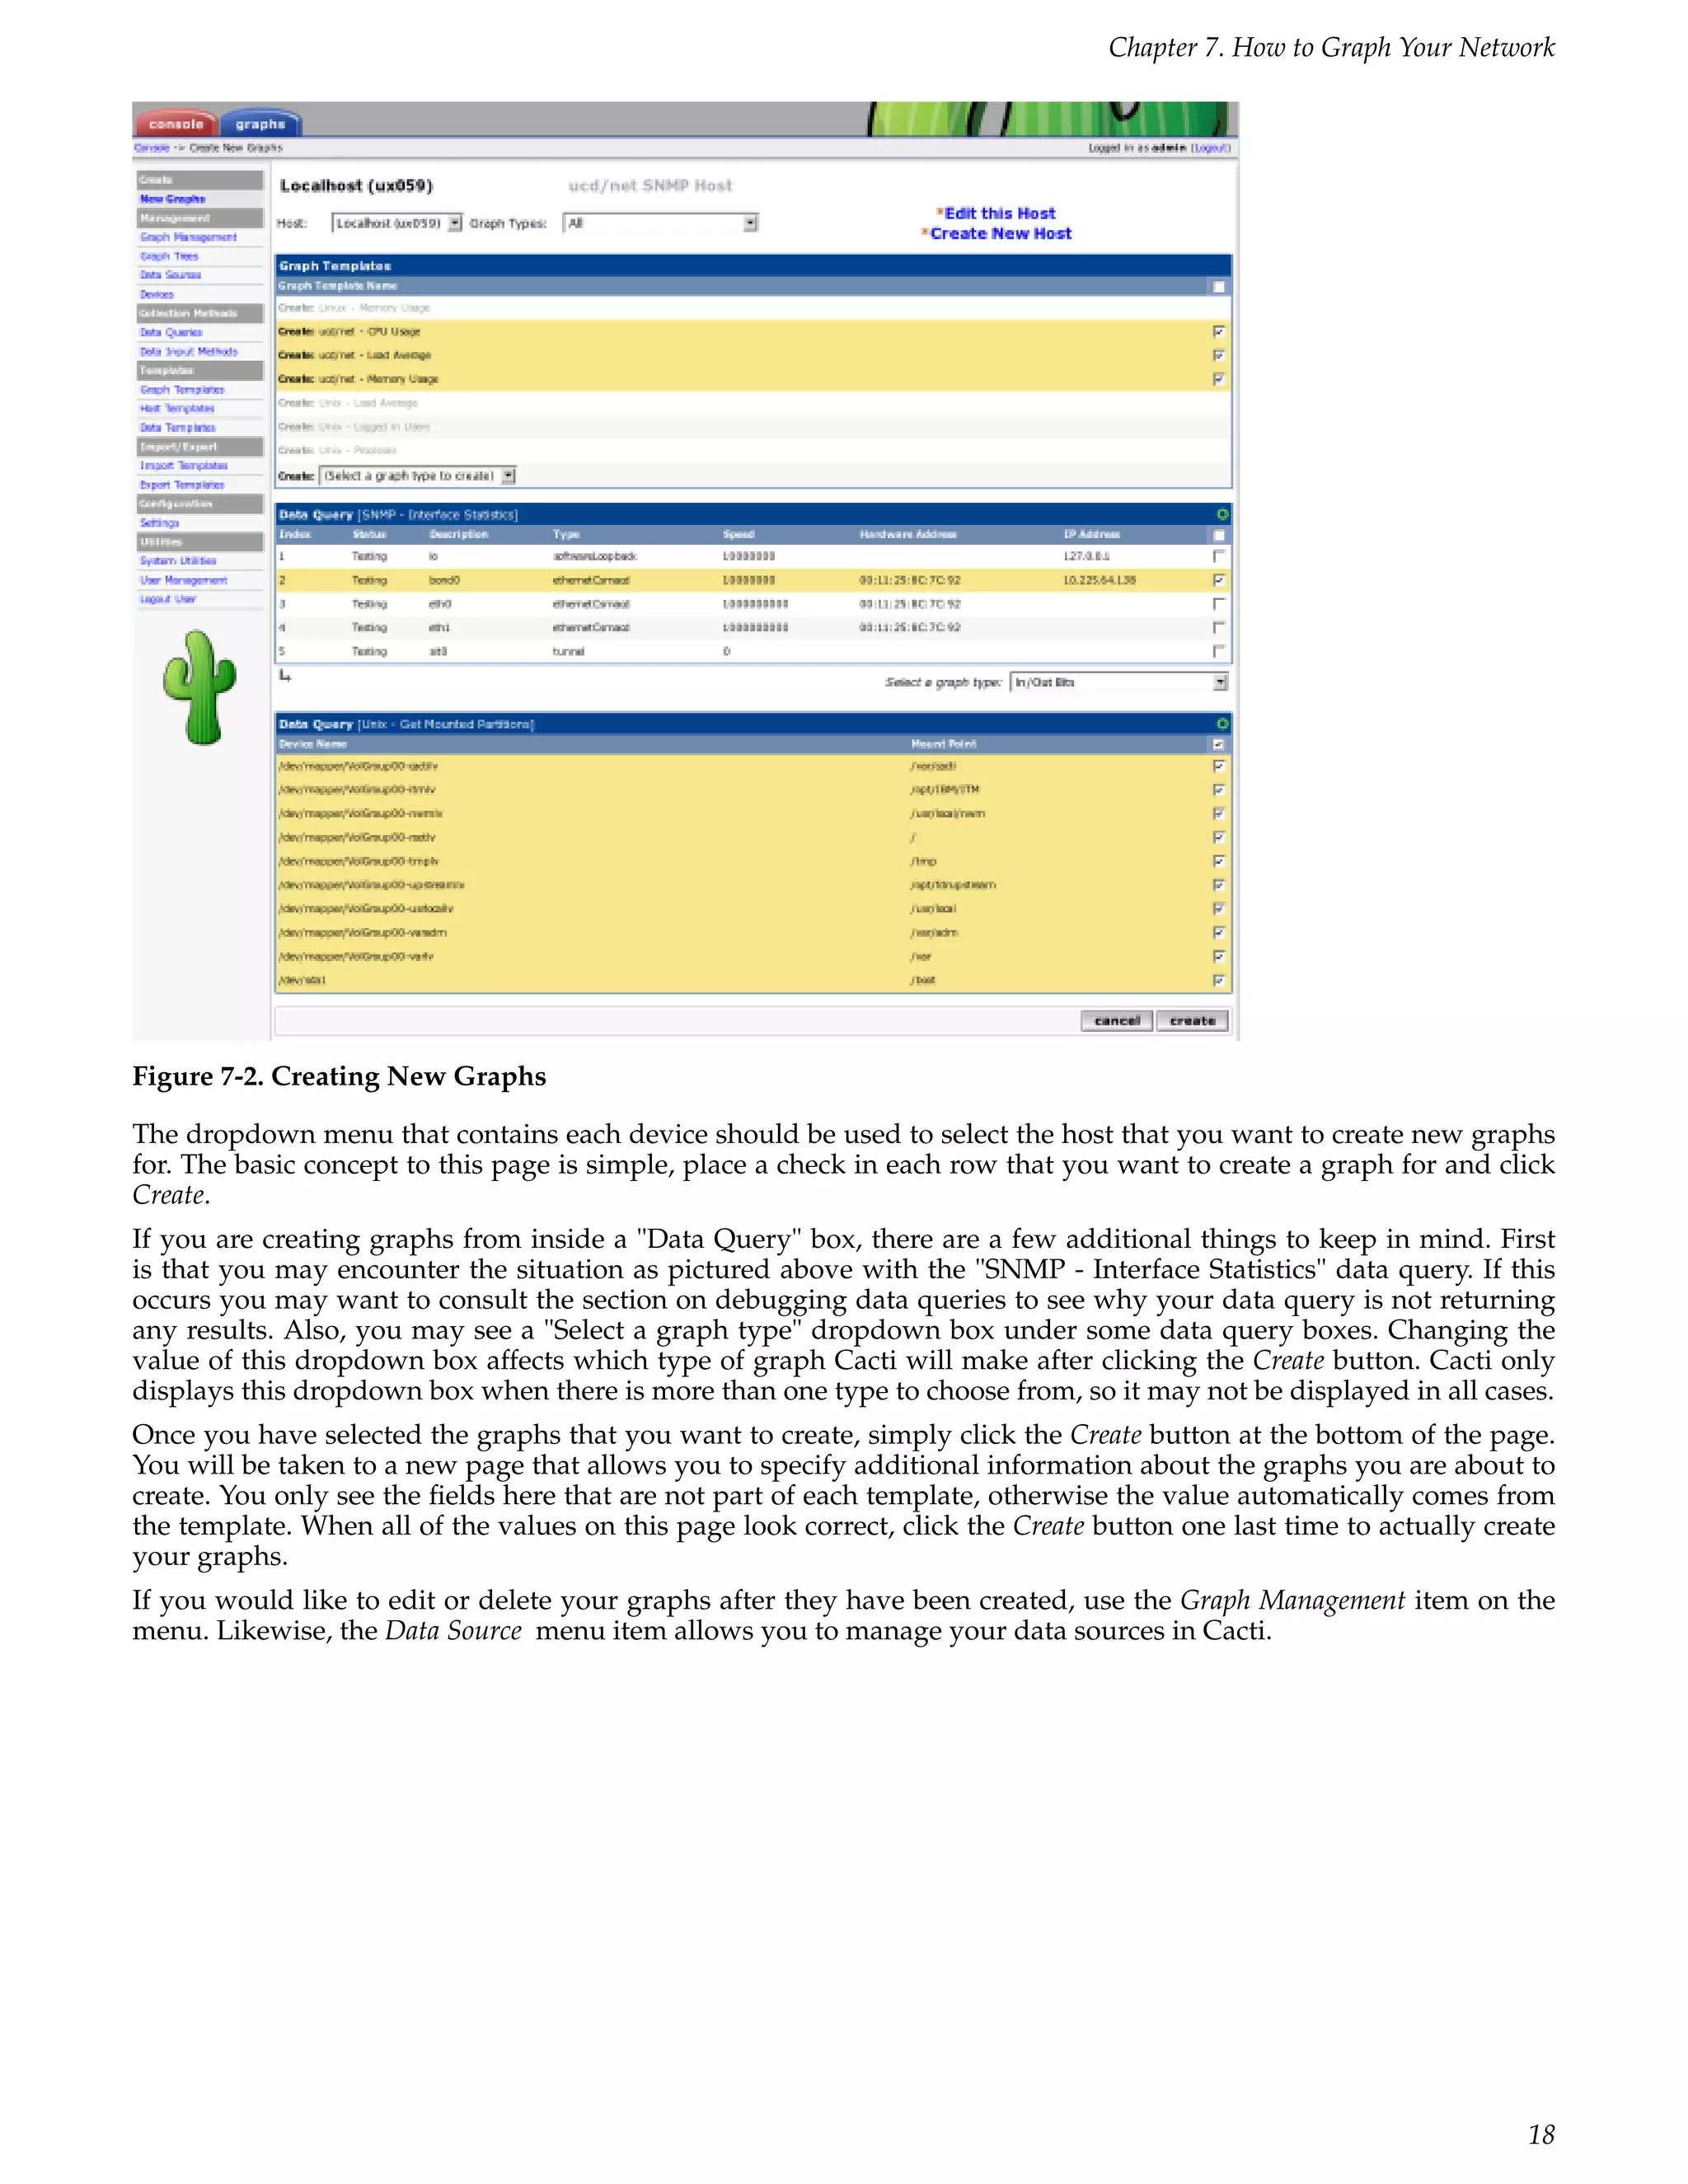
![Chapter 7. How to Graph Your Network
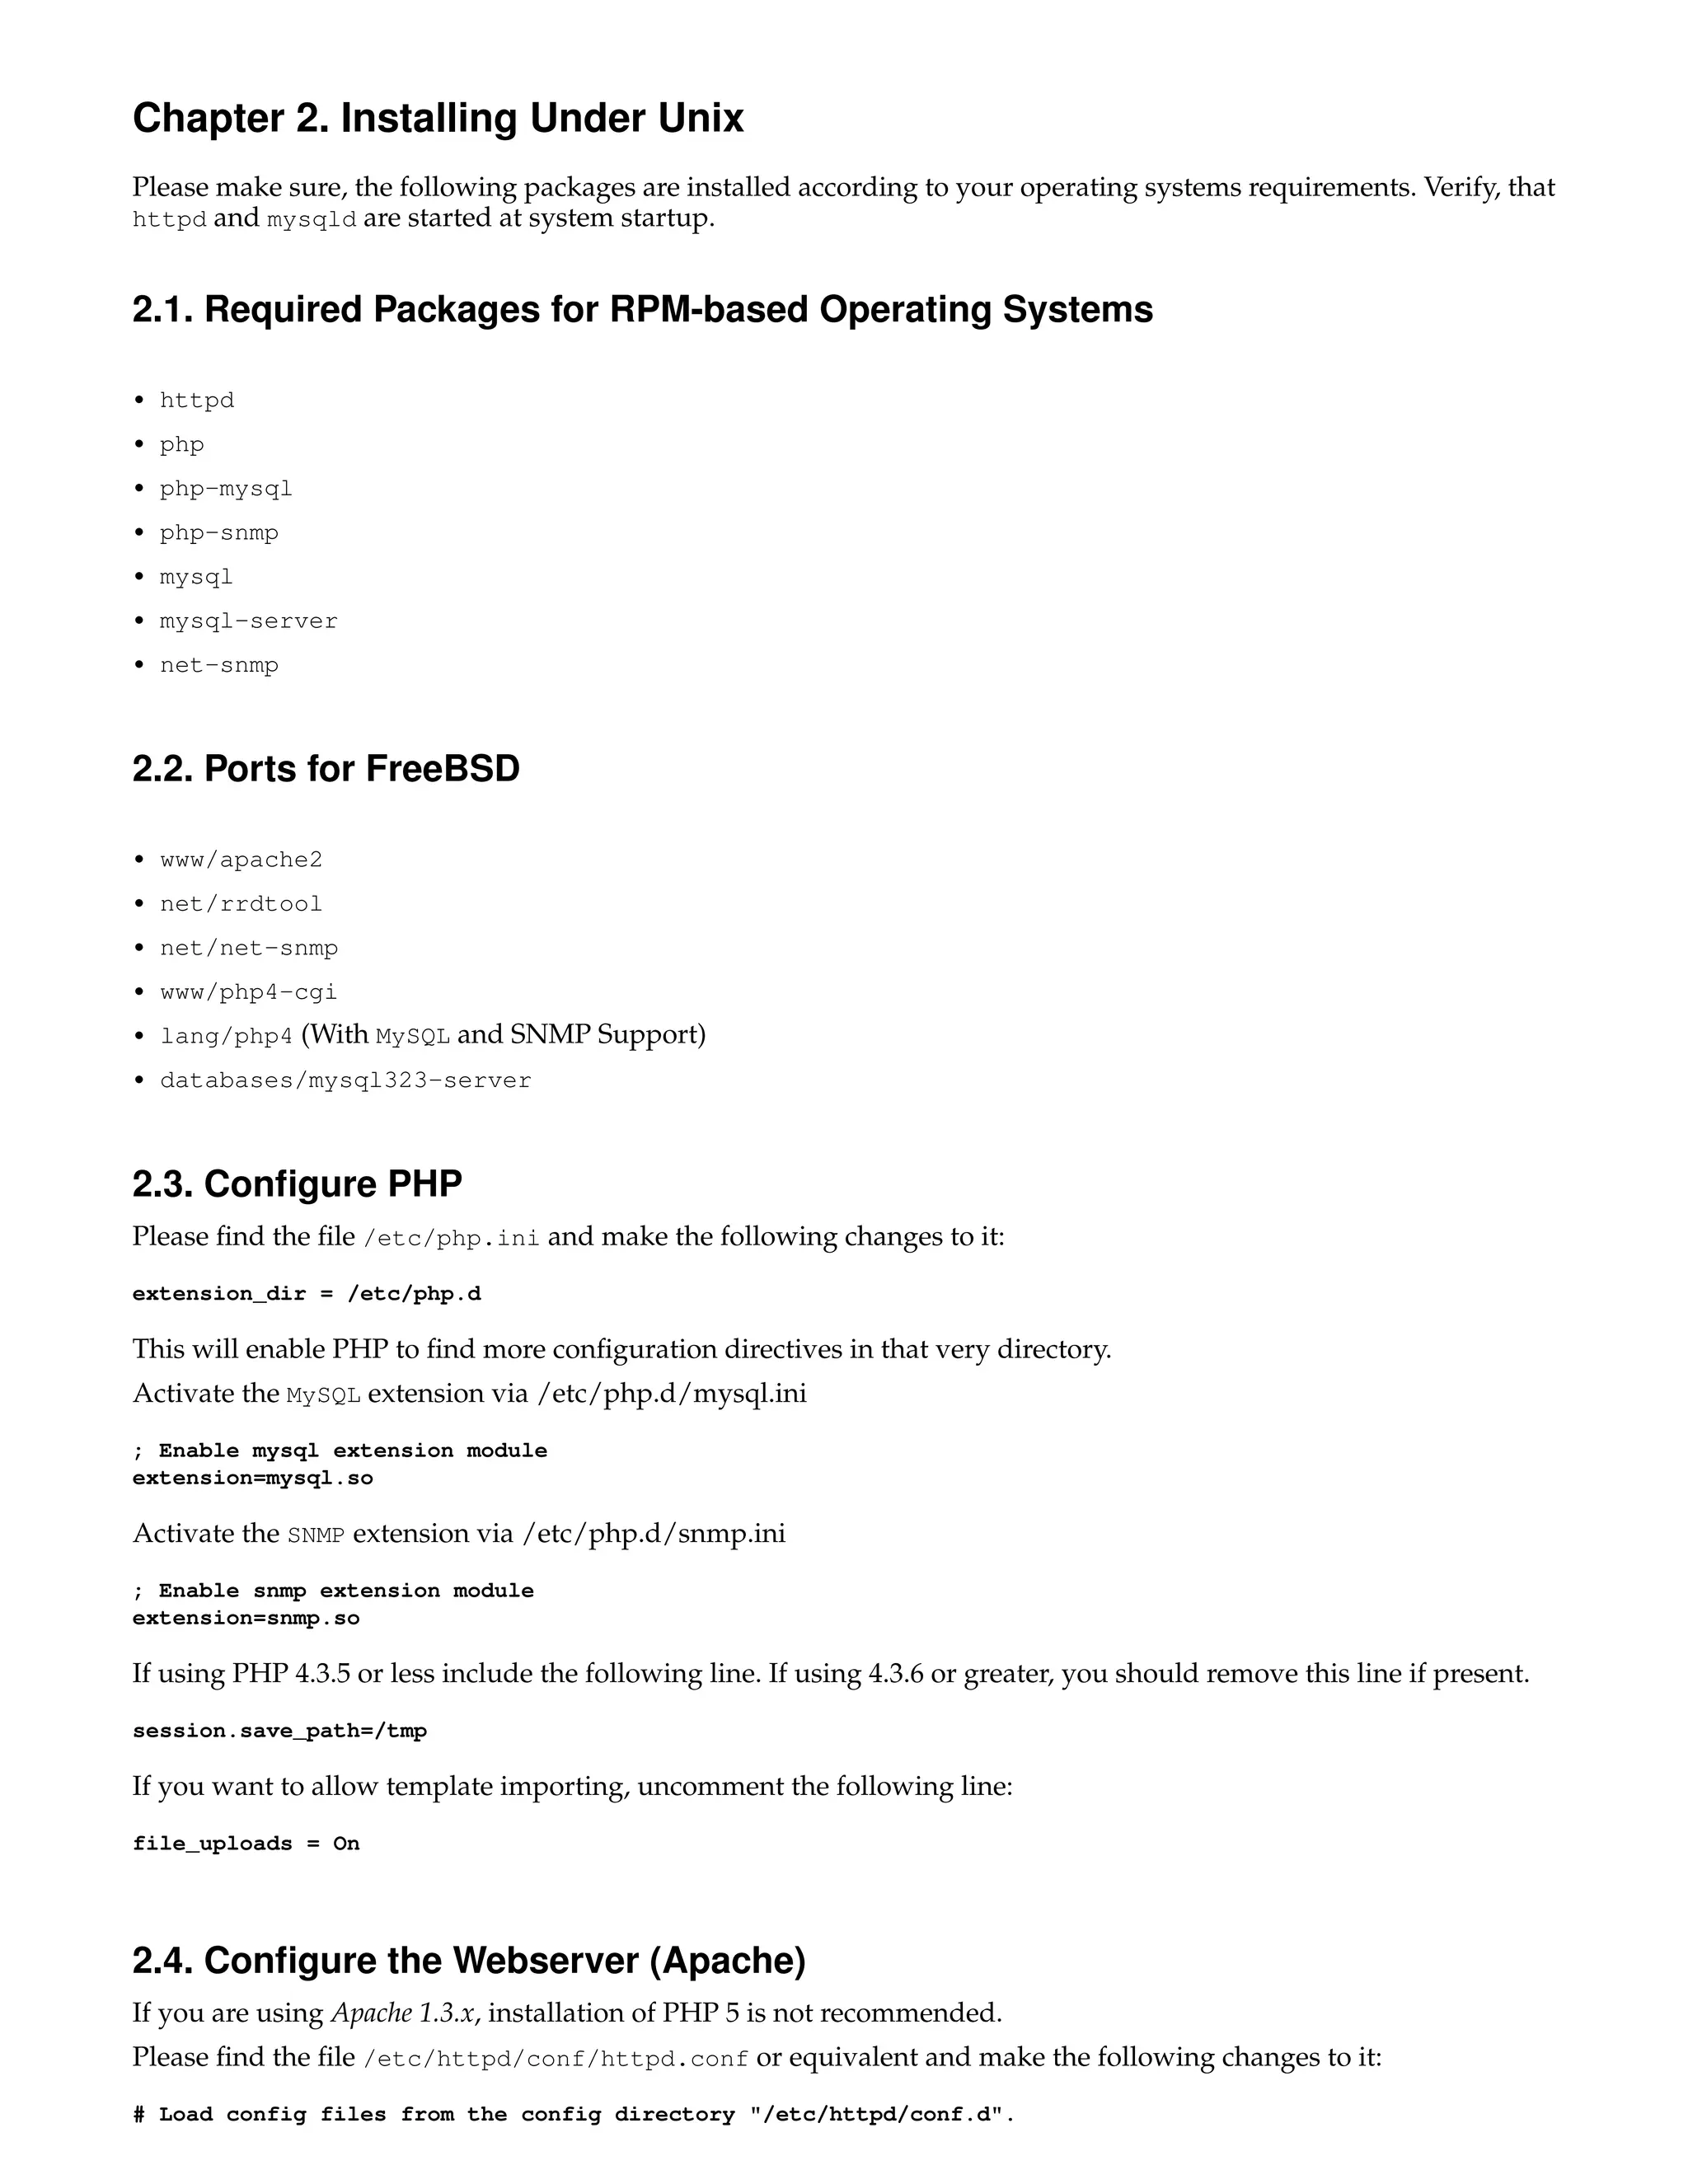
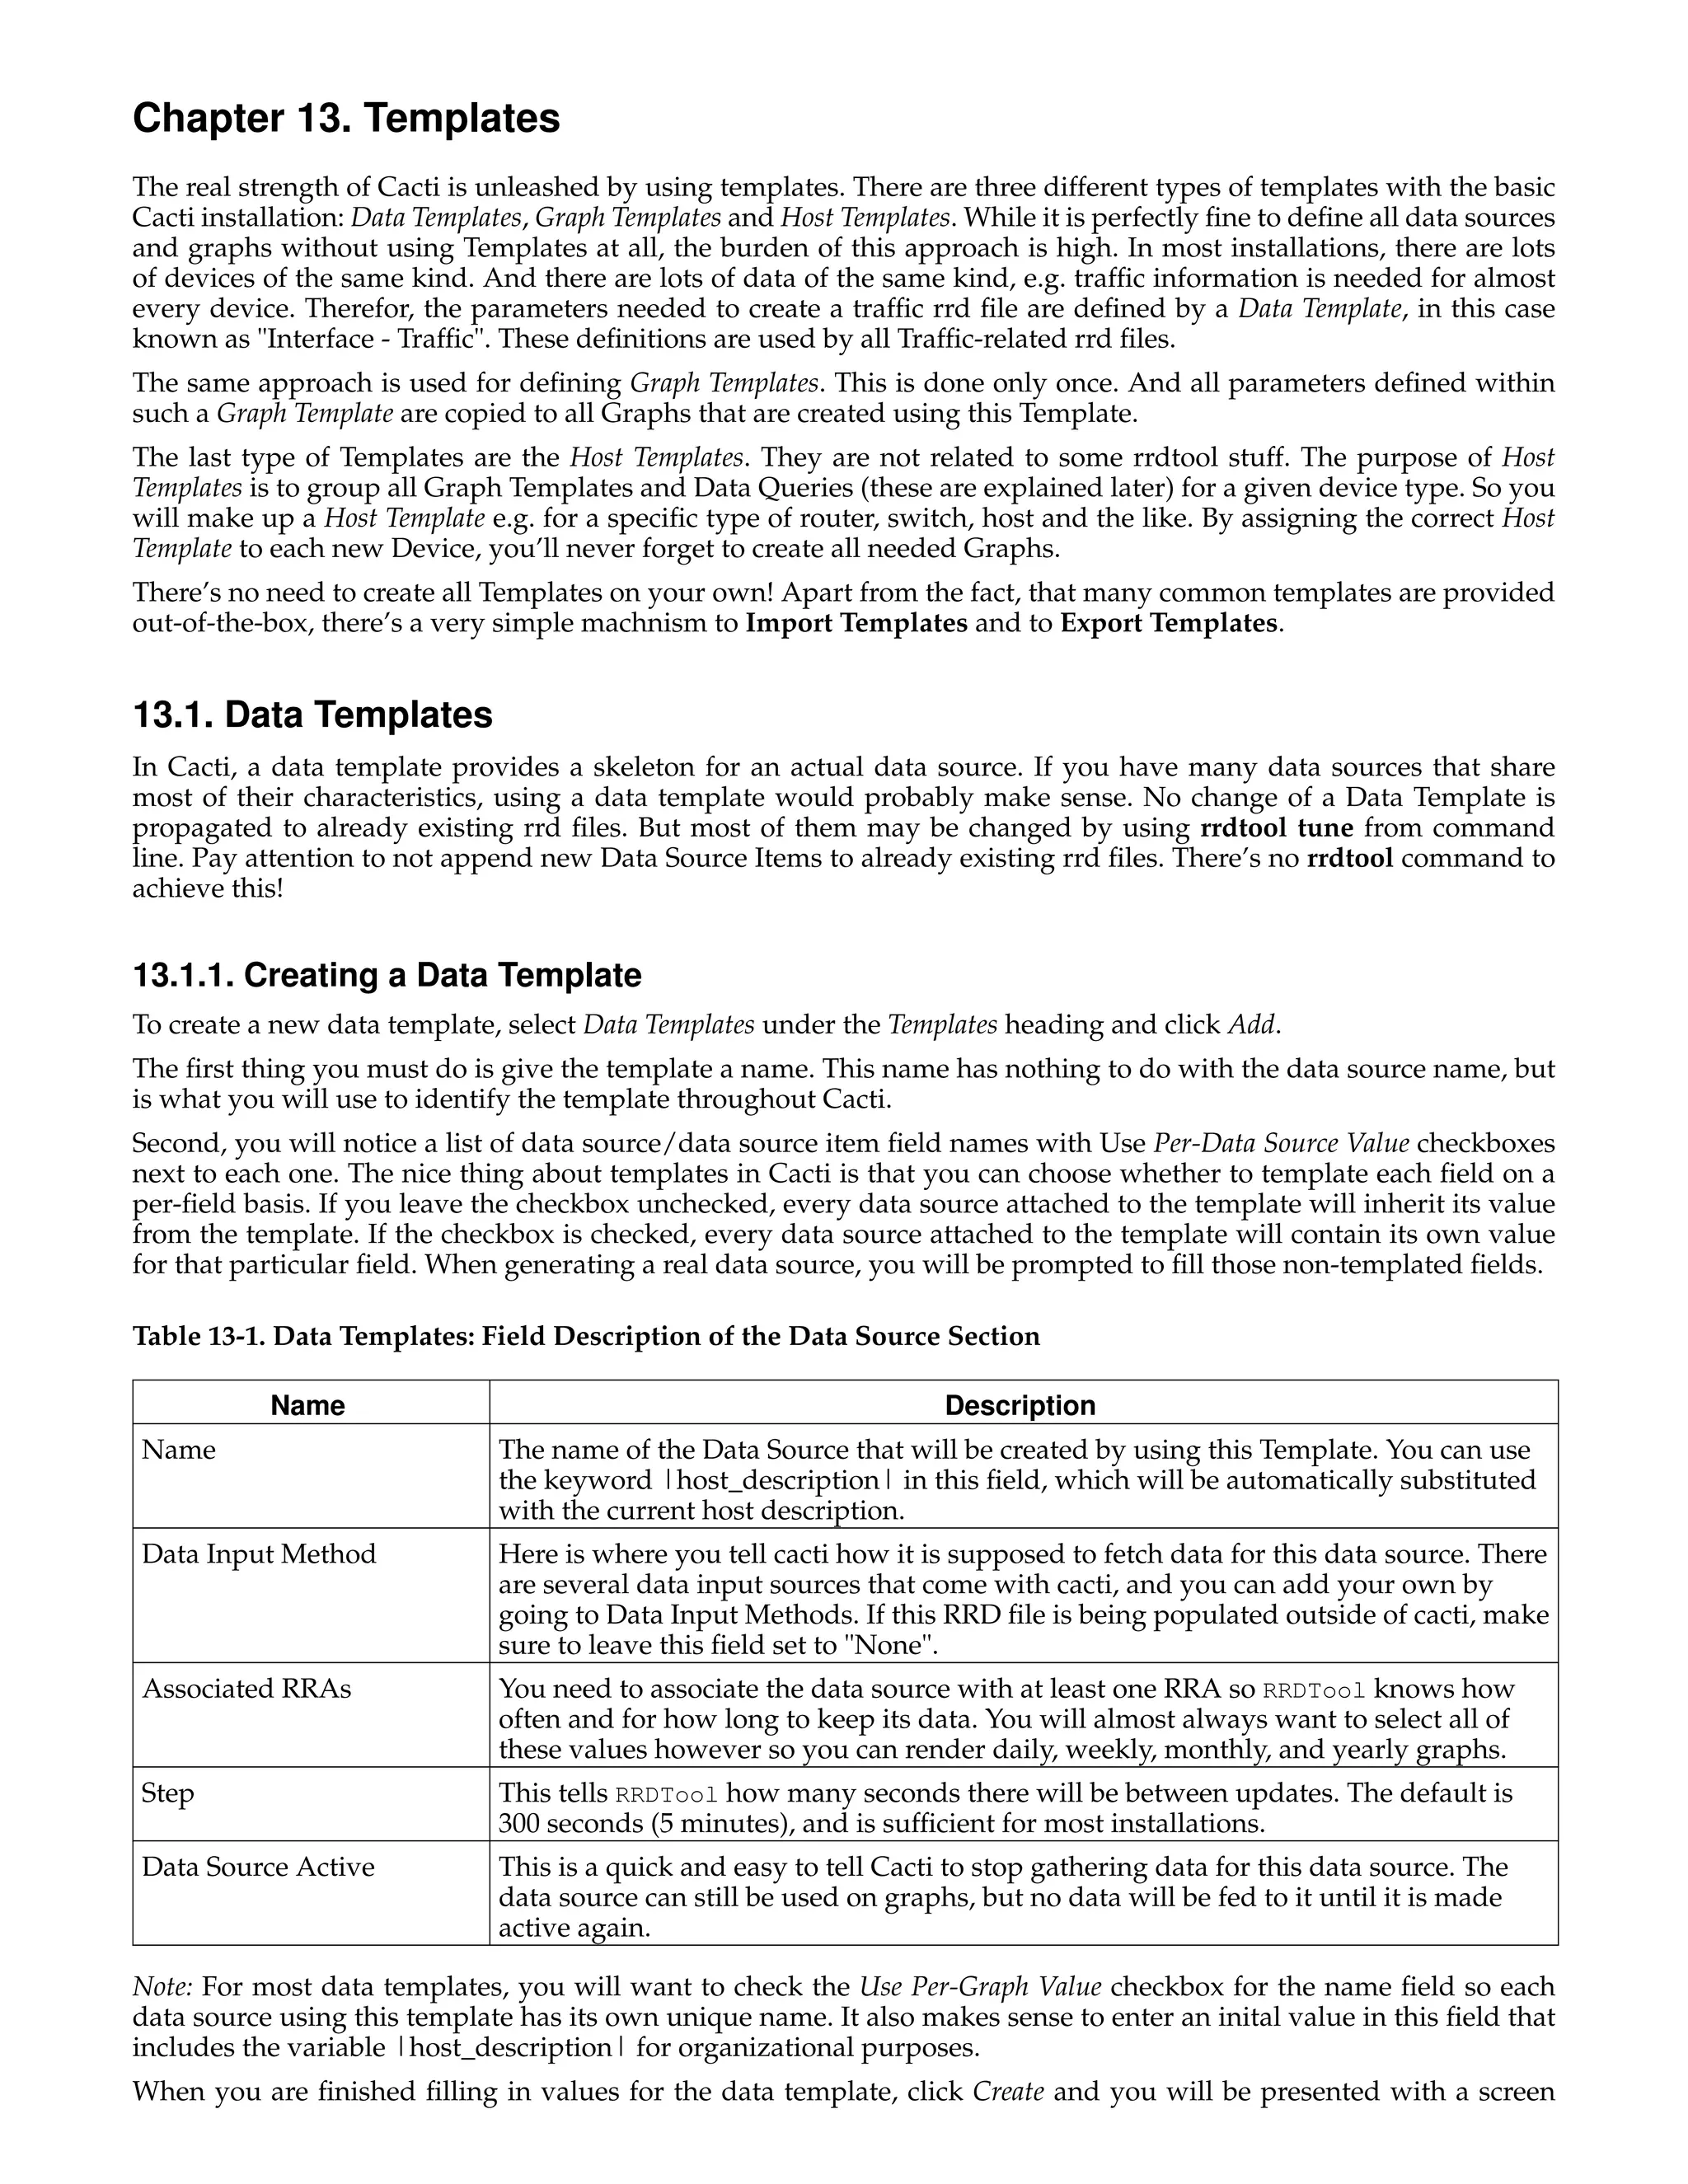
Field Description
SNMP Username The username of an SNMP V3 createUser statement or equivalent
SNMP Password The authpassphrase of an SNMP V3 createUser statement or equivalent
SNMP Auth Protocol The authentication type of an SNMP V3 createUser statement or equivalent.
Select either MD5 or SHA. This entry defaults to MD5.
SNMP Privacy Passphrase The privacy passphrase of an SNMP V3 createUser statement or equivalent.
SNMP Privacy Protocol The privacy protocol of an SNMP V3 createUser statement or equivalent. Select
either DES or AES. This entry defaults to DES.
SNMP Context When using the View-Based Access Control Model (VACM), it is possible to specify an
SNMP Context when mapping a community name to a security name with a com2sec
directive, with the group directive and the access directive. This allows for defining
special access models. If using such a parameter with your target’s SNMP
configuration, specify the context name to be used to access that target here.
After saving your new device, you should be redirected back to the same edit form with some additional information.
If you configured SNMP for this host by providing a valid community string, you should see various statistics listed at
the top of the page. If you see "SNMP error" instead, this indicates an SNMP problem between Cacti and your device.
Towards the bottom of the page there will be two addition boxes, Associated Data Queries, and Associated Graph Tem-
plates. If you selected a host template on the previous page, there will probably be a few items in each box. If there is
nothing listed in either box, you will need to associate at least one data query or graph template with your new device
or you will not be able to create graphs in the next step. If no available graph template or data query applies to your
device, you can check the Cacti templates repository or create your own if nothing currently exists.
7.1.1. A Word About SNMP
The SNMP version that you choose can have a great effect on how SNMP works for you in Cacti. Version 1 should be
used for everything unless you have reason to choose otherwise. If you plan on utilizing (and your device supports)
high-speed (64-bit) counters, you must select version 2. Starting with Cacti 0.8.7, version 3 is fully implemented.
The way in which Cacti retrieves SNMP information from a host has an effect on which SNMP-related options are
supported. Currently there are three types of SNMP retrieval methods in Cacti and are outlined below.
Table 7-2. SNMP Retrieval Types
Type Description Supported Options Places Used
External SNMP Calls the net-snmp All SNMP options Web interface and PHP
snmpwalk and snmpget poller (poller.php)
binaries that are installed
on your system.
Internal SNMP (php-snmp) Uses PHP’s SNMP Version 1 Only Web interface and PHP
functions which are linked (Community and Port) poller (poller.php)
against net-snmp or
ucd-snmp at compile time.
Spine SNMP Links directly against All SNMP options C-Based Poller (Spine)
net-snmp or ucd-snmp and
calls the API directly.
7.1.2. SNMP V3 Options Explained
SNMP supports authentication and encryption features when using SNMP protocol version 3 known as View-Based
Access Control Model (VACM). This requires, that the target device in question supports and is configured for SNMP
V3 use. In general, configuration of V3 options is target type dependant. The following is cited from man snmpd.conf
concerning user definitions
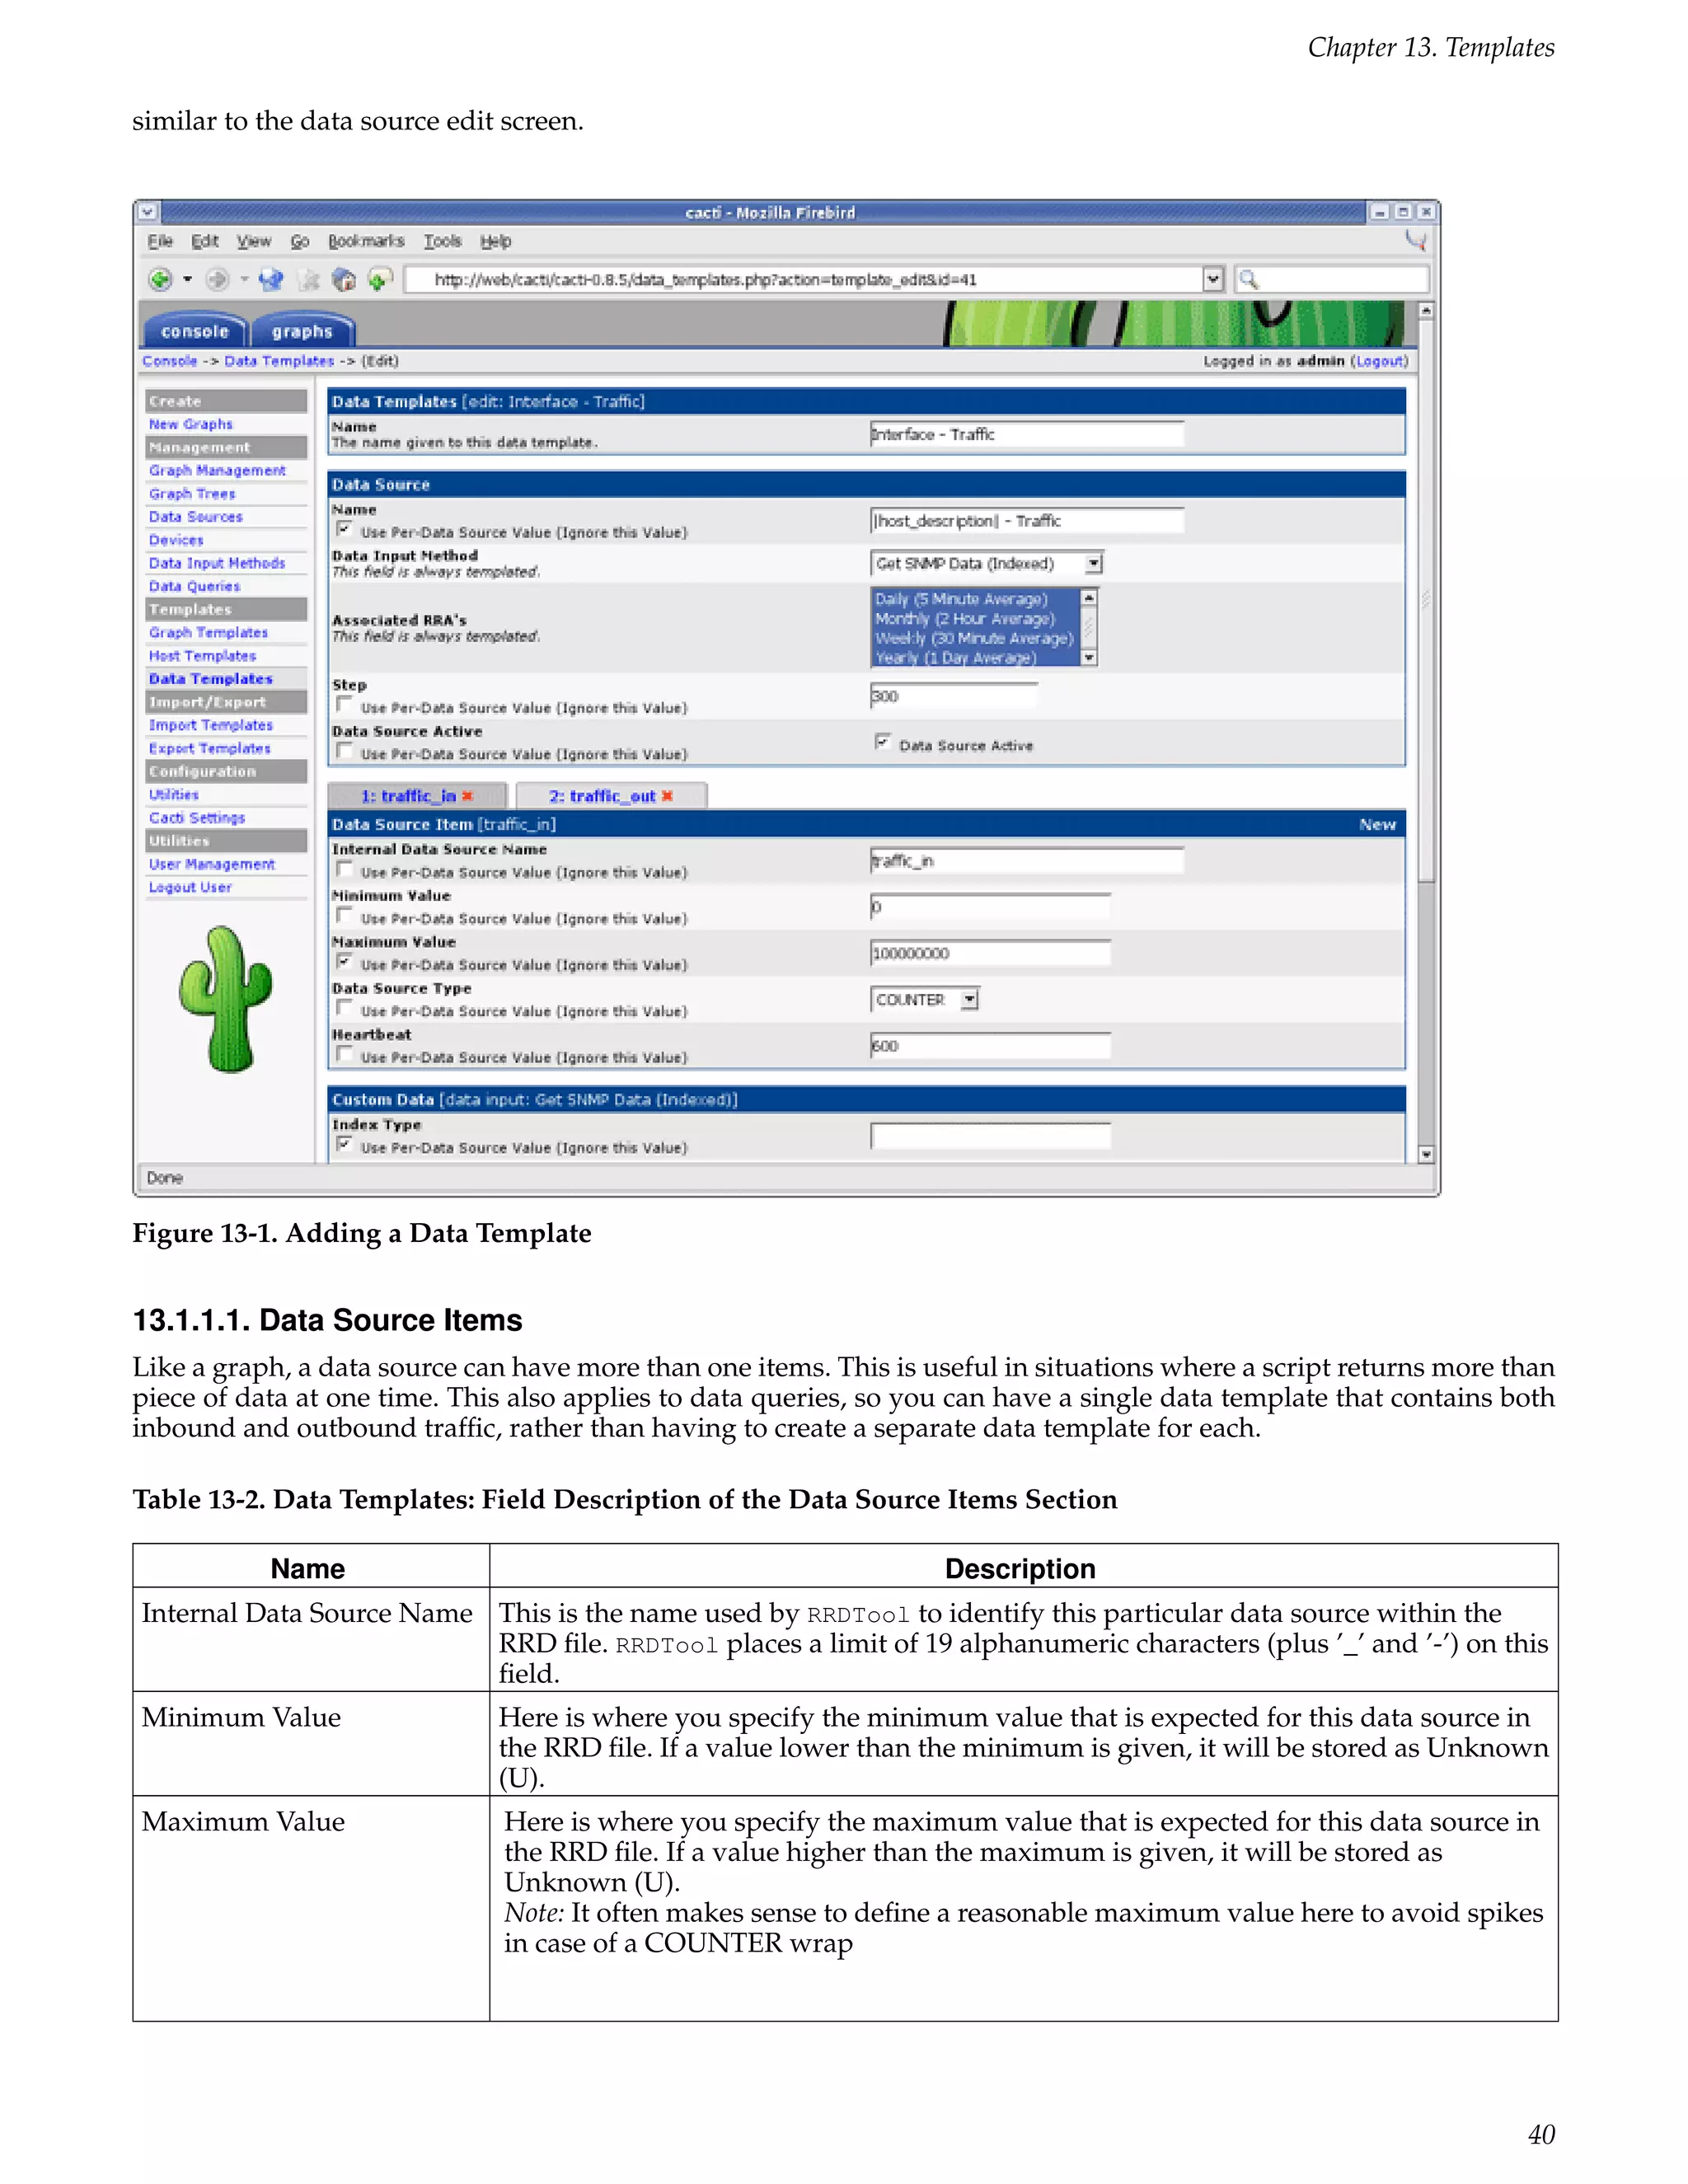
[ SNMPv3 Users
createUser [-e ENGINEID] username (MD5|SHA) authpassphrase [DES|AES] [privpassphrase]
MD5 and SHA are the authentication types to use. DES and AES are the privacy
protocols to use. If the privacy passphrase is not specified, it is assumed
to be the same as the authentication passphrase. Note that the users created will
15](https://image.slidesharecdn.com/cactimanual-121101075848-phpapp01/75/Cacti-manual-20-2048.jpg)
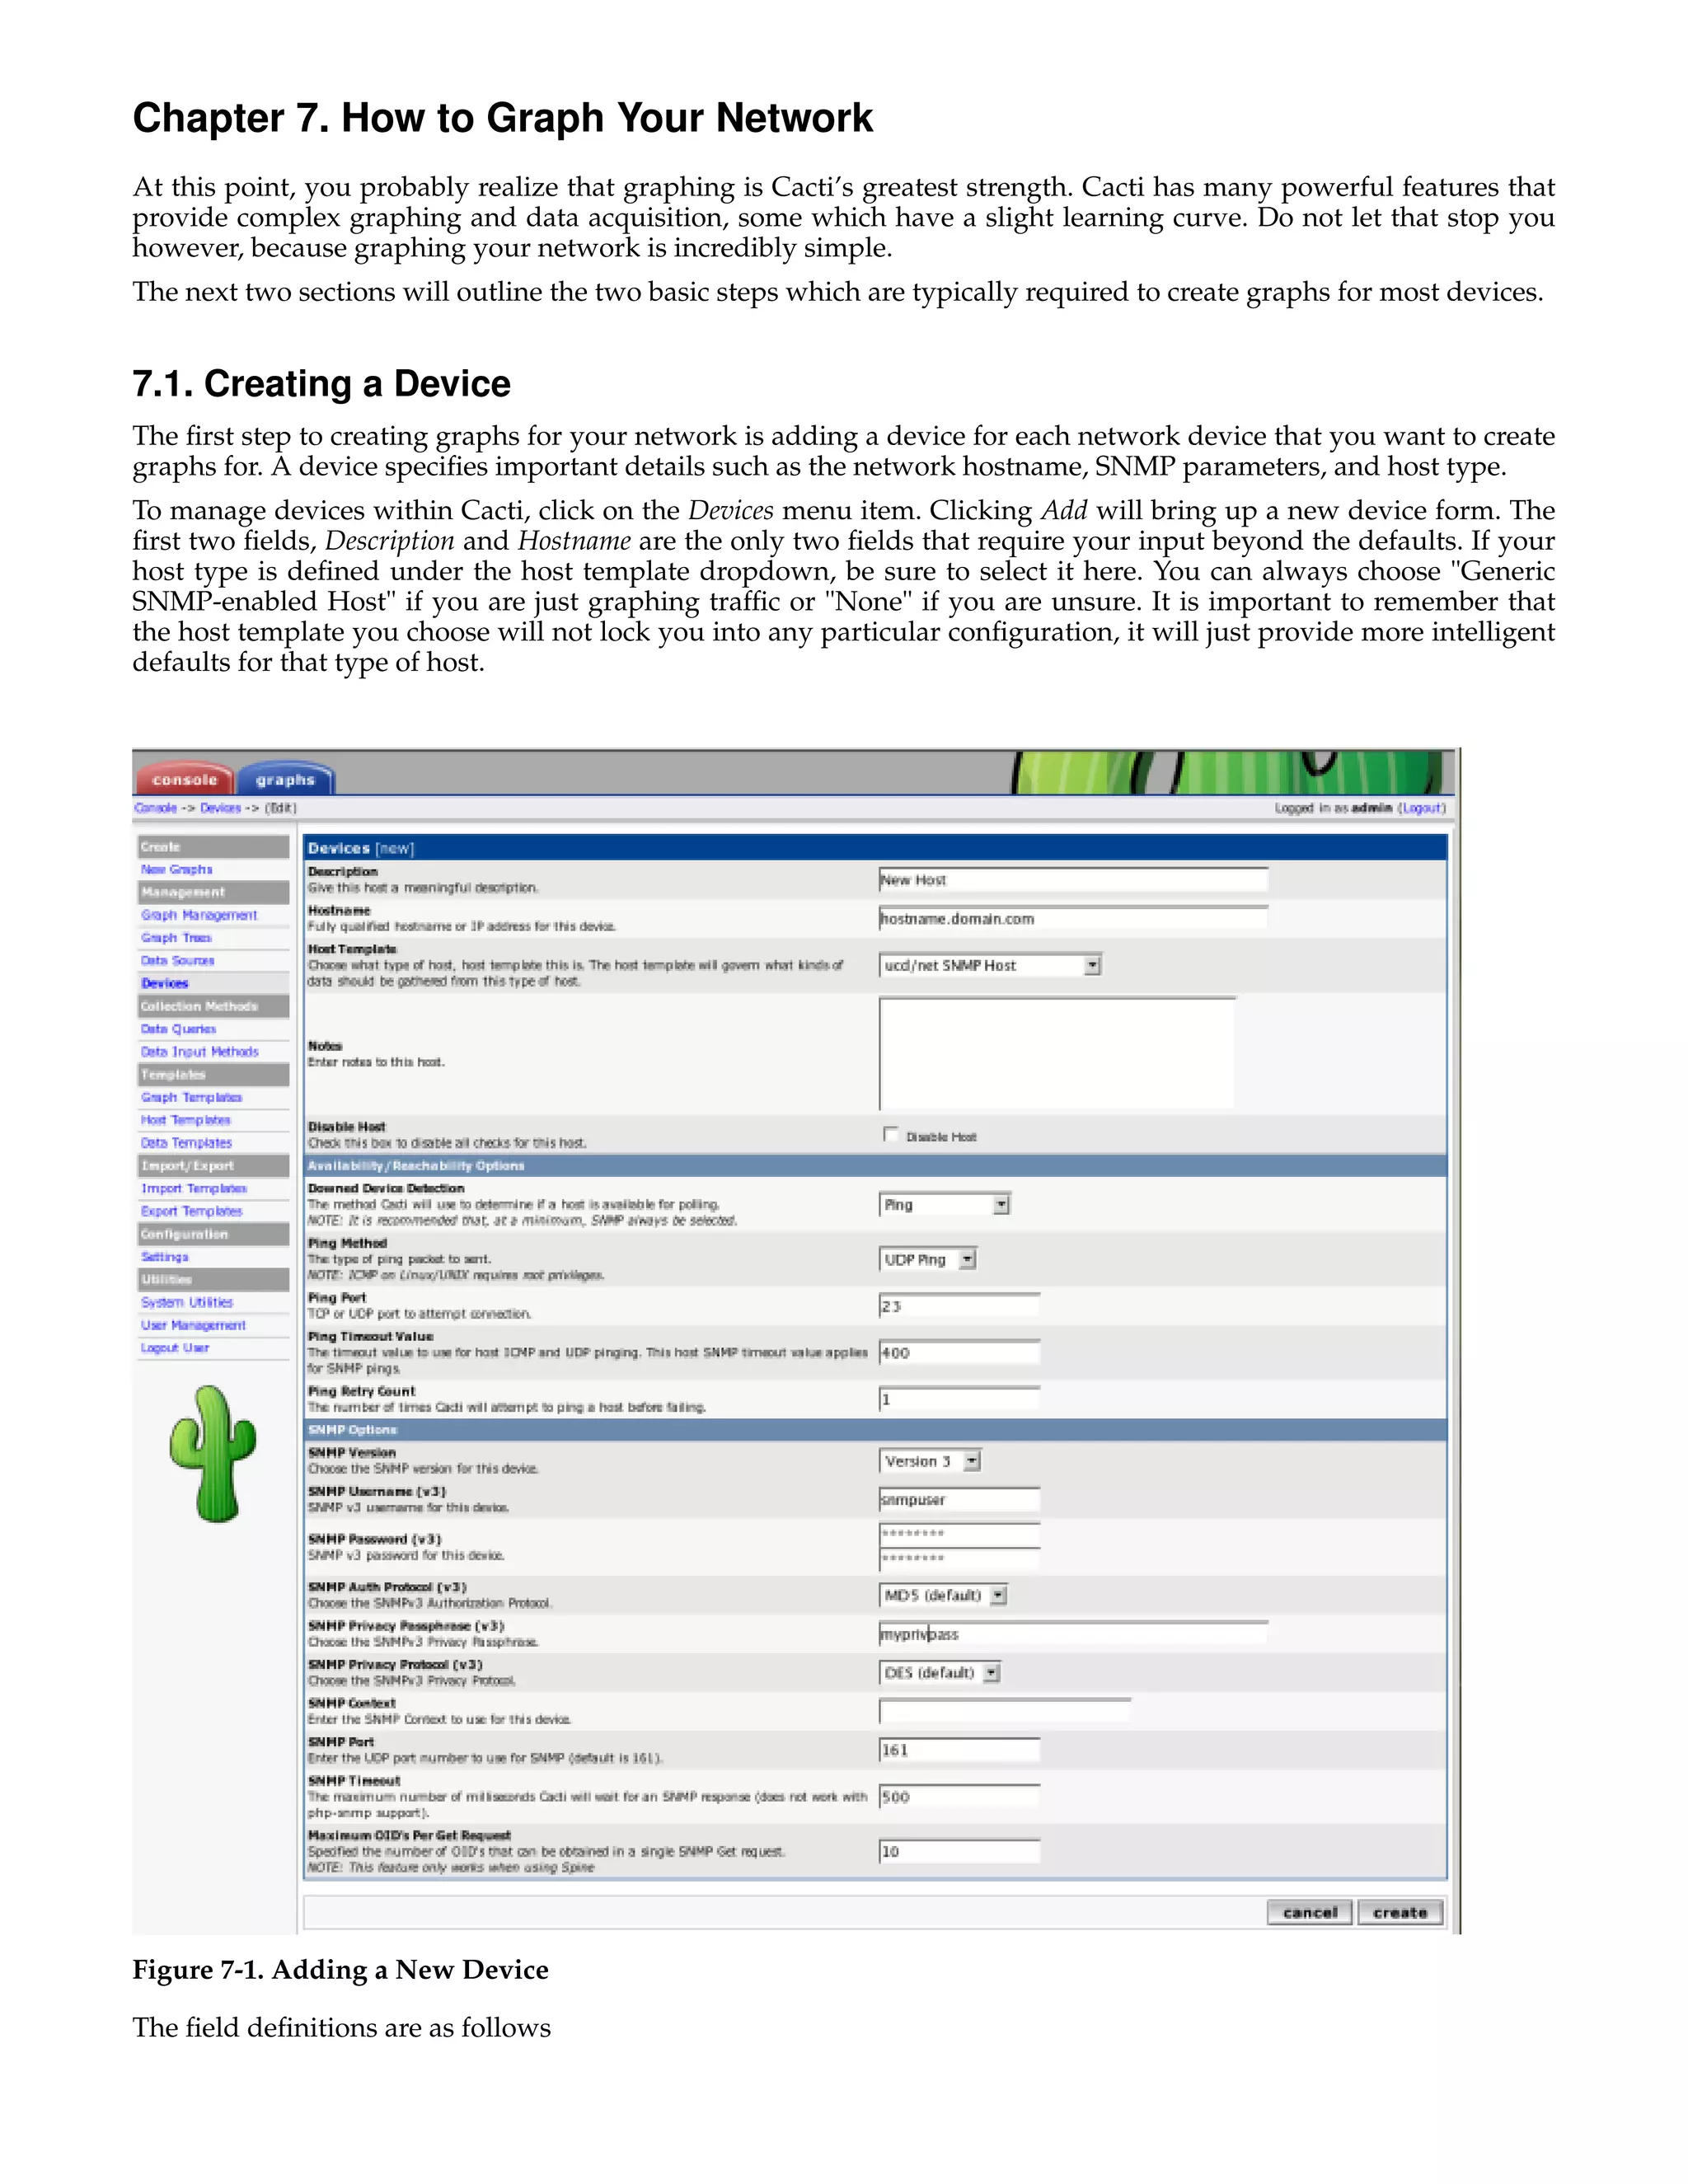
![Chapter 7. How to Graph Your Network
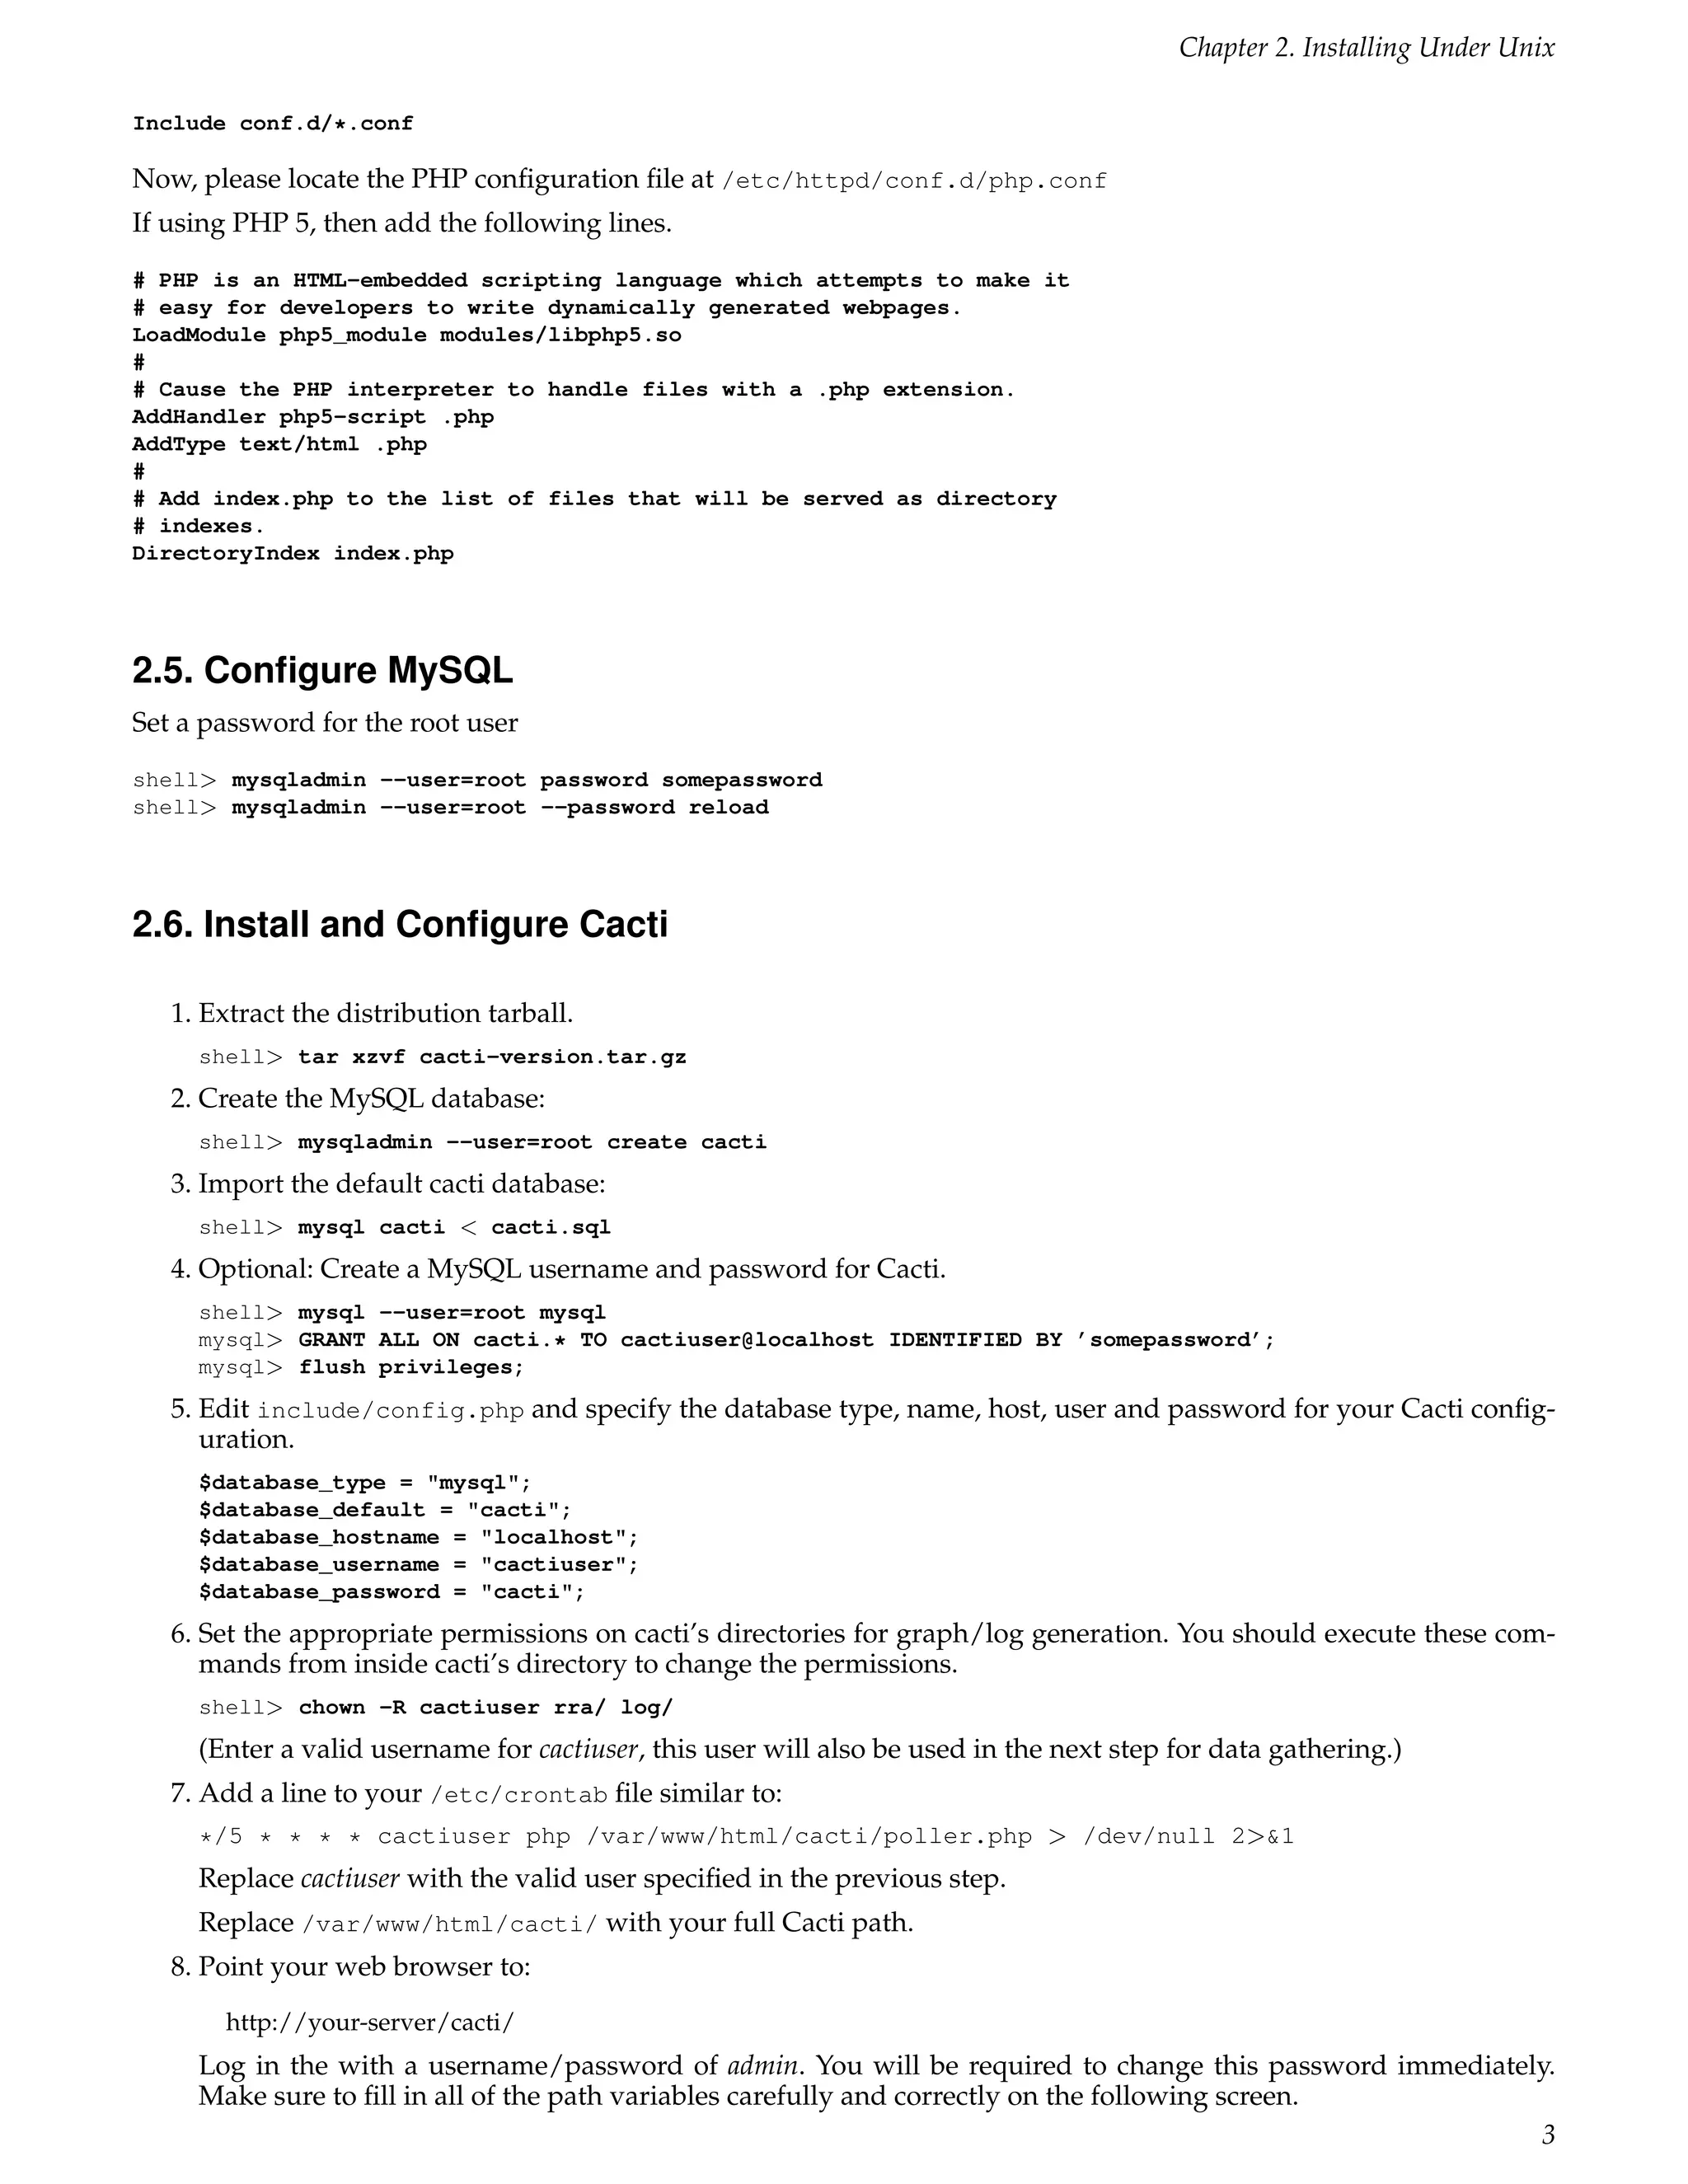
be useless unless they are also added to the VACM access control tables
described above.
SHA authentication and DES/AES privacy require OpenSSL to be installed and the
agent to be built with OpenSSL support. MD5 authentication may be used without
OpenSSL.
Warning: the minimum pass phrase length is 8 characters.]
VACM directives are explained from man snmpd.conf as follows
[ VACM Configuration
The full flexibility of the VACM is available using four configuration directives -
com2sec, group, view and access. These provide direct configuration of the underlying
VACM tables.
com2sec [-Cn CONTEXT] SECNAME SOURCE COMMUNITY
map an SNMPv1 or SNMPv2c community string to a security name - either from a
particular range of source addresses, or globally ("default"). A restricted
source can either be a specific hostname (or address), or a subnet -
represented as IP/MASK (e.g. 10.10.10.0/255.255.255.0), or IP/BITS
(e.g. 10.10.10.0/24), or the IPv6 equivalents.
The same community string can be specified in several separate directives
(presumably with different source tokens), and the first source/community
combination that matches the incoming request will be selected. Various
source/community combinations can also map to the same security name.
If a CONTEXT is specified (using -Cn), the community string will be mapped
to a security name in the named SNMPv3 context. Otherwise the default
context ("") will be used.
group GROUP {v1|v2c|usm} SECNAME
maps a security name (in the specified security model) into a named group.
Several group directives can specify the same group name, allowing a single
access setting to apply to several users and/or community strings.
Note that groups must be set up for the two community-based models separately -
a single com2sec (or equivalent) directive will typically be accompanied by two
group directives.
view VNAME TYPE OID [MASK]
defines a named "view" - a subset of the overall OID tree. This is most commonly
a single subtree, but several view directives can be given with the same view
name, to build up a more complex collection of OIDs. TYPE is either included
or excluded, which can again define a more complex view (e.g by excluding certain
sensitive objects from an otherwise accessible subtree).
MASK is a list of hex octets (separated by “.” or “:”)
with the set bits indicating which subidentifiers in the view OID to match against.
This can be used to define a view covering a particular row (or rows) in a table.
If not specified, this defaults to matching the OID exactly (all bits set), thus
defining a simple OID subtree.
access GROUP CONTEXT {any|v1|v2c|usm} LEVEL PREFX READ WRITE NOTIFY
maps from a group of users/communities (with a particular security model
and minimum security level, and in a specific context) to one of three views,
depending on the request being processed.
LEVEL is one of noauth, auth, or priv. PREFX specifies how CONTEXT should be
matched against the context of the incoming request, either exact or prefix.
READ, WRITE and NOTIFY specifies the view to be used for GET*, SET and
TRAP/INFORM requests (althought the NOTIFY view is not currently used). For
v1 or v2c access, LEVEL will need to be noauth.]
As an example, following definitions in the snmpd configuration create a set of definitions for use with SNMP V3
# sample configuration for SNMP V3
16](https://image.slidesharecdn.com/cactimanual-121101075848-phpapp01/75/Cacti-manual-21-2048.jpg)


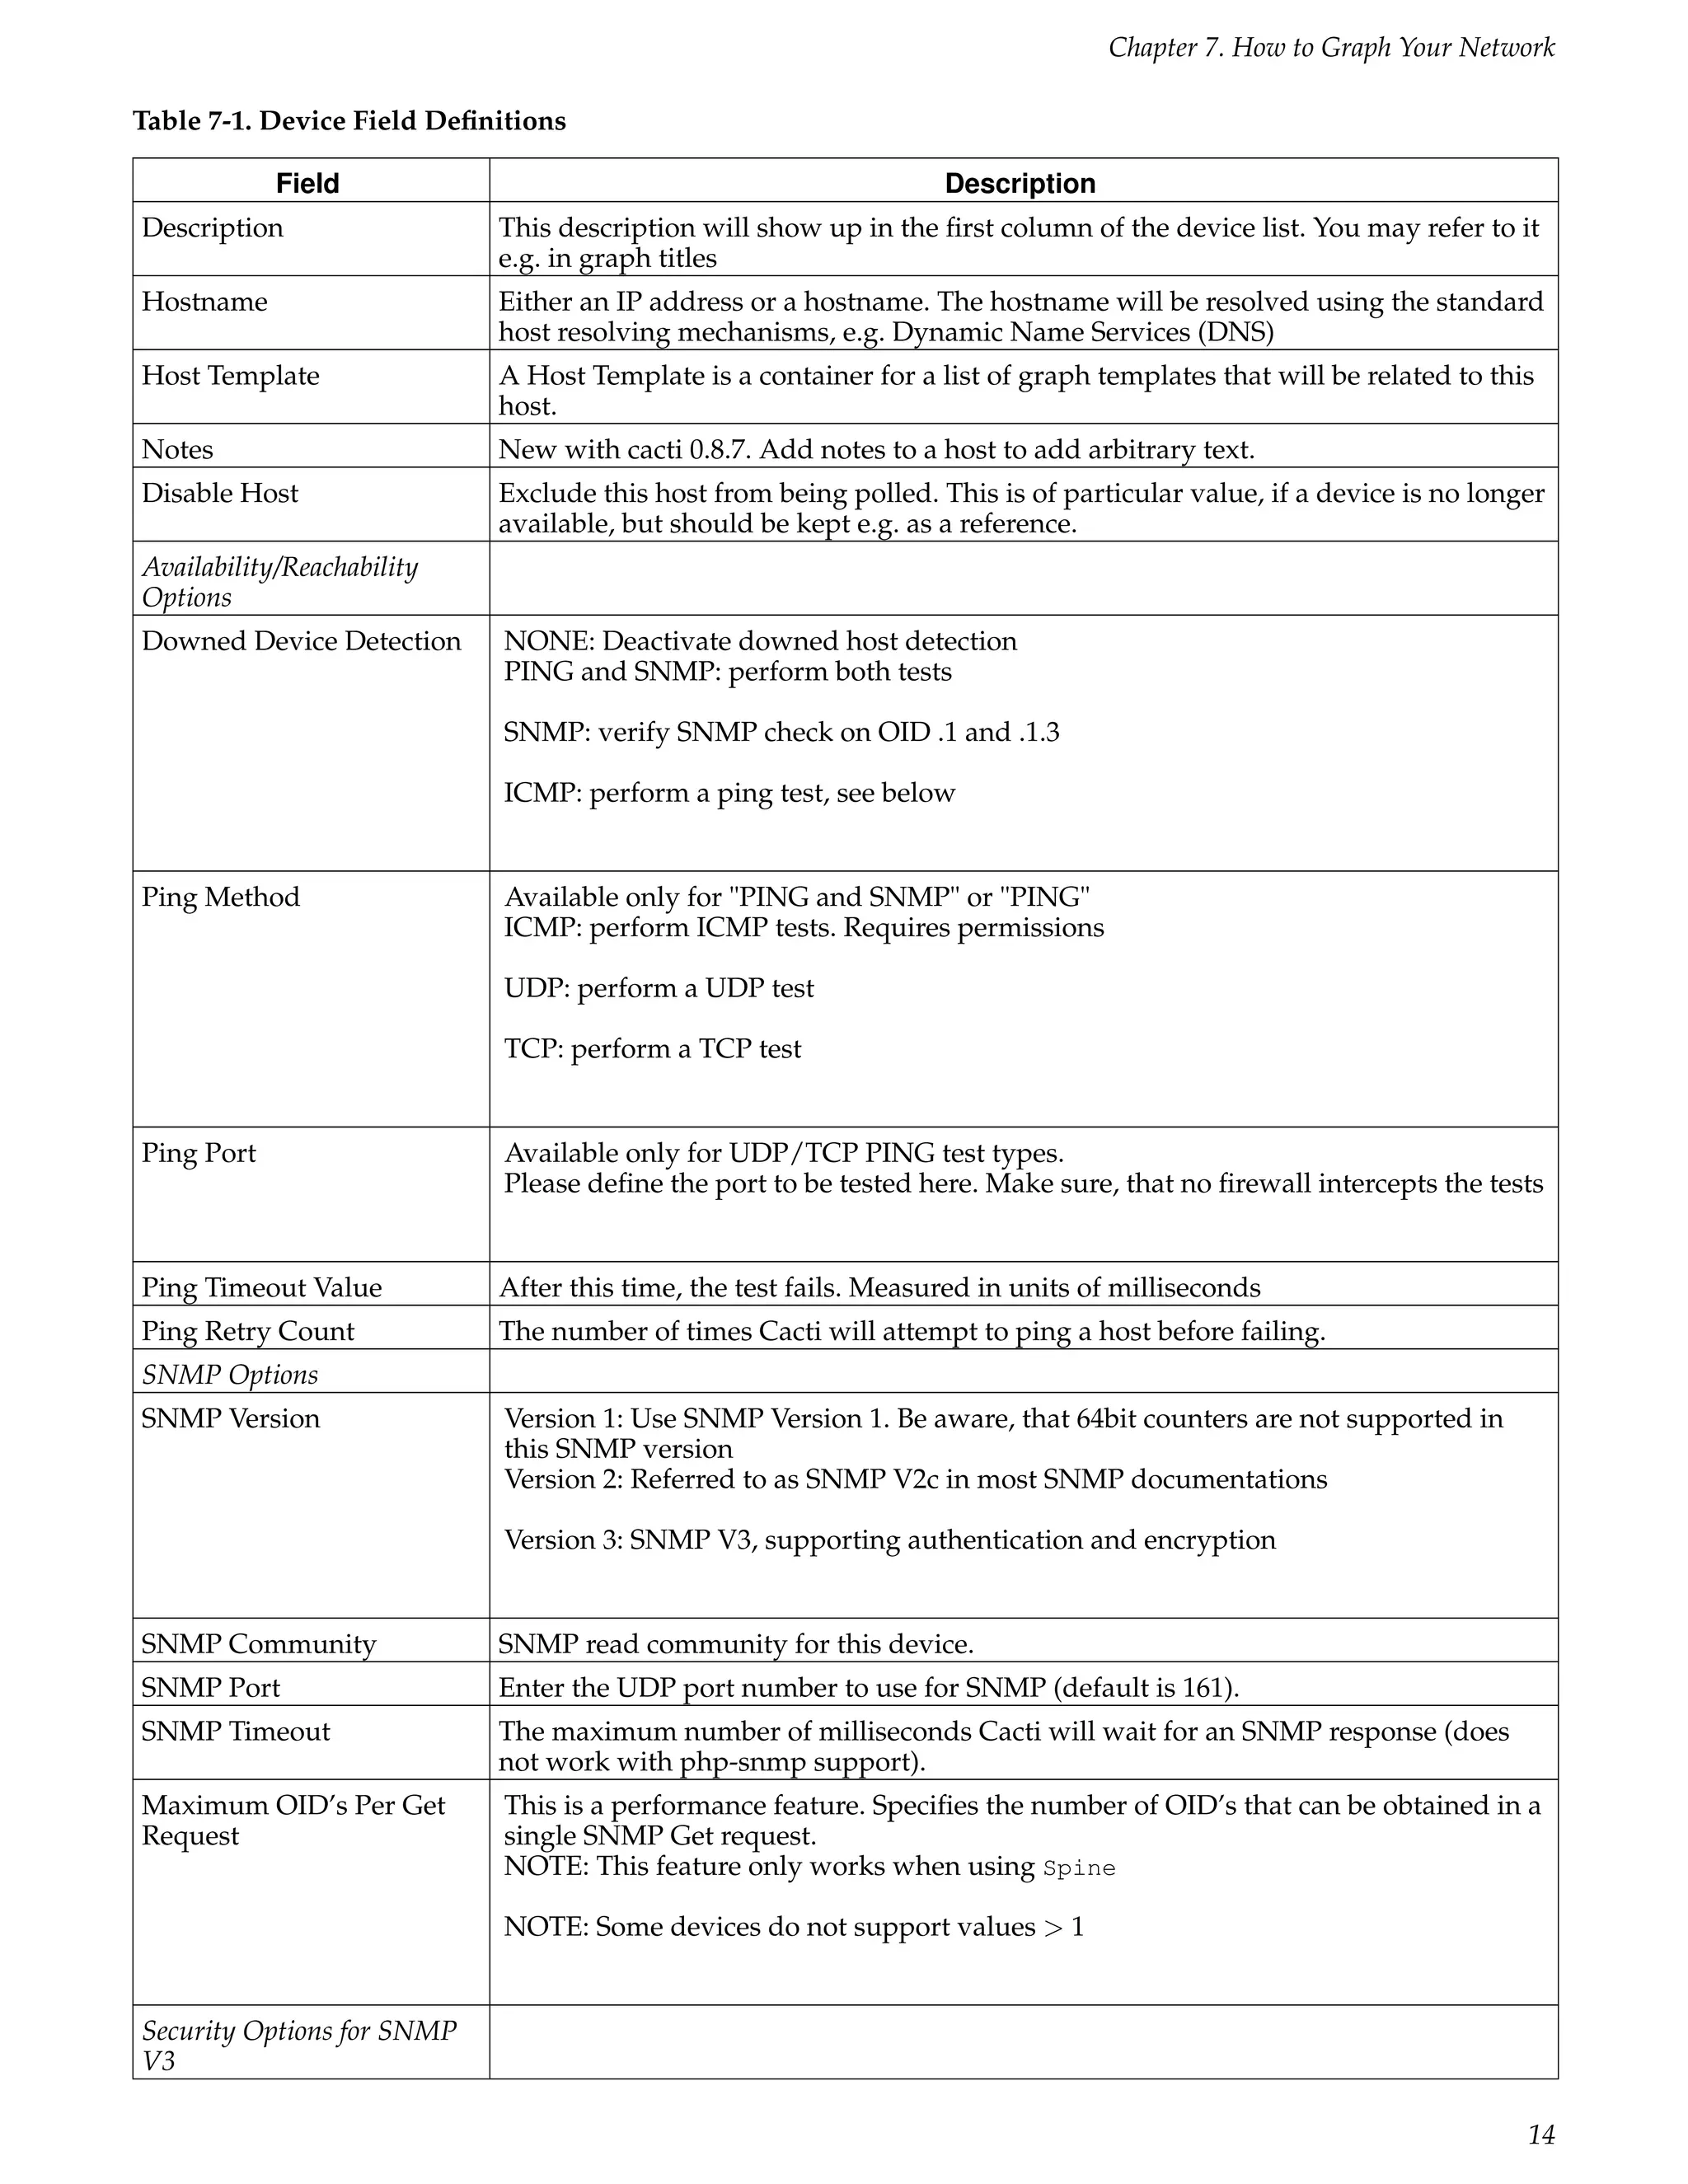
![Chapter 10. Graph a Single SNMP OID
When dealing with SNMP-enabled devices, there are often times when you want to graph the value of a single OID.
This tutorial explains how to do this in Cacti. It also assumes that you have the "SNMP - Generic OID Template"
graph template, which is now included in Cacti as of version 0.8.5. If you do not see this template listed under Graph
Templates, download the template from the Cacti website in XML form and import it using the Import Templates menu
item.
To start the process of creating a new graph for your OID, click the New Graphs menu item and select the host that
contains the target OID from the dropdown. Under the Graph Templates box, you will see a dropdown on the last line
that reads (Select a graph type to create). From this dropdown, choose "SNMP - Generic OID Template" and click the
Create button at the bottom of the page.
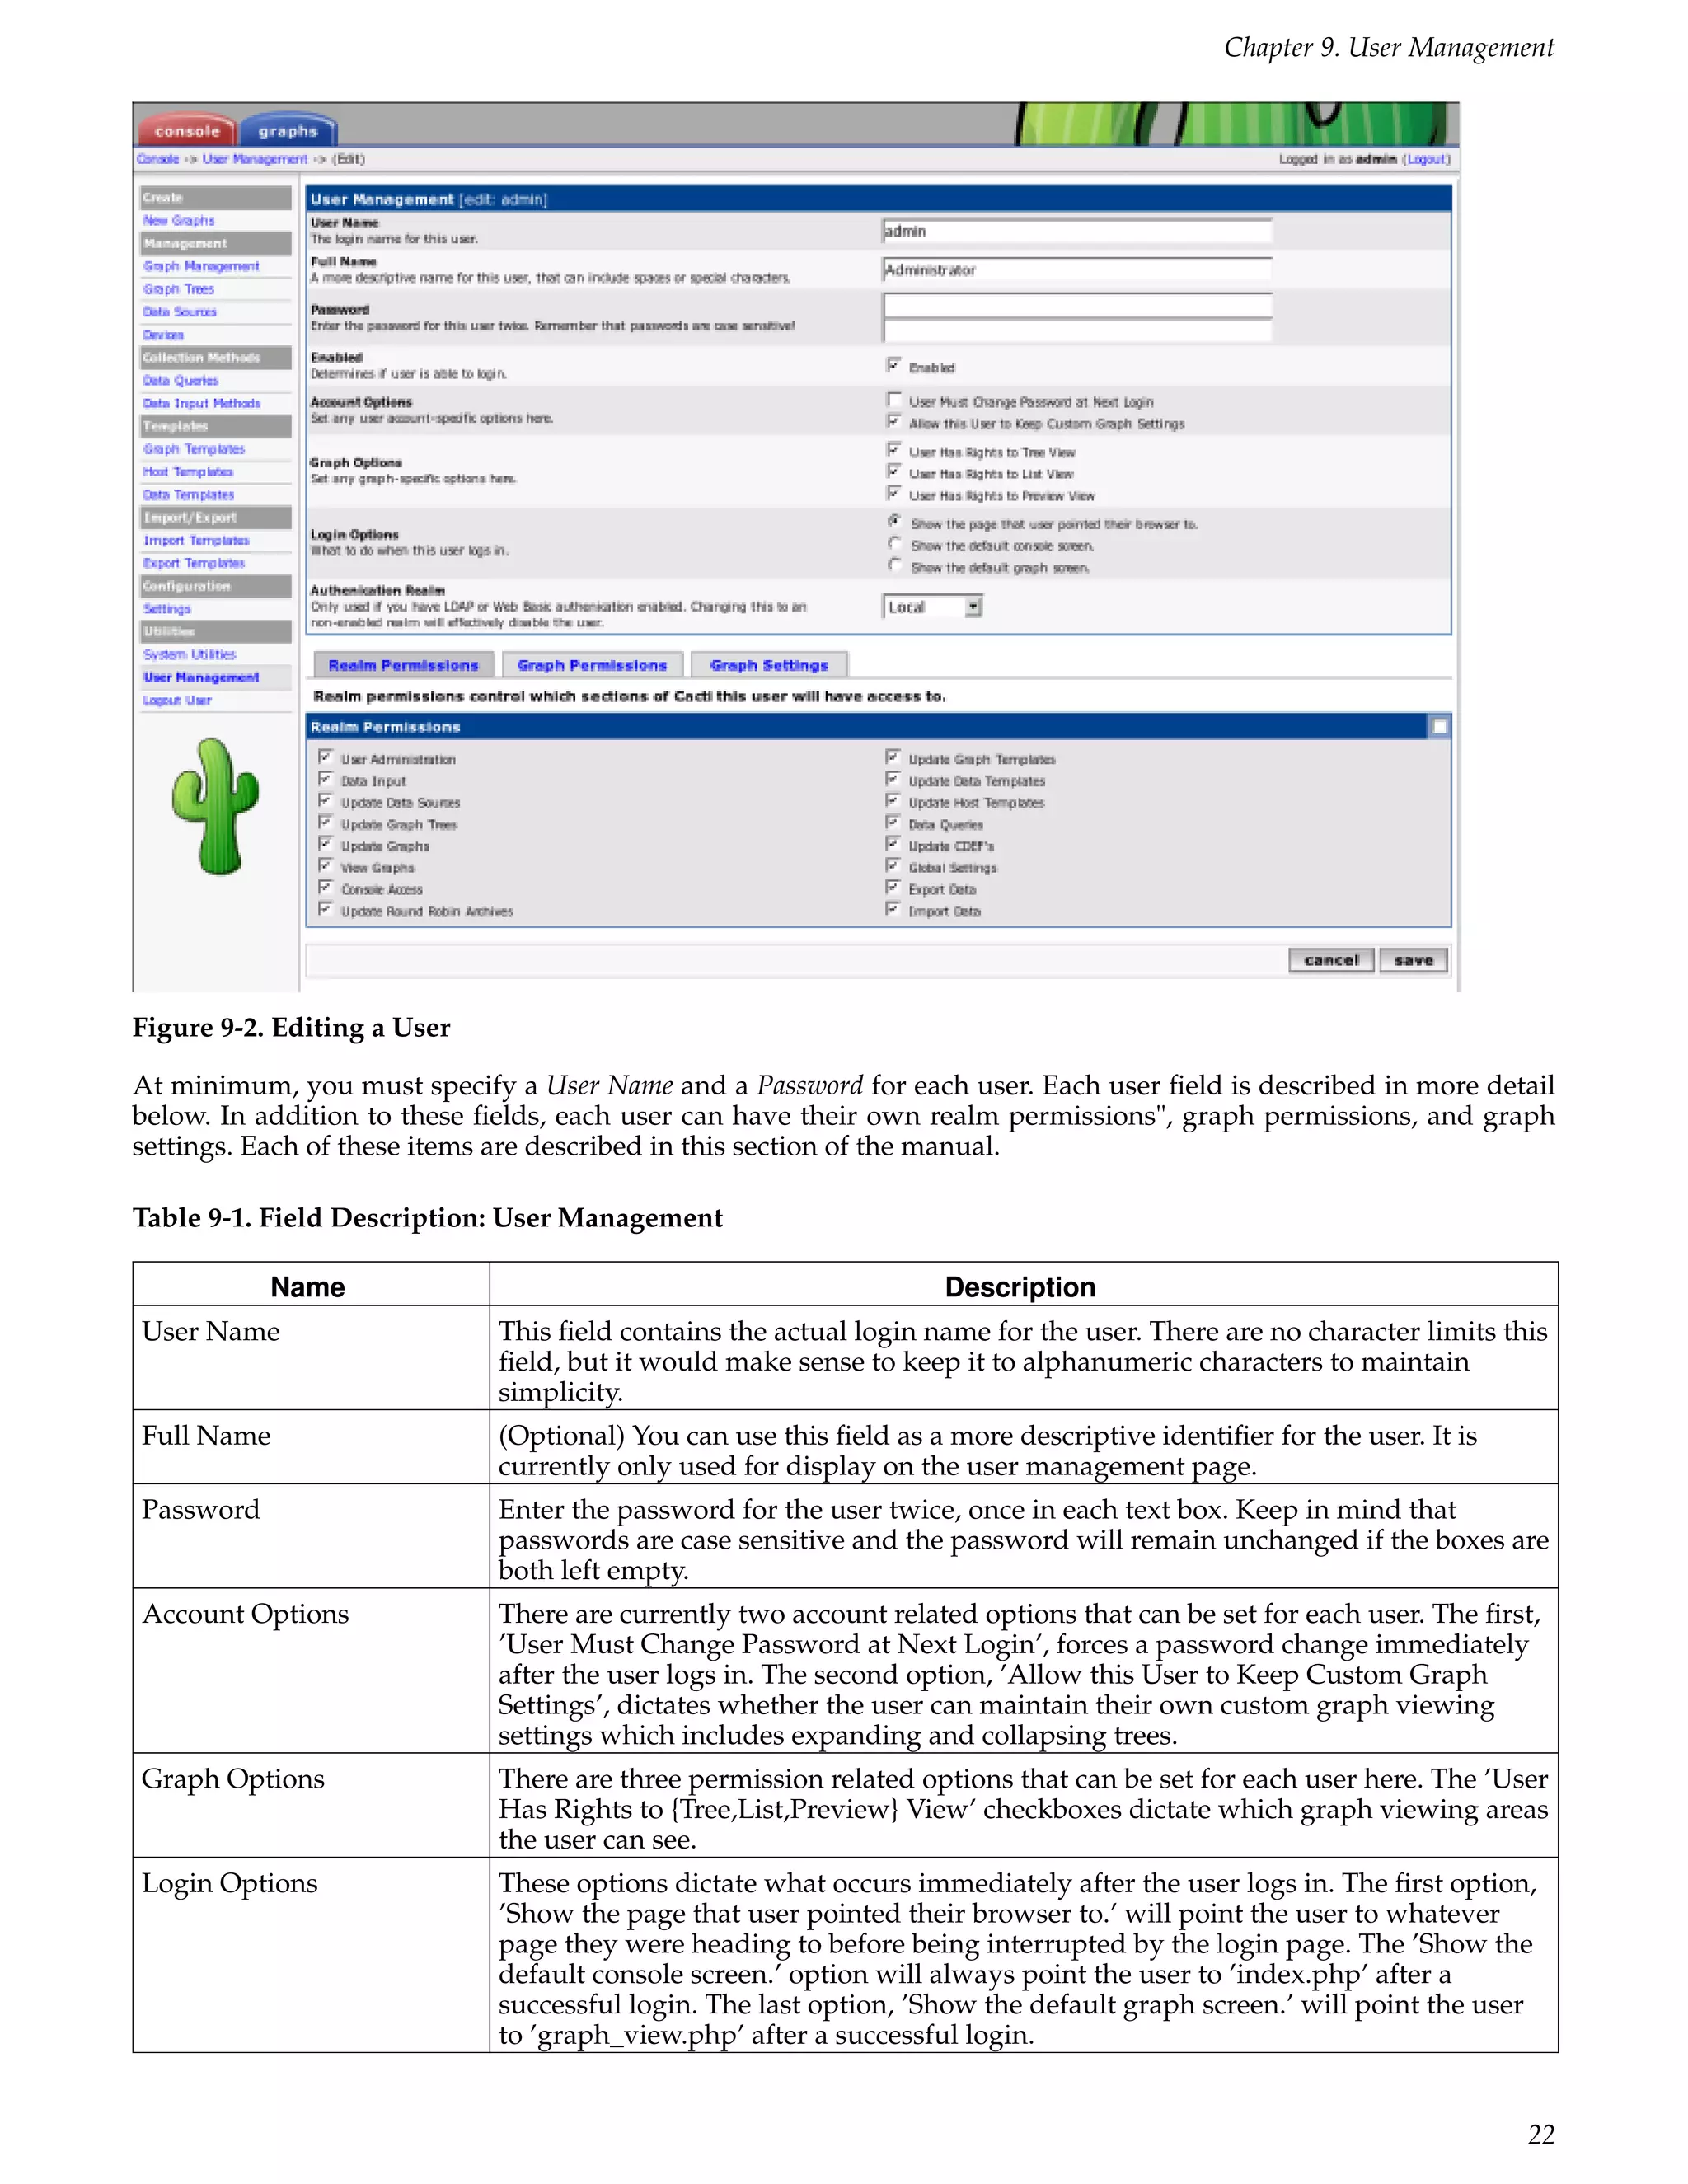
You will be presented with several fields that will require input before the new graph can be created. They are de-
scribed in more detail below.
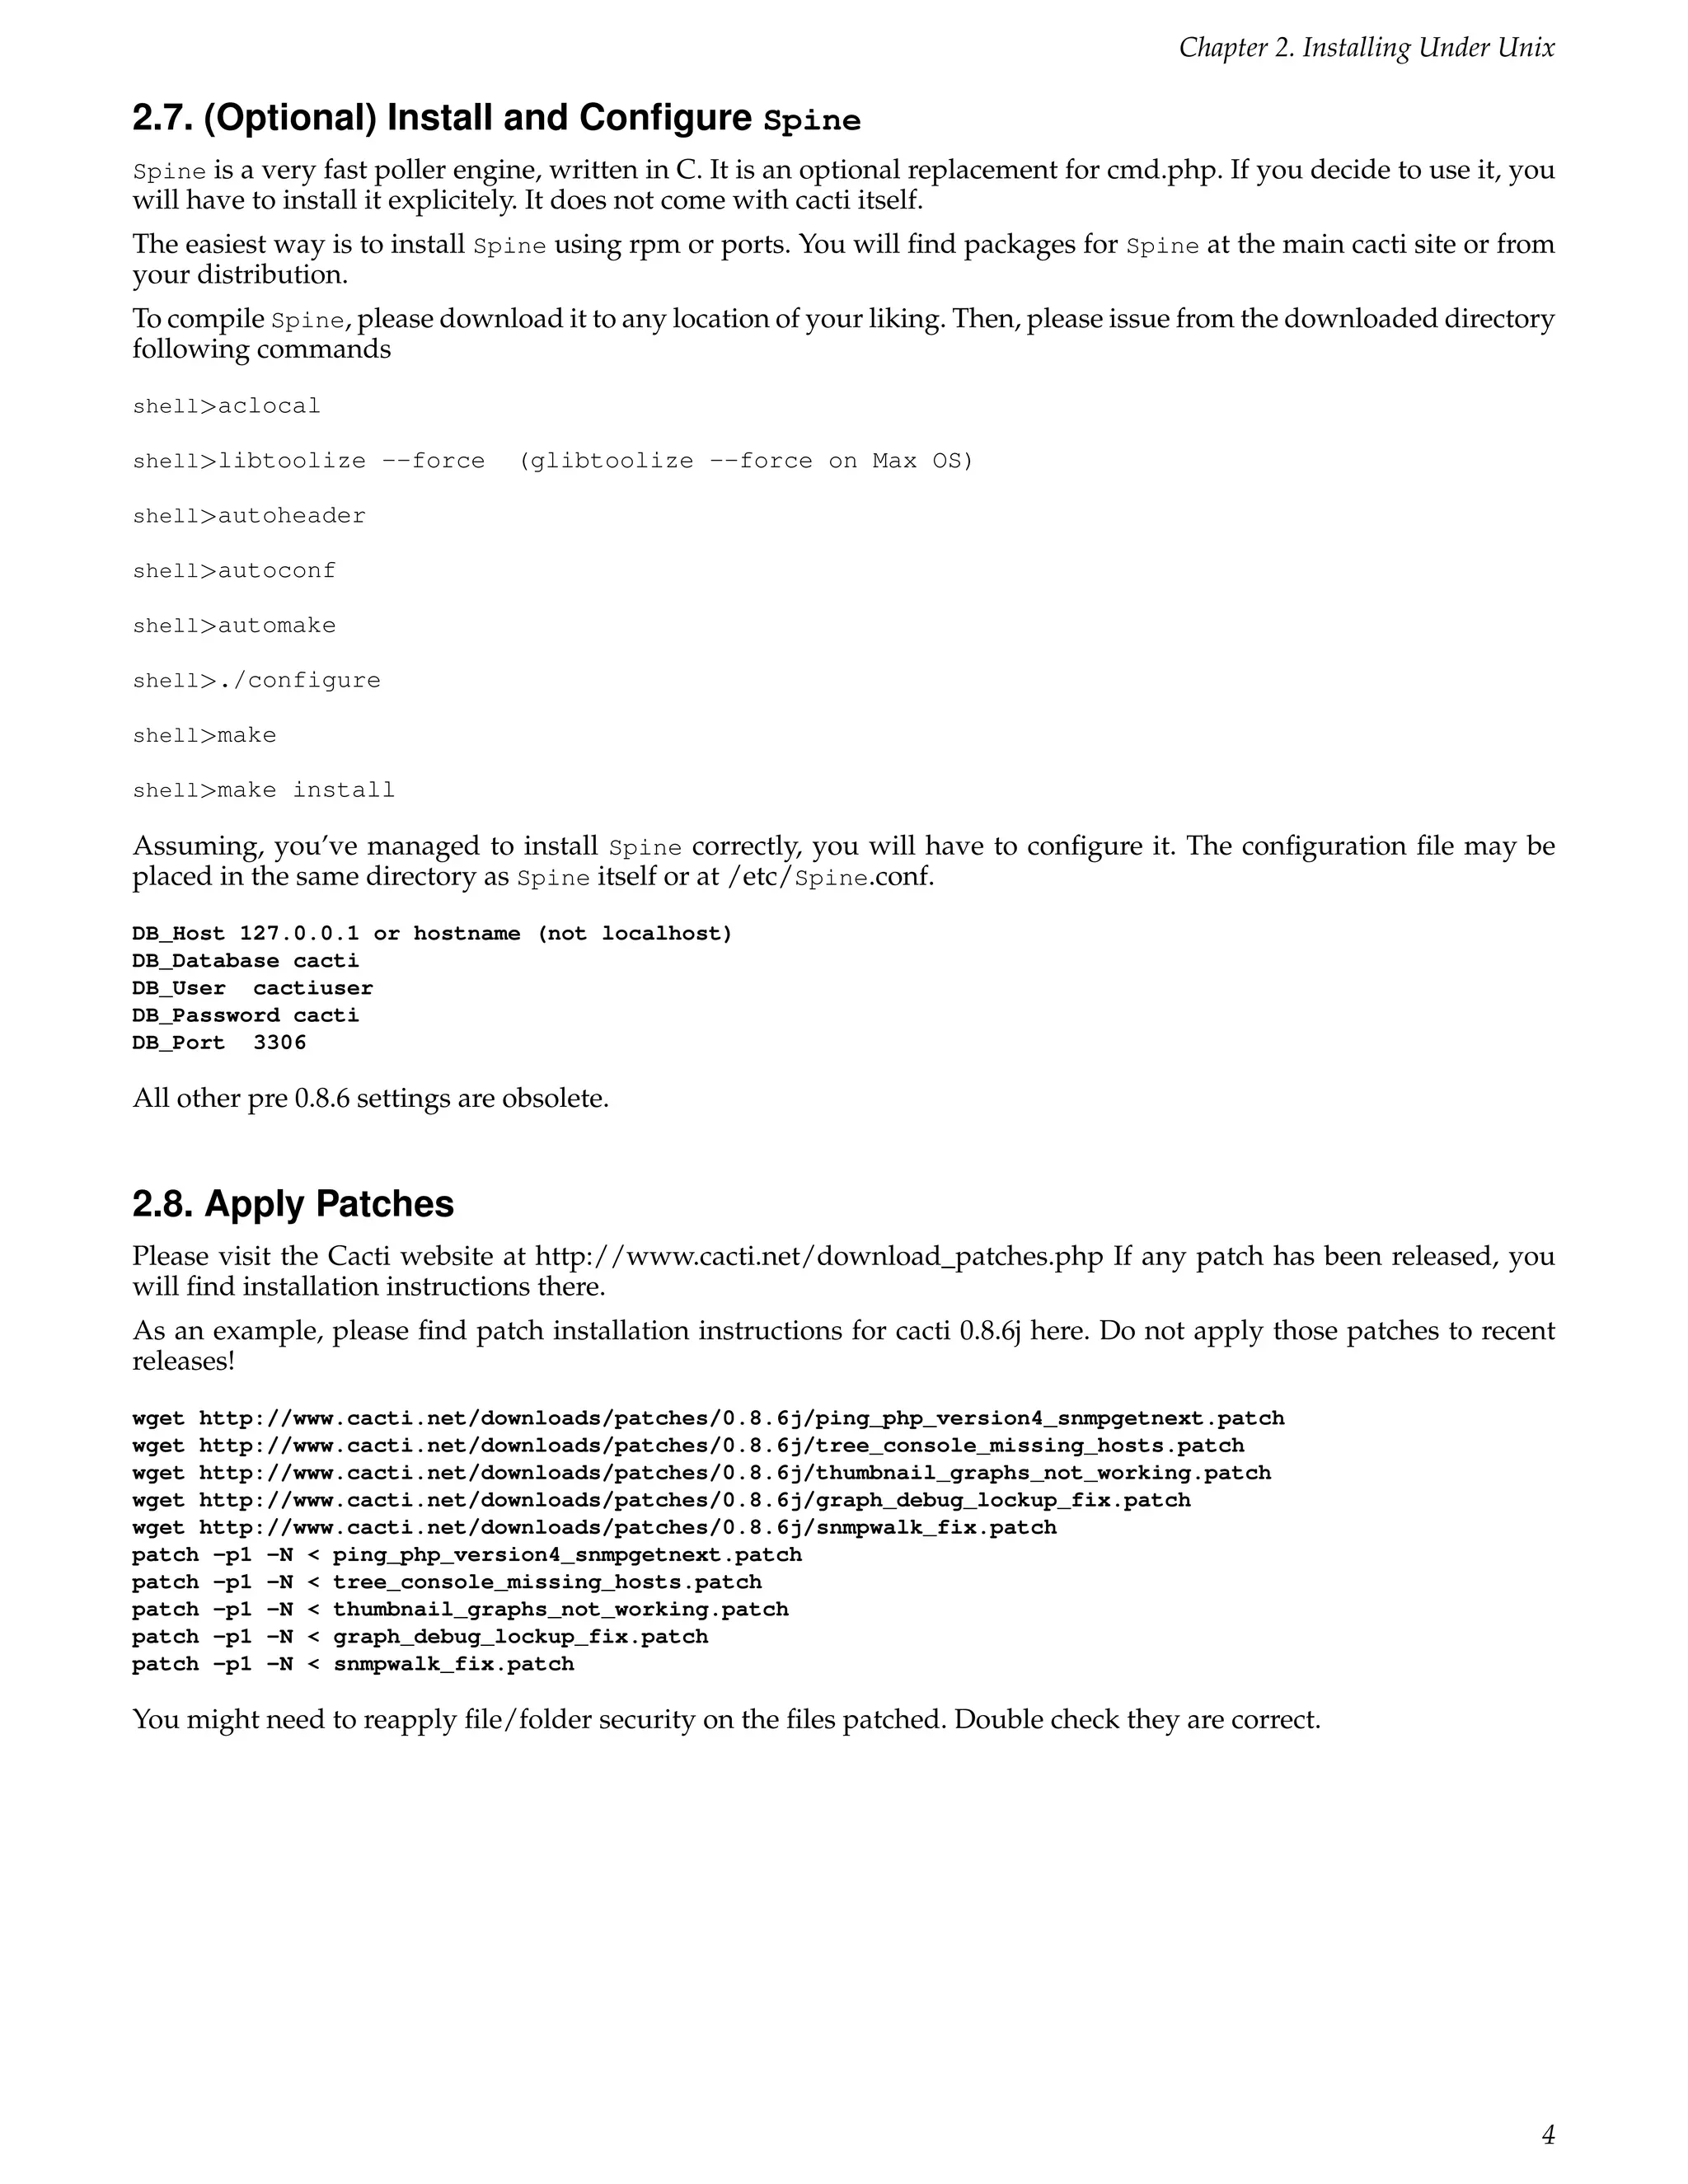
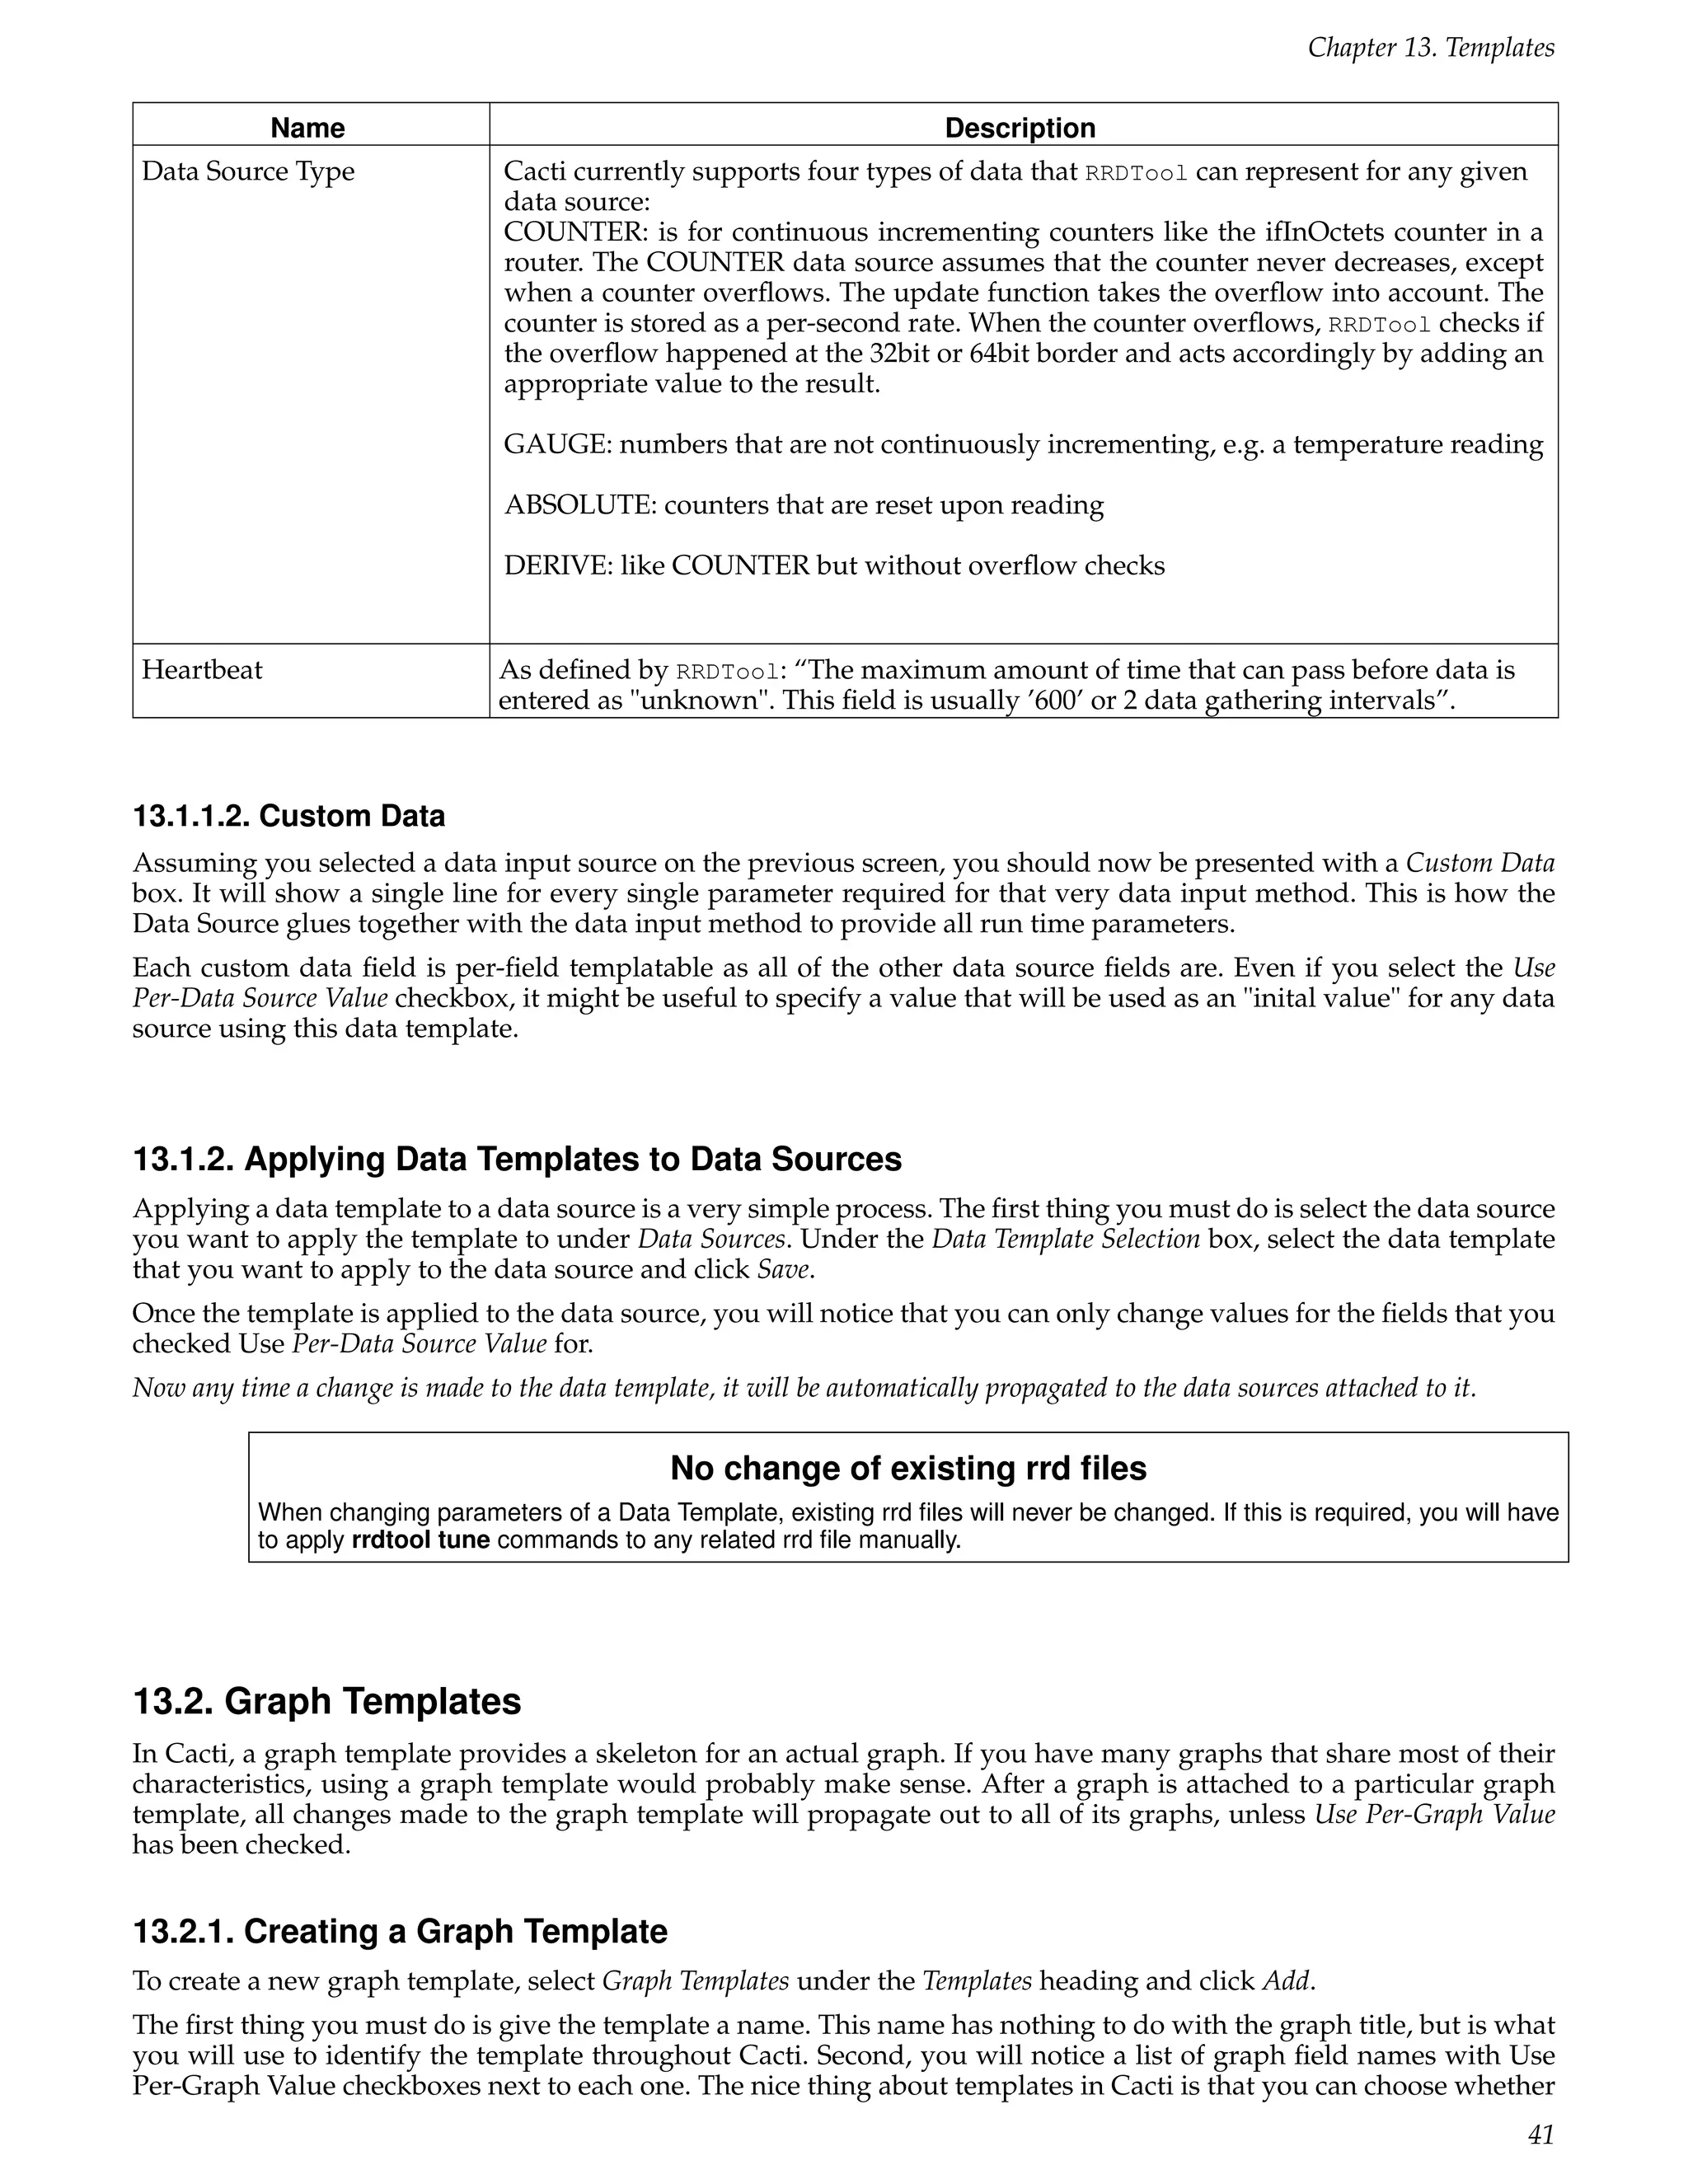
Table 10-1. Field Description: SNMP - Generic OID Template
Name Description
(Graph) Title The title that is to be used for the new graph. It is generally a good idea to keep
|host_description| in the title, as to make the graph easier to identify later.
(Graph) Vertical Label The text that will be printed along the y-axis of the graph. It is generally used to
describe units, such as ’bytes’ or ’percent’.
(Graph Items) Legend The color that will be used to reprent the data on the graph.
Color
(Graph Items) Legend Text The text that will be used to describe the data on the graph legend.
(Data Source) Name The title that is to be used for the new data source. It is generally a good idea to keep
|host_description| in the title, as to make the data source easier to identify later.
(Data Source) Maximum The maximum value that will be accepted from the OID. Make sure you choose a
Value [snmp_oid] value that is reasonable for the data you are trying to graph because anything larger
than the maximum will be ignored. If you are graphing a percentage, you should use
’100’ as the value should never exceed this.
(Data Source) Data Source How the data from the OID should be stored by RRDTool and interpreted on the
Type [snmp_oid] graph. If the value of the OID represents the actual data, you should use GAUGE for
this field. If the OID value is a constantly incrimenting number, you should use
COUNTER for this field. The two remaining field values, DERIVE and ABSOLUTE can
be ignored in most situations.
(Custom Data) OID The actual SNMP OID to graph. It is typically a good idea to enter the number OID
here as opposed to using MIB names. For instance, to get the number of open files on a
Netware server, you would use ".1.3.6.1.4.1.23.2.28.2.7.0" as the OID.
When finished filling in values for these fields, click the Create button. Your new graph can now be accessed through
the Graph Management page or the Graphs tab inside of Cacti.](https://image.slidesharecdn.com/cactimanual-121101075848-phpapp01/75/Cacti-manual-35-2048.jpg)
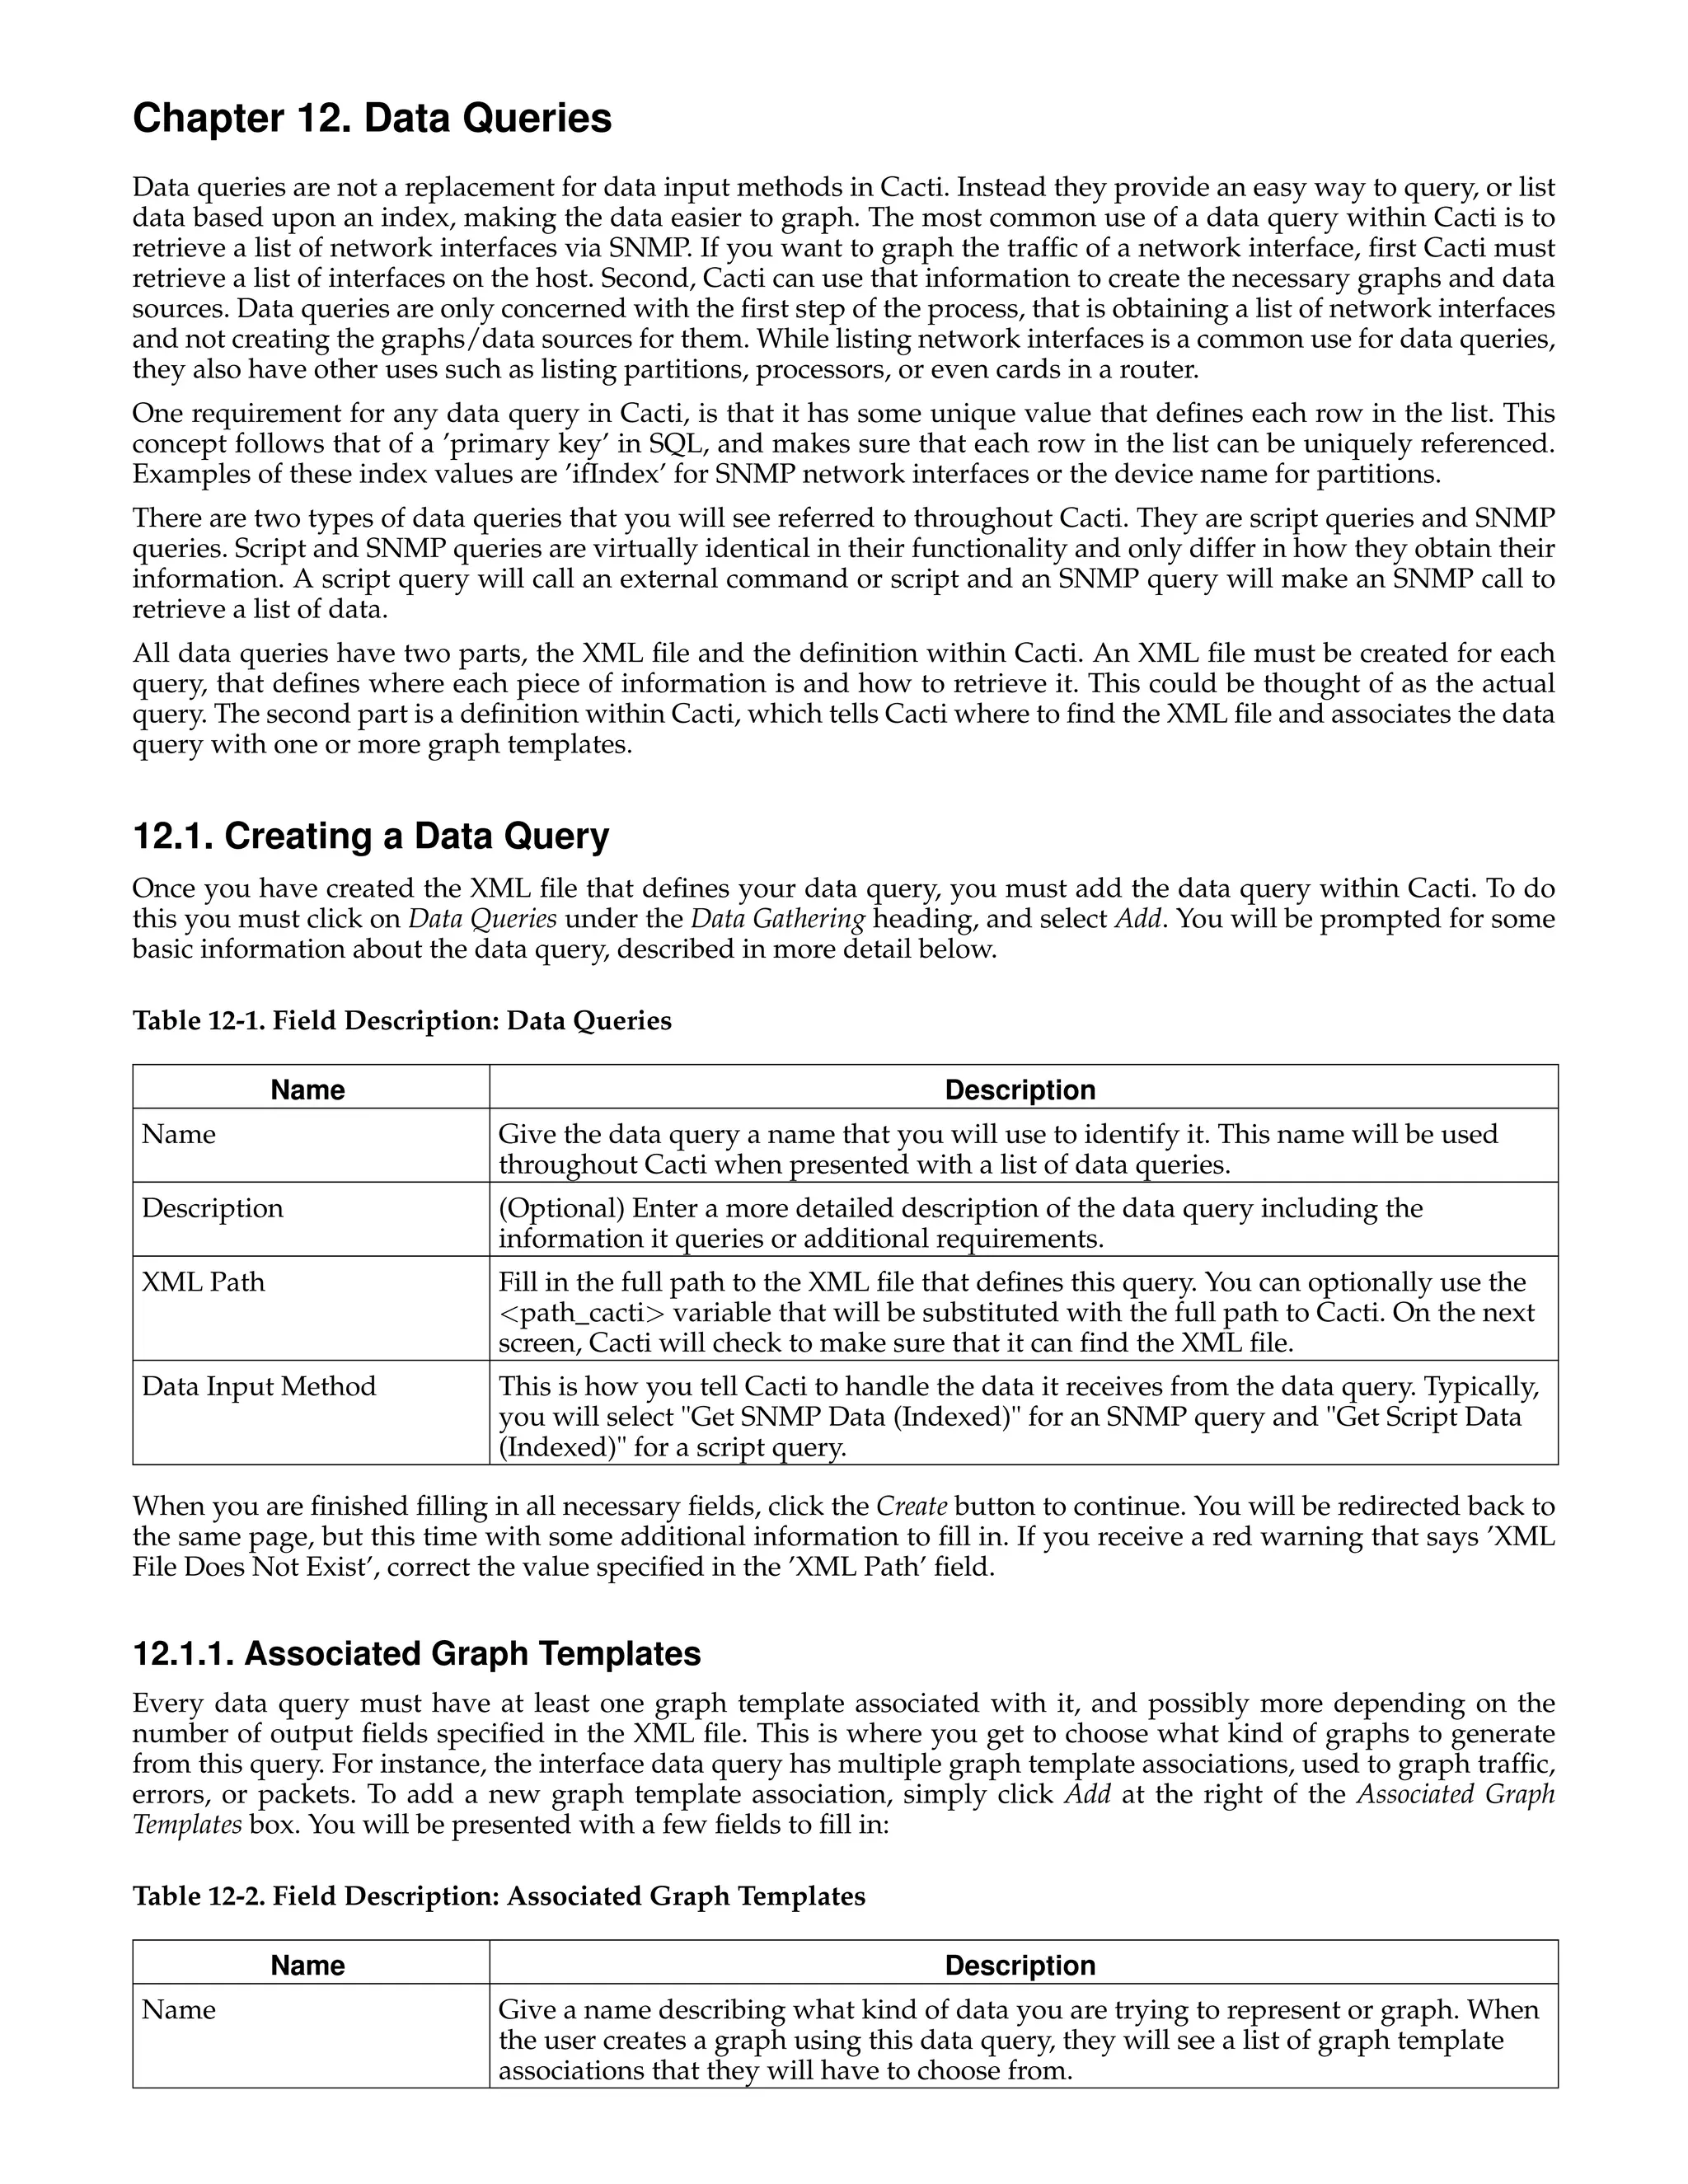
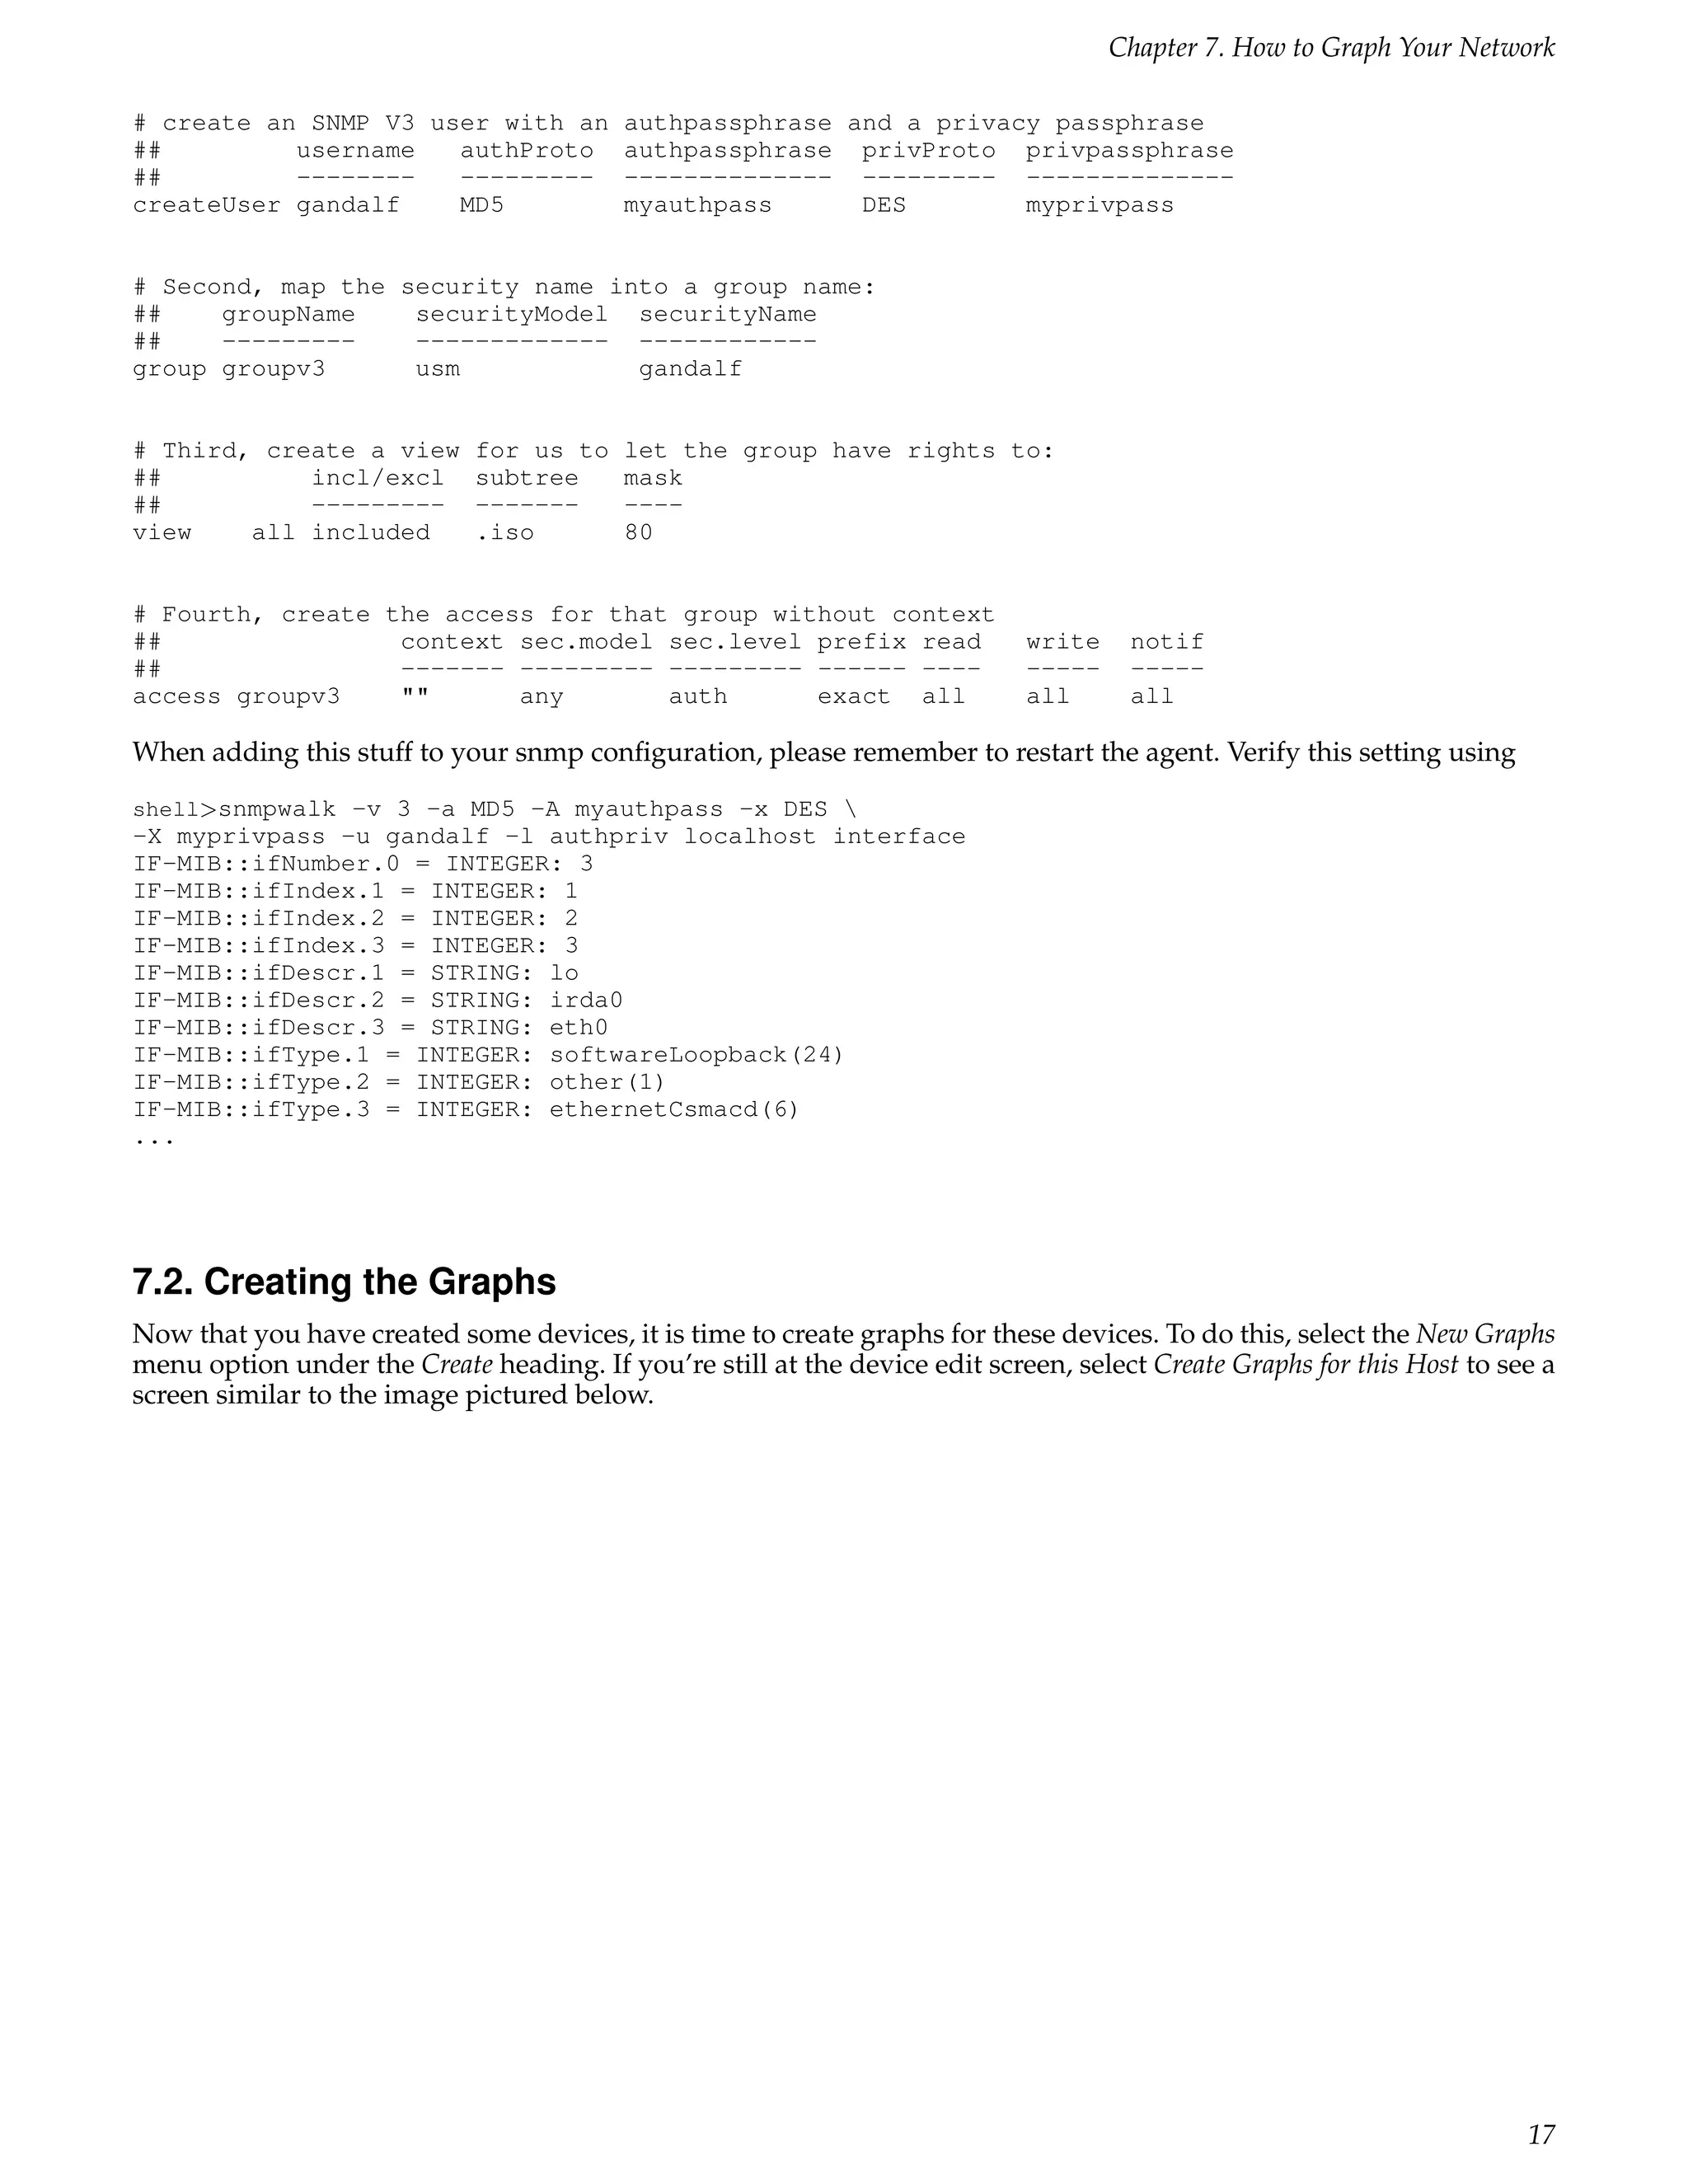
![Chapter 12. Data Queries
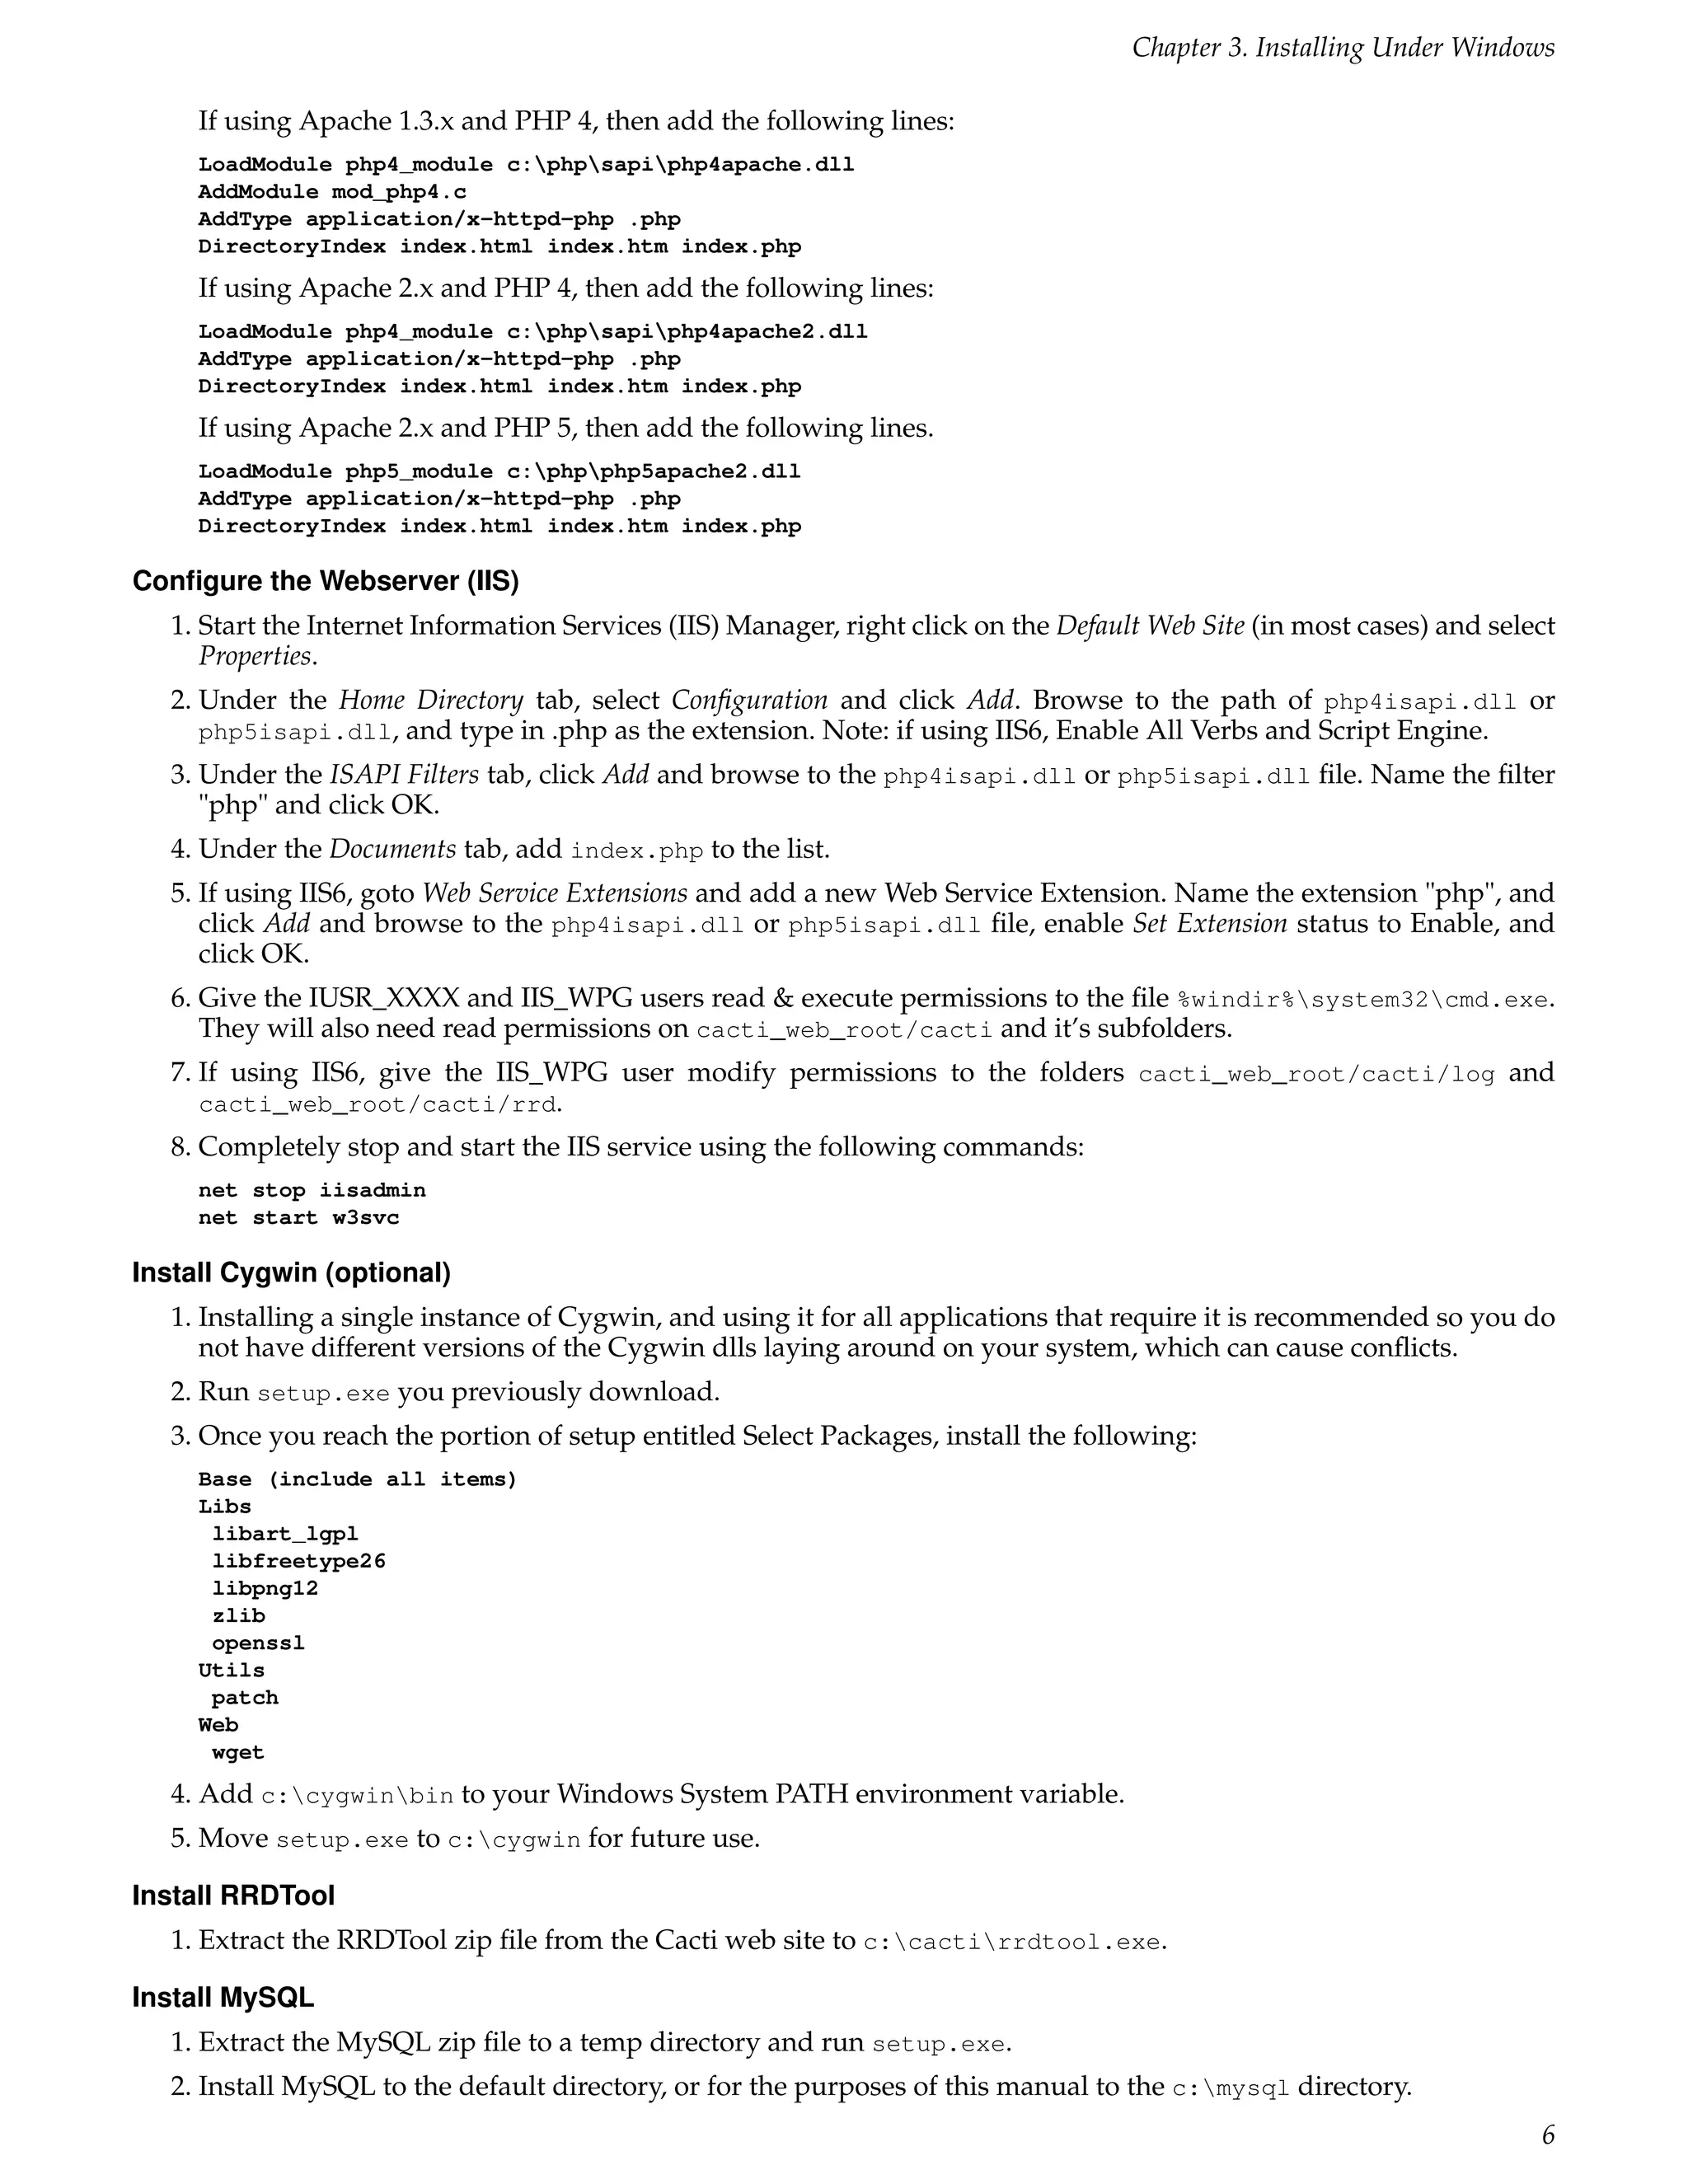
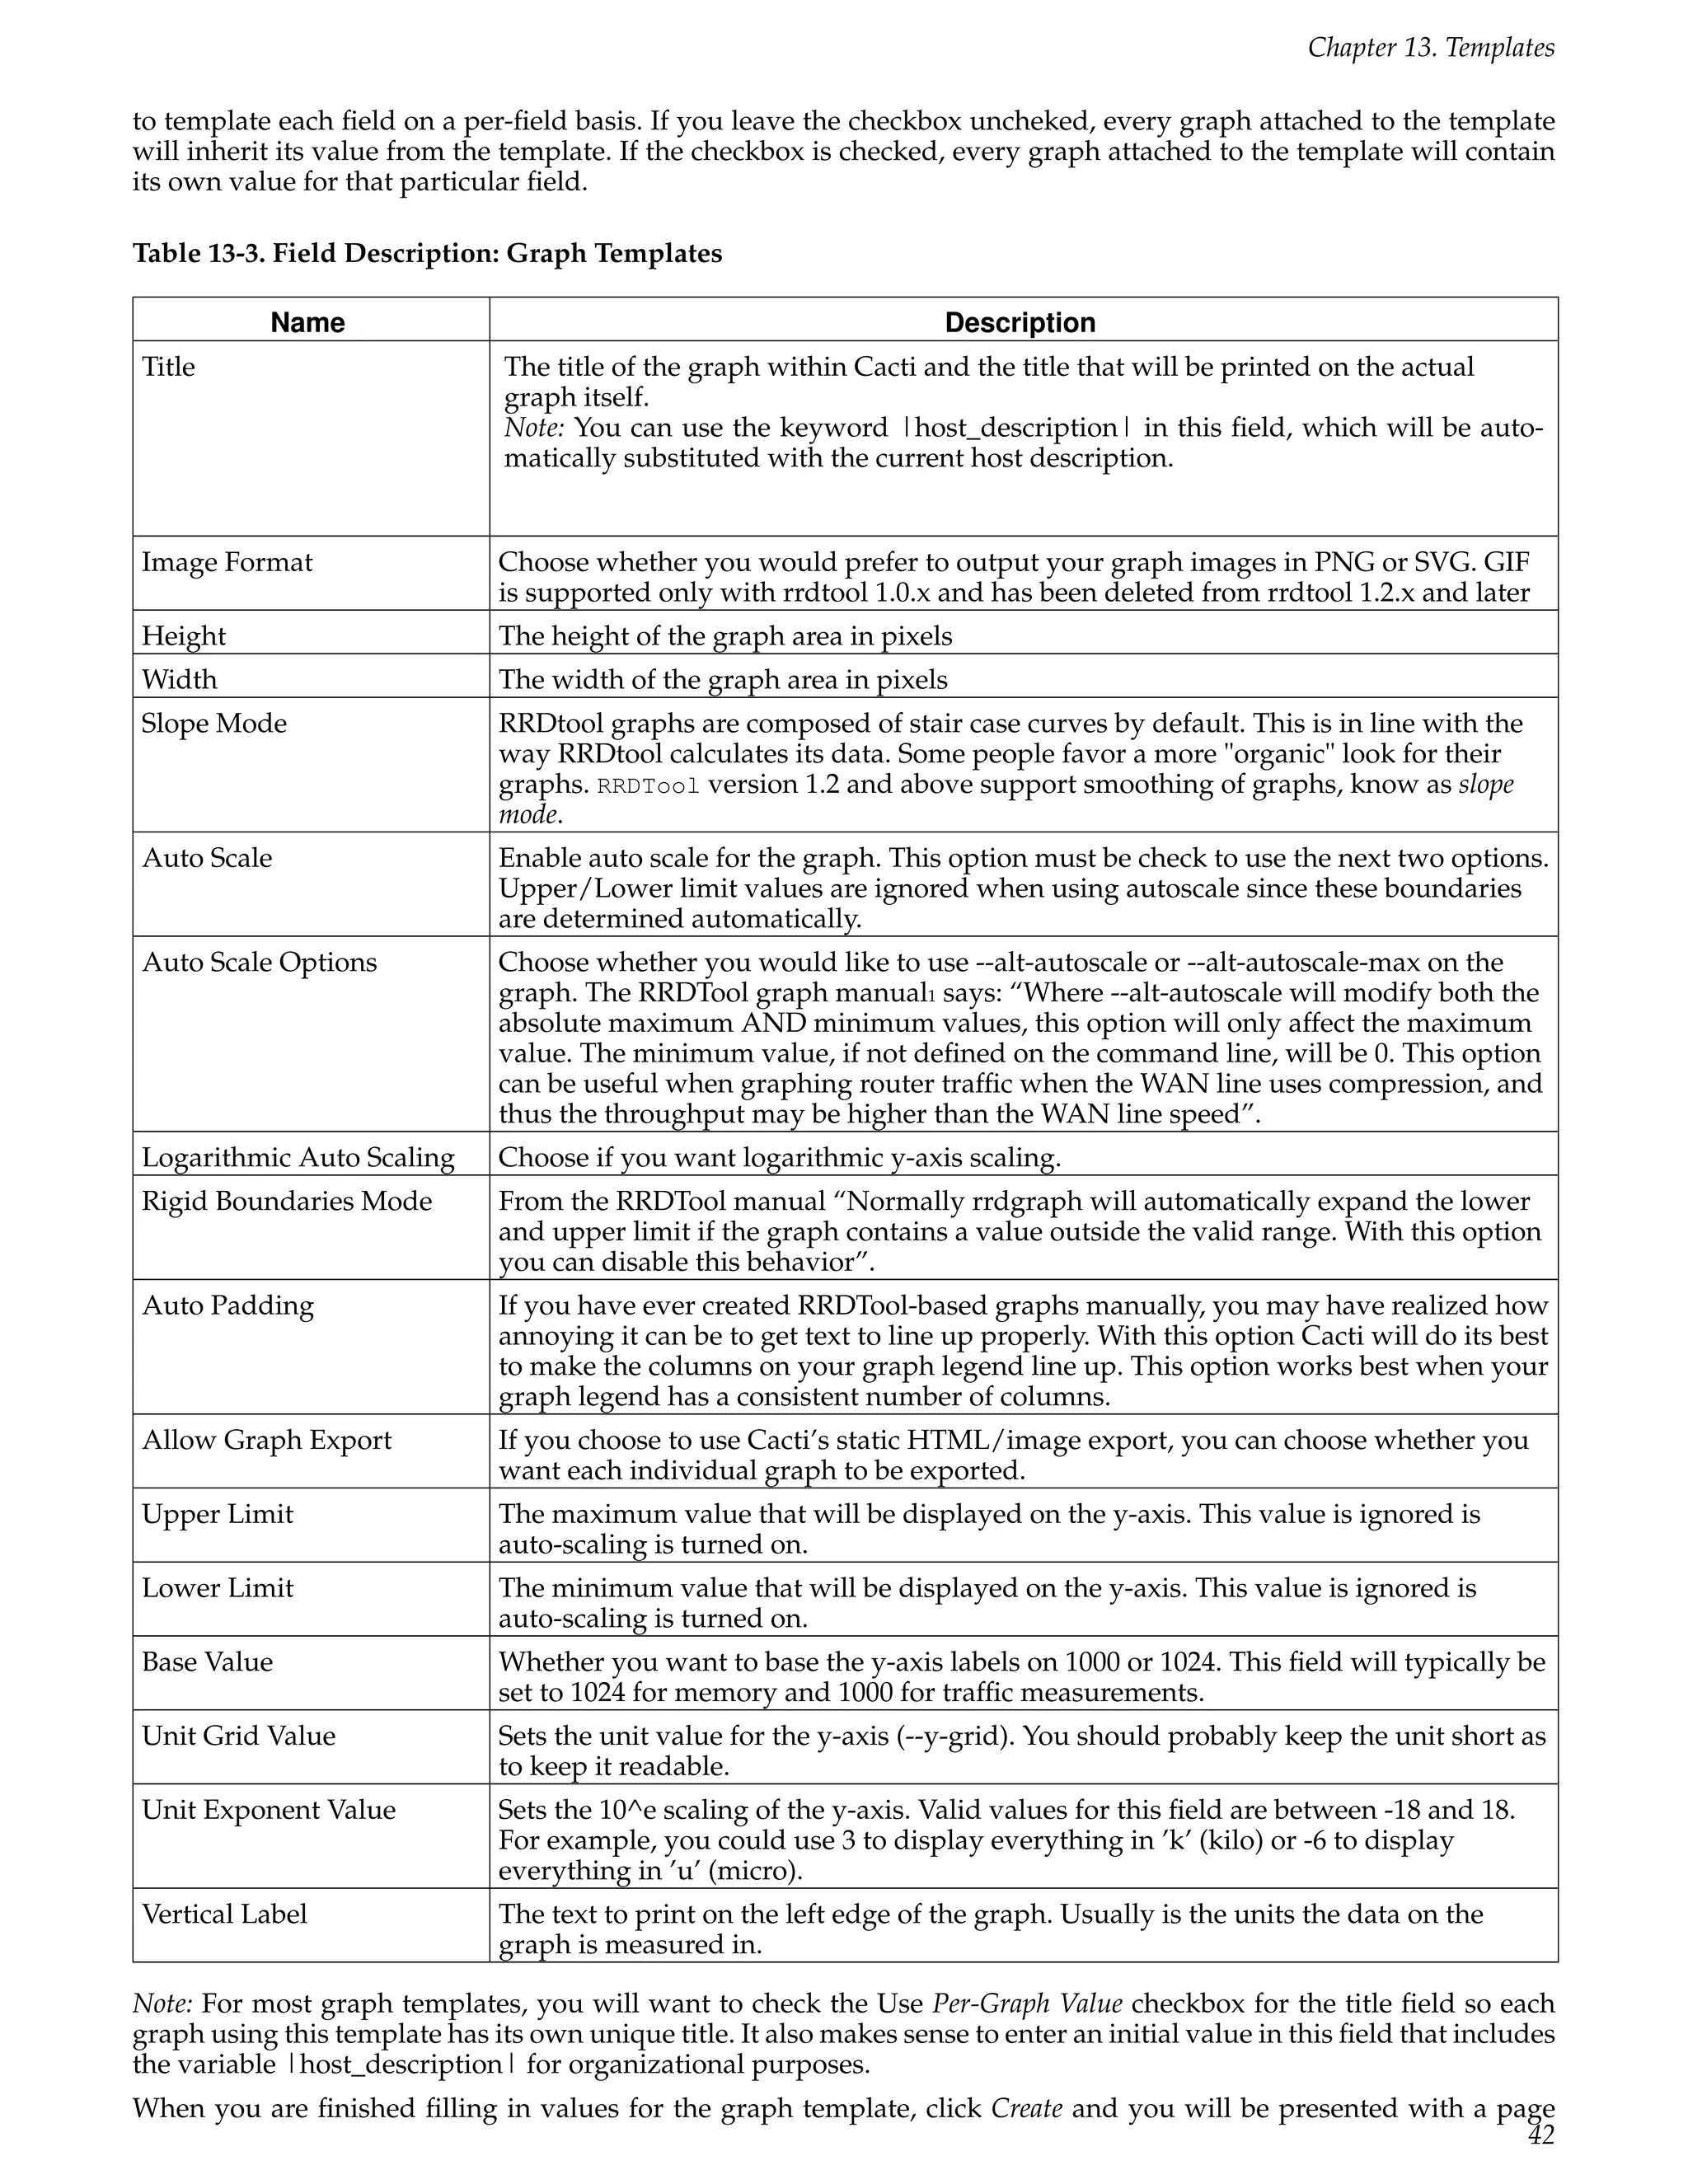
Name Description
Graph Template Choose the actual graph template that you want to make the association with.
When you are finished filling in these fields, click the Create button. You will be redirected back to the same page with
some additional information to fill in. Cacti will make a list of each data template referenced to in your selected graph
template and display them under the Associated Data Templates box. For each data source item listed, you must selected
the data query output field that corresponds with it. Do not forget to check the checkbox to the right of each selection, or your
settings will not be saved.
The Suggested Values box gives you a way to control field values of data sources and graphs created using this data
query. If you specify multiple suggested values for the same field, Cacti will evaluate them in order which you can
control using the up or down arrow icons. For more information about valid field names and variables, read the
section on suggested values.
When you are finished filling in all necessary fields on this form, click the Save button to return to the data queries edit
screen. Repeat the steps under this heading as many times as necessary to represent all data in your XML file. When
you are finished with this, you should be ready to start adding your data query to hosts.
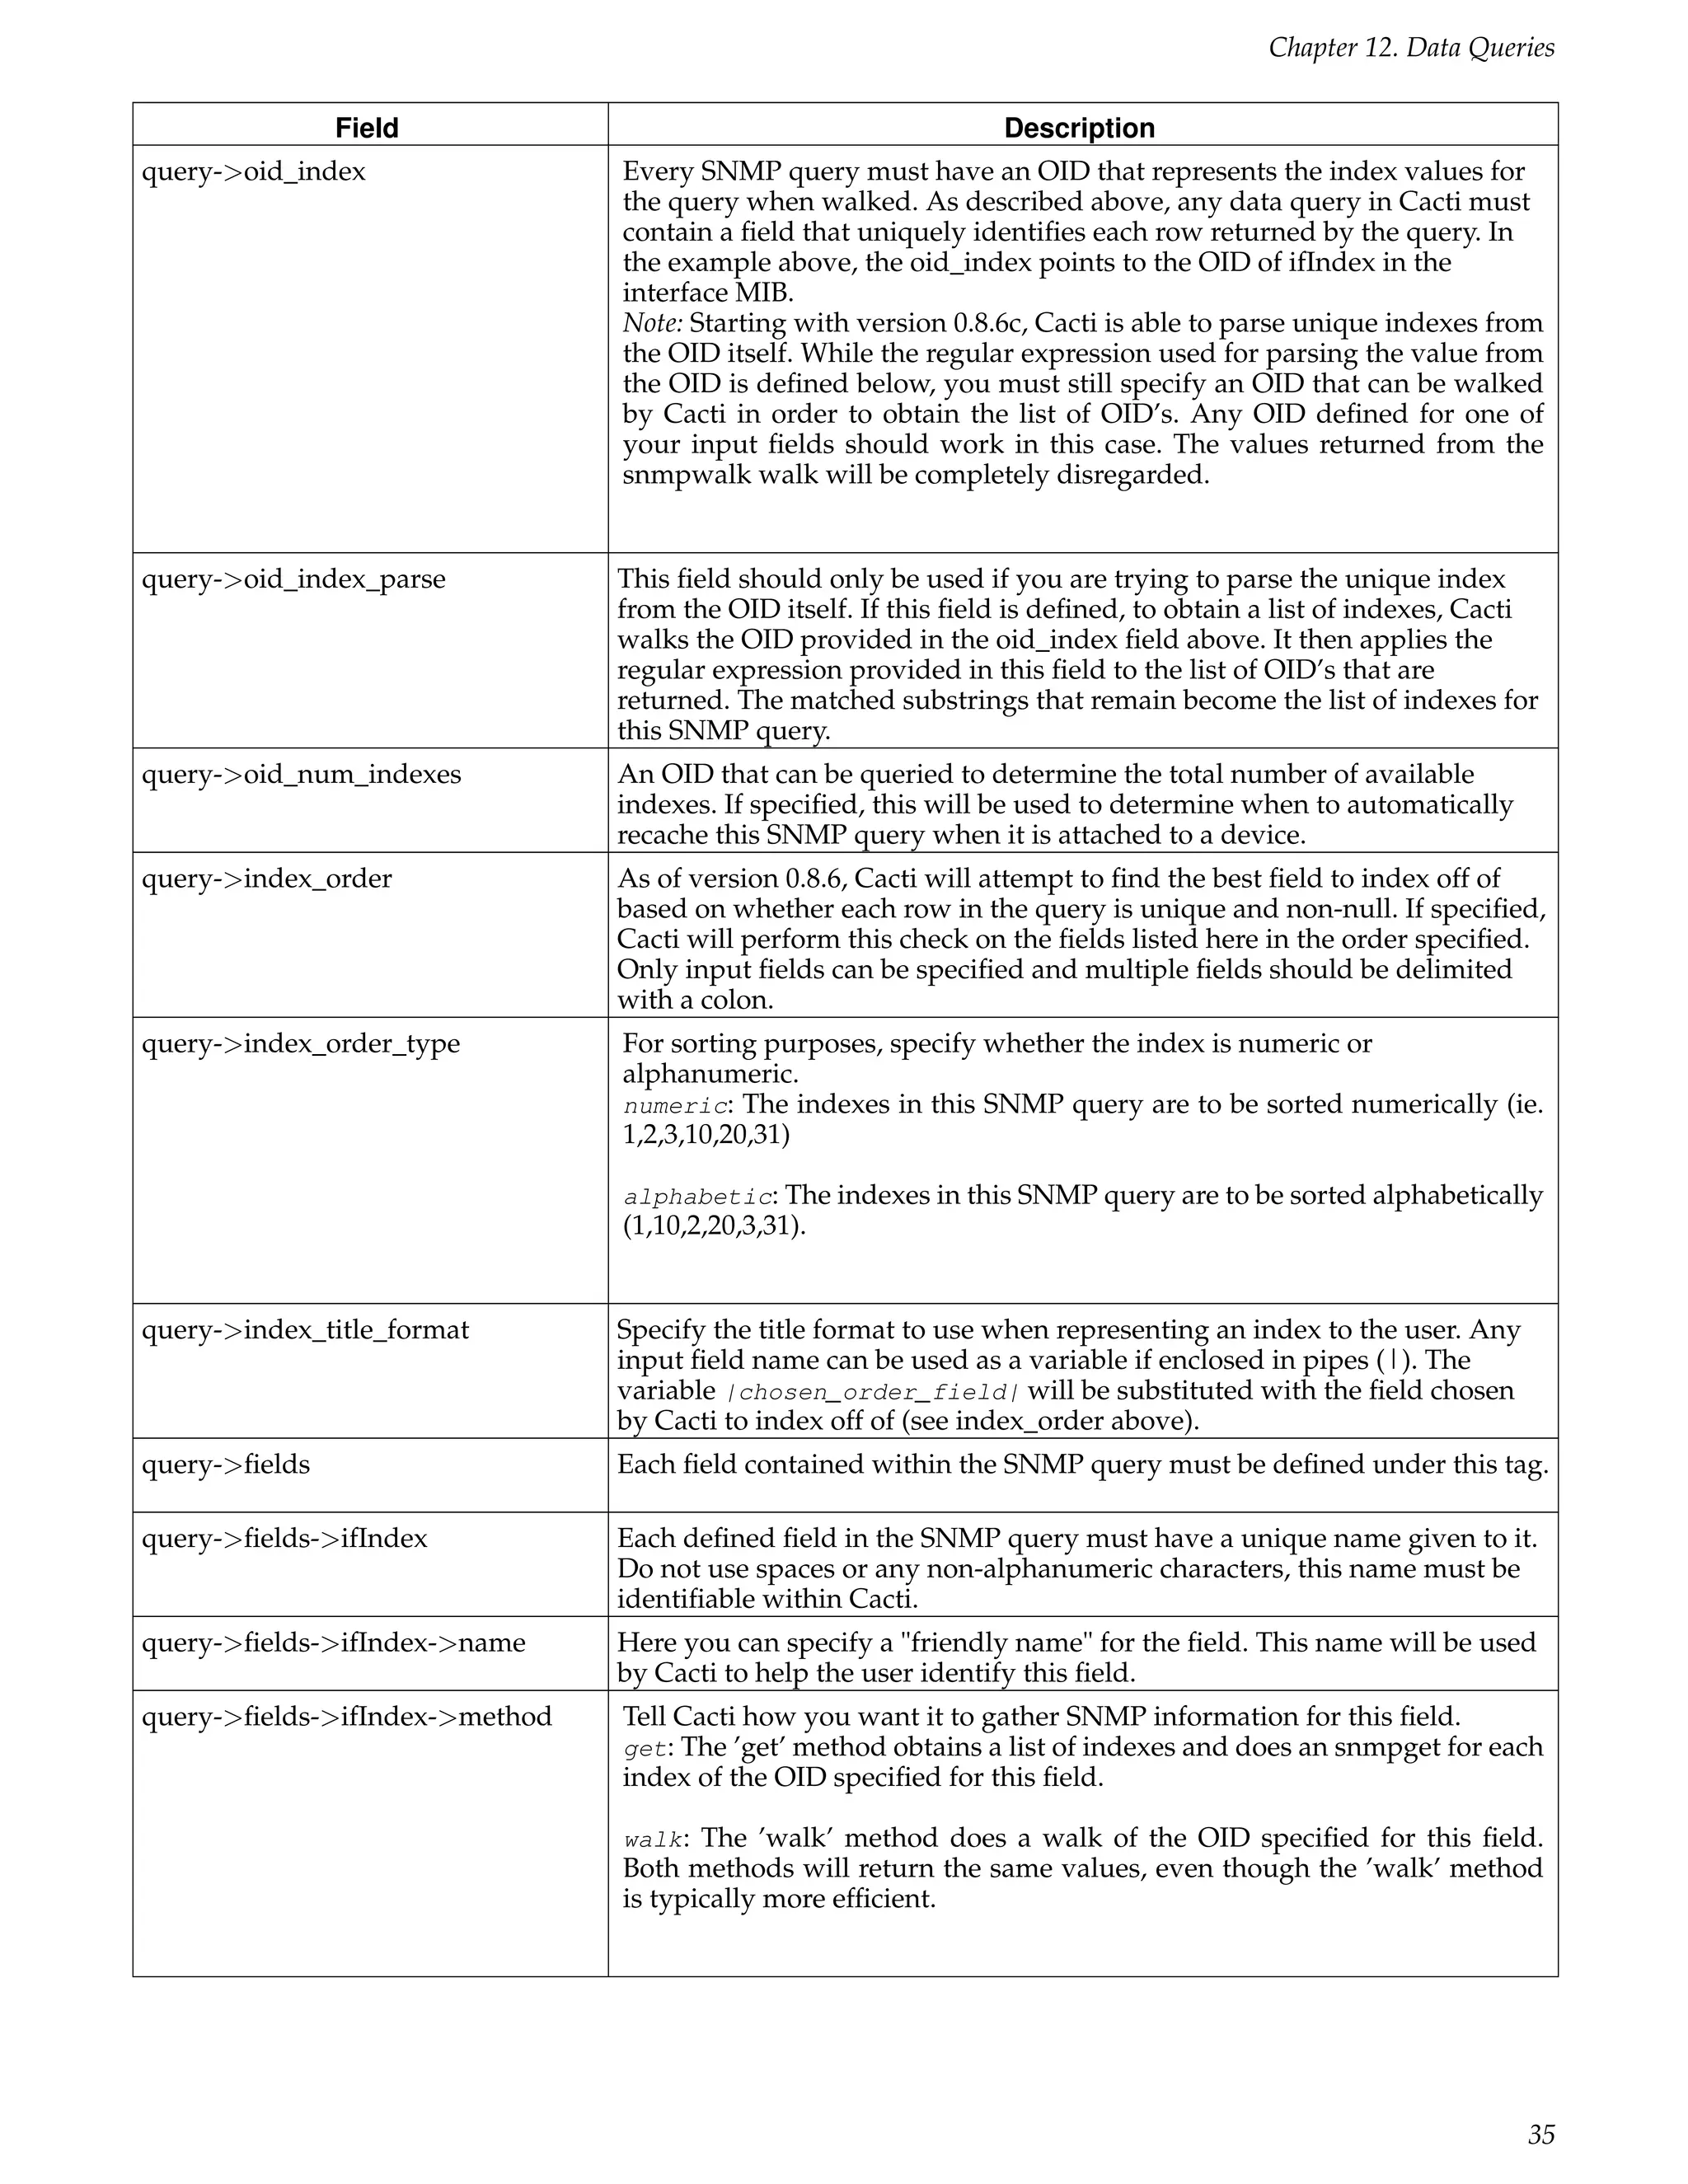
12.2. SNMP Query XML Syntax
<query>
<name>Get SNMP Interfaces</name>
<description>Queries a host for a list of monitorable interfaces</description>
<oid_uptime>.1.3.x.x.x</oid_uptime>
<oid_index>.1.3.6.1.2.1.2.2.1.1</oid_index>
<oid_index_parse>OID/REGEXP:.*.([0-9]{1,3}.[0-9]{1,3})$</oid_index_parse>
<oid_num_indexes>.1.3.6.1.2.1.2.1.0</oid_num_indexes>
<index_order>ifDescr:ifName:ifIndex</index_order>
<index_order_type>numeric</index_order_type>
<index_title_format>|chosen_order_field|</index_title_format>
<fields>
<ifIndex>
<name>Index</name>
<method>walk</method>
<source>value</source>
<direction>input</direction>
<oid>.1.3.6.1.2.1.2.2.1.1</oid>
</ifIndex>
</fields>
</query>
Table 12-3. SNMP Query XML Field Reference
Field Description
query->name (Optional) You can enter a "friendly name" for the SNMP query here. It will
not be used by Cacti, and is for identification only.
query->description (Optional) You can enter a description for the SNMP query here. It will not
be used by Cacti, and is for identification only.
query->oid_uptime New with 0.8.7: If you have another OID that contains timetics, say for
example a Java VM. Then, you can create a data query that specifies an
alternate Uptime OID. To implement this for a data query, simply add the
oid_uptime XML parameter to your XML file. Then, if you select your
re-index method to be Uptime Goes Backaward, Cacti will use that OID to
detect whether it is time to re-index the host instead of the standard snmp
OID for uptime.
34](https://image.slidesharecdn.com/cactimanual-121101075848-phpapp01/75/Cacti-manual-39-2048.jpg)


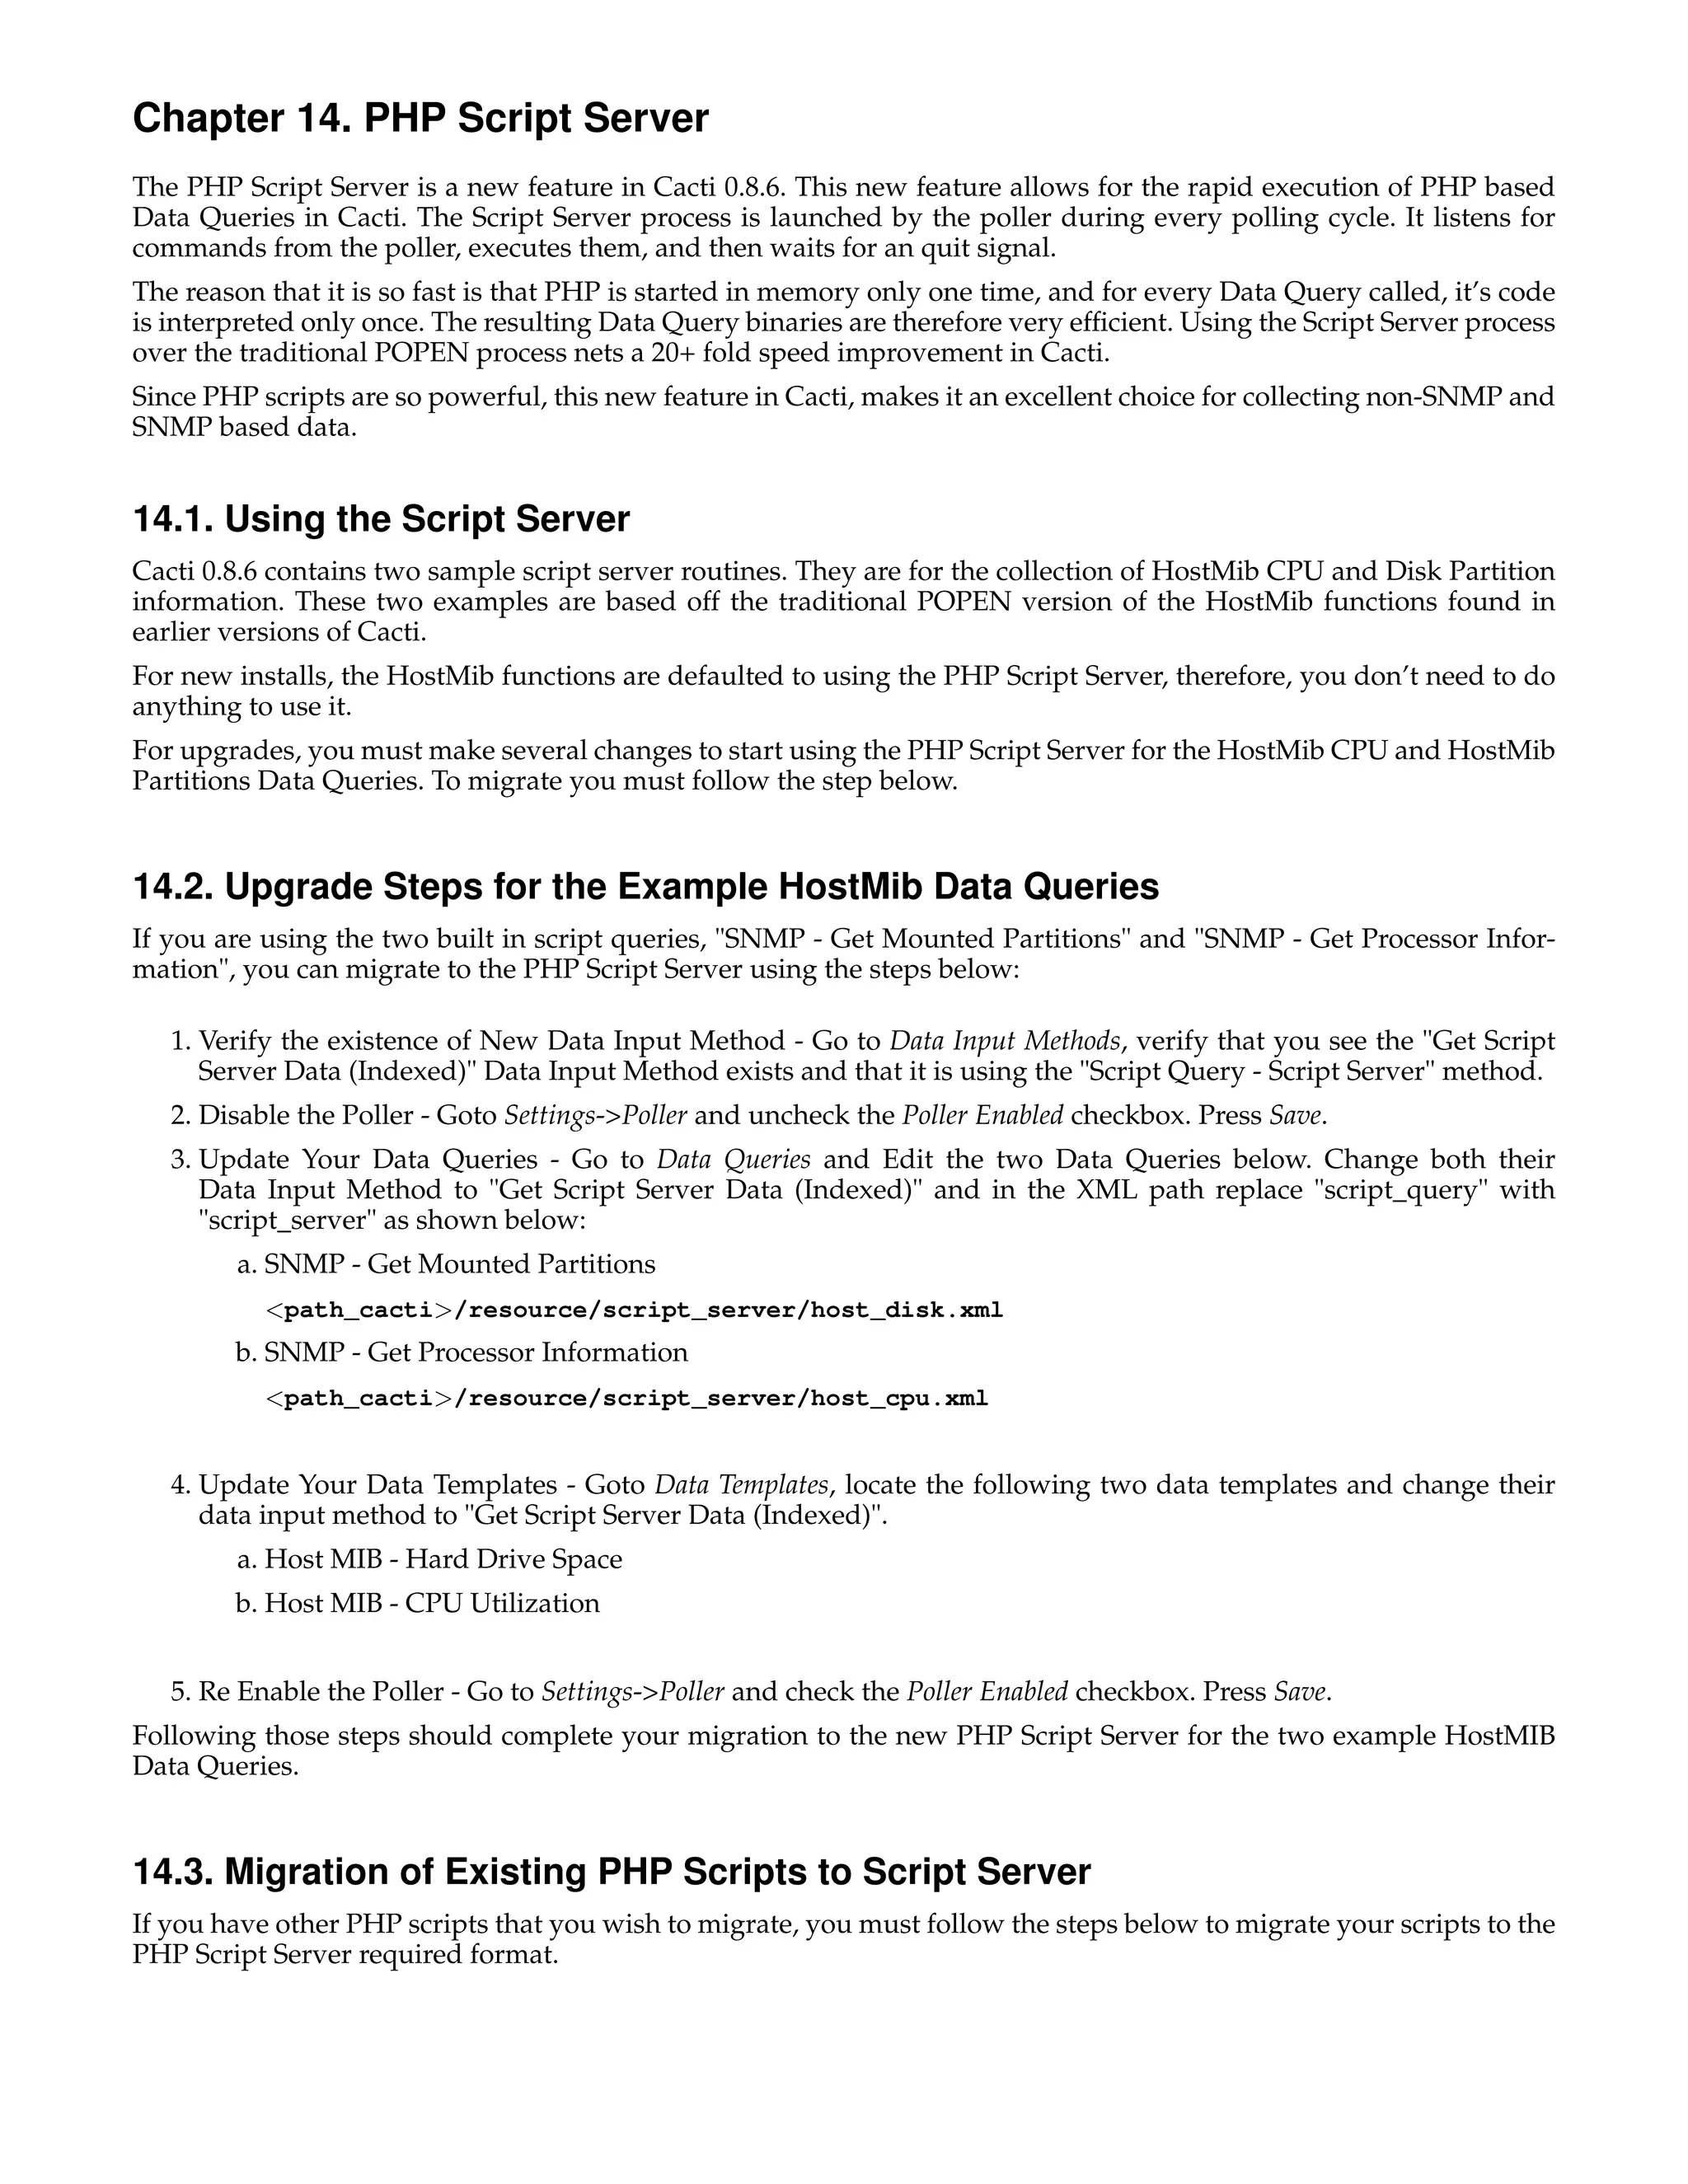
![Chapter 14. PHP Script Server
14.3.1. Script File Changes
Each PHP Script file must be changed to the new Script Server format. The changes are not dramatic, but required for
the proper operation of the PHP Script Server. Follow the steps below to complete.
1. Copy you existing script to a new name. The name must begin "ss_" followed by your script name. The "ss_"
identifies the script as being a script server variety of the a PHP script. For example, if you previously had a
script called "get_mysql_stats.php", it’s new name would be "ss_get_mysql_stats.php".
2. Edit the new PHP script and add the following required lines to the file, where "ss_myfunction" is the same as
your filename.
<?php
$no_http_headers = true;
/* display No errors */
error_reporting(E_ERROR);
include_once(dirname(__FILE__) . "/../include/config.php");
include_once(dirname(__FILE__) . "/../lib/snmp.php");
if (!isset($called_by_script_server)) {
array_shift($_SERVER["argv"]);
print call_user_func_array("ss_myfunction", $_SERVER["argv"]);
}
3. What was originally just mainline code, must be replaced with a function name. For example, if your program
previously contained the following three lines of code:
<?php
$a = 100;
$b = $a / 10;
print $b;
?>
Would become:
function ss_myfunction() {
$a = 100;
$b = $a / 10;
Print $b;
}
4. If you have any additional functions declared within your script file, you must prefix them to make then unique
amongst all functions. Our recommendation would be to prefix all functions with the name of the main func-
tion. For example if you have a function called "meme" you would rename it to "ss_myfunction_meme". This
guarantee’s correct Script Server functionality.
5. The last step is to change the function call that could have traditionally returned the value to the Cacti poller
using the PRINT function. You must change that line or lines in your code to utilize the RETURN function
instead. However, this does not apply to PRINT statements that are not called from the Poller.
14.3.2. XML File Changes
If you are using a "Script Query" type function, then you must also change your XML file. Please reference the XML
files in the <path_cacti>/resource/script_server directory for the specifics related to your required modifica-
tions. However, you may also follow the instructions below:
1. Modify the <script_path> tag. Change it from:
<script_path>|path_php_binary| -q |path_cacti|/scripts/myfucntion.php</script_path>
to simply the following:
<script_path>|path_cacti|/scripts/ss_myfunction.php</script_path>
2. Add the following two XML tags below the <script_path> tag. Replace ss_myfunction with your function name:
<script_function>ss_myfunction</script_function>
<script_server>php</script_server>
3. Save the XML file.
49](https://image.slidesharecdn.com/cactimanual-121101075848-phpapp01/75/Cacti-manual-54-2048.jpg)
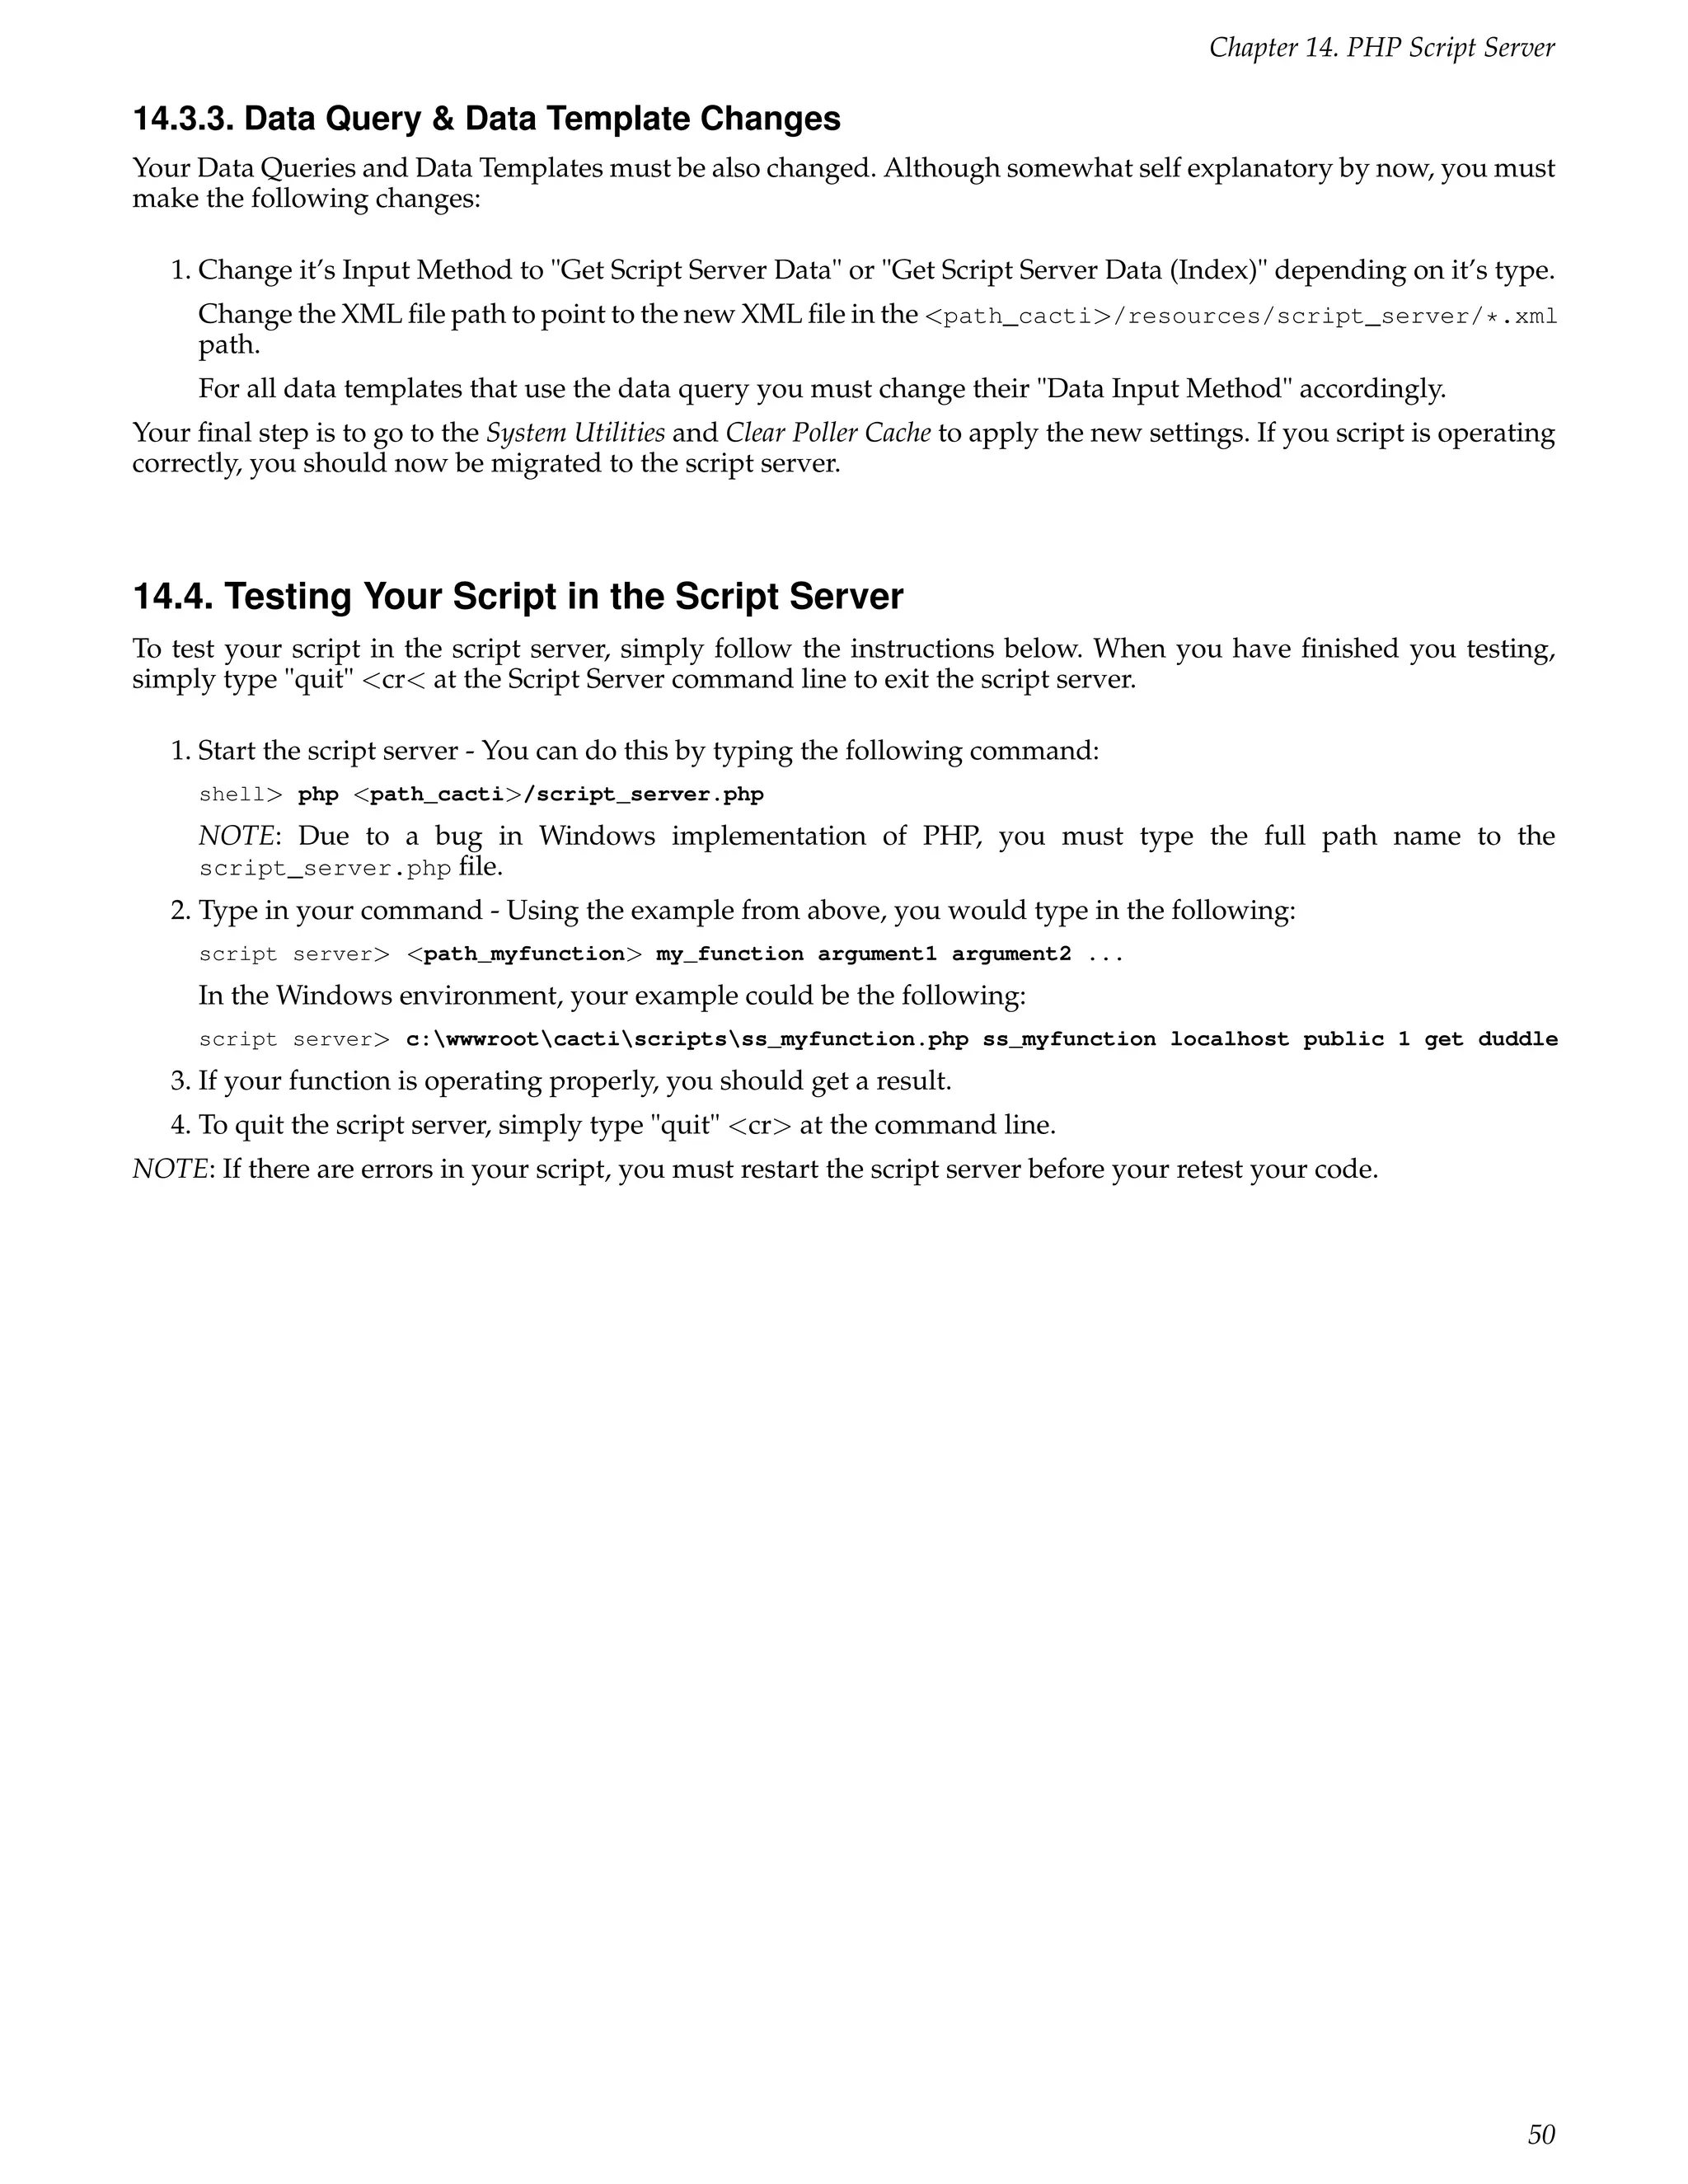
![Chapter 16. How To
16.1. Simplest Method of Going from Script to Graph (Walkthrough)
Written by Kevin der Kinderen, http://kdeuja.com/~kevin/
This HOWTO walks you through the simplest steps of graphing the output of a single value from a script. As a
new user of cacti, I had a difficult time understanding how to graph anything that wasn’t canned with the original
load. After a lot of playing around, I came up with these procedures which can be built upon for more sophisticated
collections and graphs.
I do not use templates in this HOWTO. Templates provide a significant advantage if you are graphing the output for
multiple instances or creating graphs for multiple hosts. They help to maintain consistency and simplify setup.
The example here is not realistic, but can be used and expanded upon as a model for creating your own graphs.
I’ve not put a lot of explanations in the procedures. Refer to the Cacti manual for more details.
Have a tested script ready to go. I used the following script located in /home/cactiuser/bin called random2.pl:
#!/usr/bin/perl -w
print int(rand(10));
This script simply prints out a random integer between 0 and 9 every time it’s called.
The minimal steps to create a graph from a script are simply:
1. Create a Data Input Method to tell Cacti how to call the script and what to expect from it.
2. Create a Data Source to tell cacti how and where the data will be stored.
3. Create a Graph to tell cacti how the data will be presented in graph form.
4. Add Graph to Graph View so you can view the graph.
5. View the Graph
The details are below:
1. Create Data Input Method
• Click the Console tab at the top
• Click Data Input Methods under Management
• Click Add
• Name: Random 2 Input
• Input Type: Script/Command
• Input String: /home/cactiuser/bin/random2.pl
• Click Create
• Should see "Save Successful." at the top of the page.
• Click Add by Output Fields (there are no input fields for this example)
• Field [Output]: random_number
• Friendly Name: Random Number
• Update RRD File: checked
• Click Create
• Should see "Save Successful." and random_number listed under Output Fields.
• Click Save
• Should see "Save Successful." and Random Input listed in Data Input Methods.
2. Create a Data Source
• Click Data Sources under Management](https://image.slidesharecdn.com/cactimanual-121101075848-phpapp01/75/Cacti-manual-57-2048.jpg)

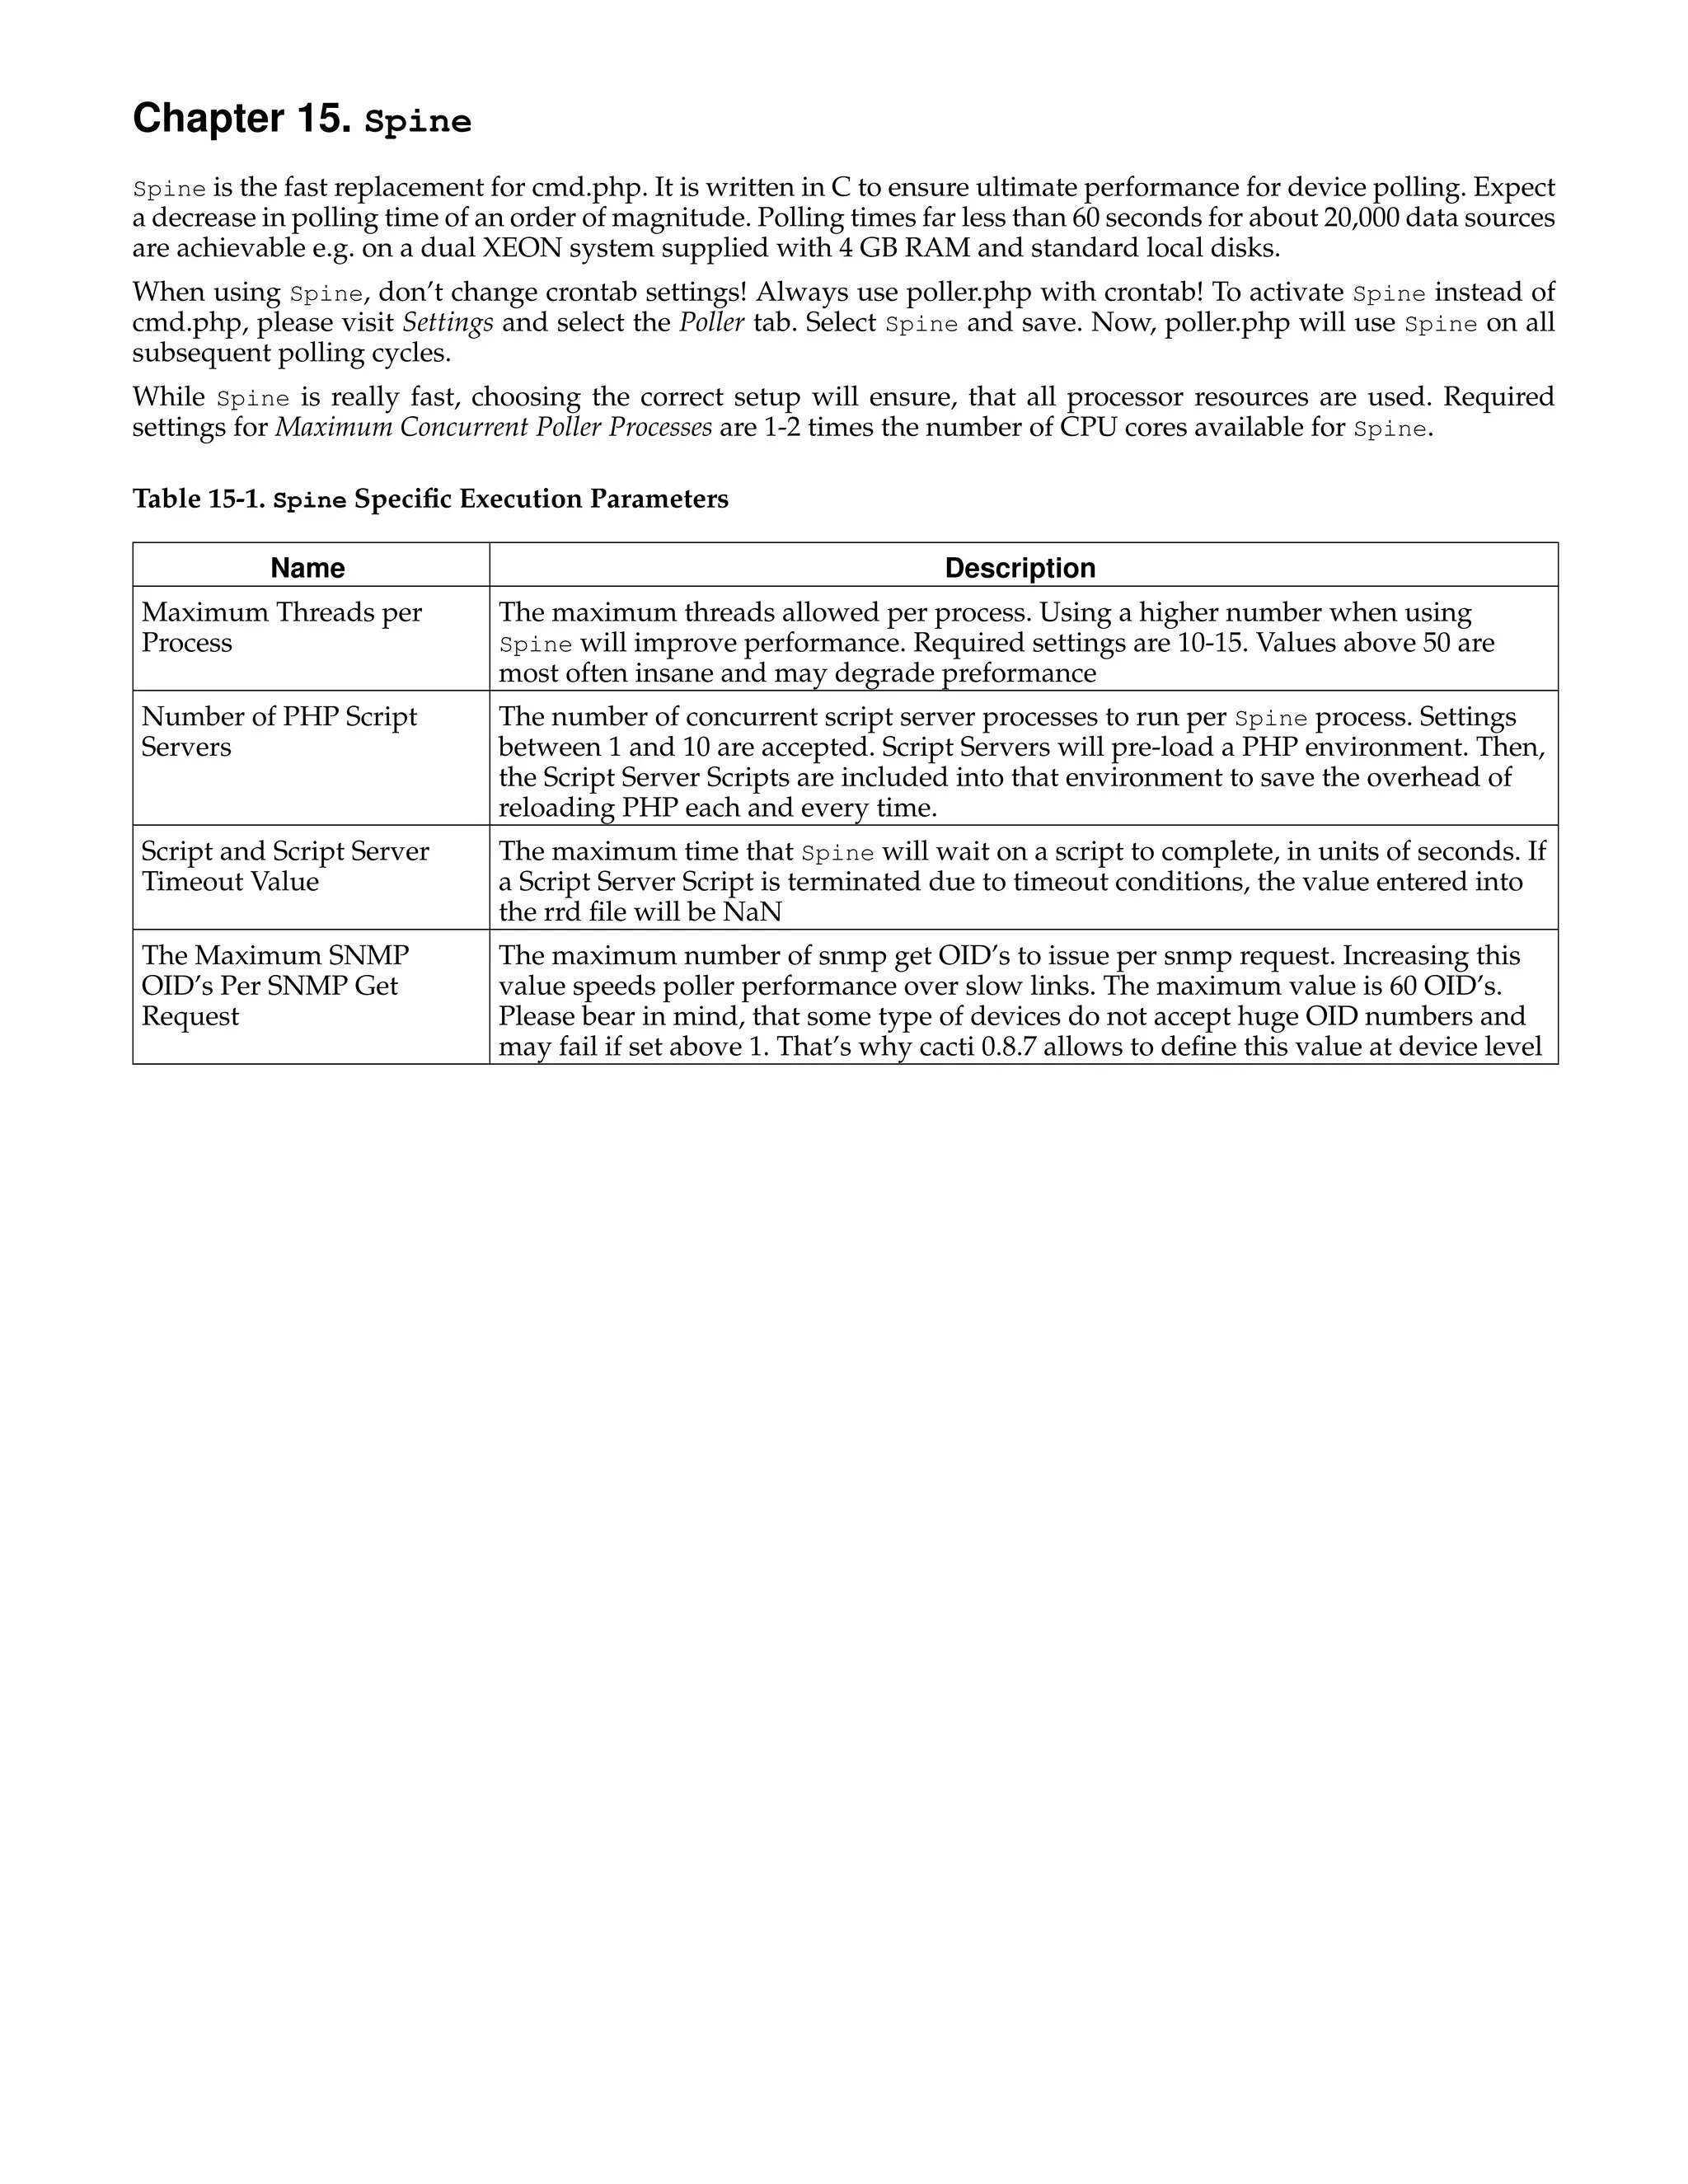
![Chapter 16. How To
• If you click "Turn On Graph Debug Mode." now you will see: "Error: can’t make a graph without contents."
We need to add Graph Items:
• Click Add by Graph Items
• Data Source: (from list) No Host - random2ds (random_number)
• Color: 0000FF (Blue)
• Graph Item Type: LINE2
• Consolidation Function: AVERAGE
• CDEF Function: None
• Value: blank
• GPRINT Type: Normal
• Text Format: blank
• Insert Hard Return: unchecked
• Click Create
• Should see "Save Successful.", Item #1 listed and a graph under debug (probably with nothing in it yet)
• To add a legend, click Add by Graph Items again
• Data Source: No Host - random2ds (random_number)
• Color: None
• Graph Item Type: GPRINT
• Consolidation Function: LAST
• CDEF Function: None
• Value: blank
• GPRINT Type: Normal
• Text Format: Cur:
• Insert Hard Return: unchecked
• Click Create
• Should see "Save Successful." and the graph will have a legend showing the current value. Note: your integer
random number has been averaged over the past 5 minutes. At the bottom of the page, click save.
• At the bottom of the page, click Save.
• Should see "Save Successful." and your graph listed.
4. Add graph to the graph view
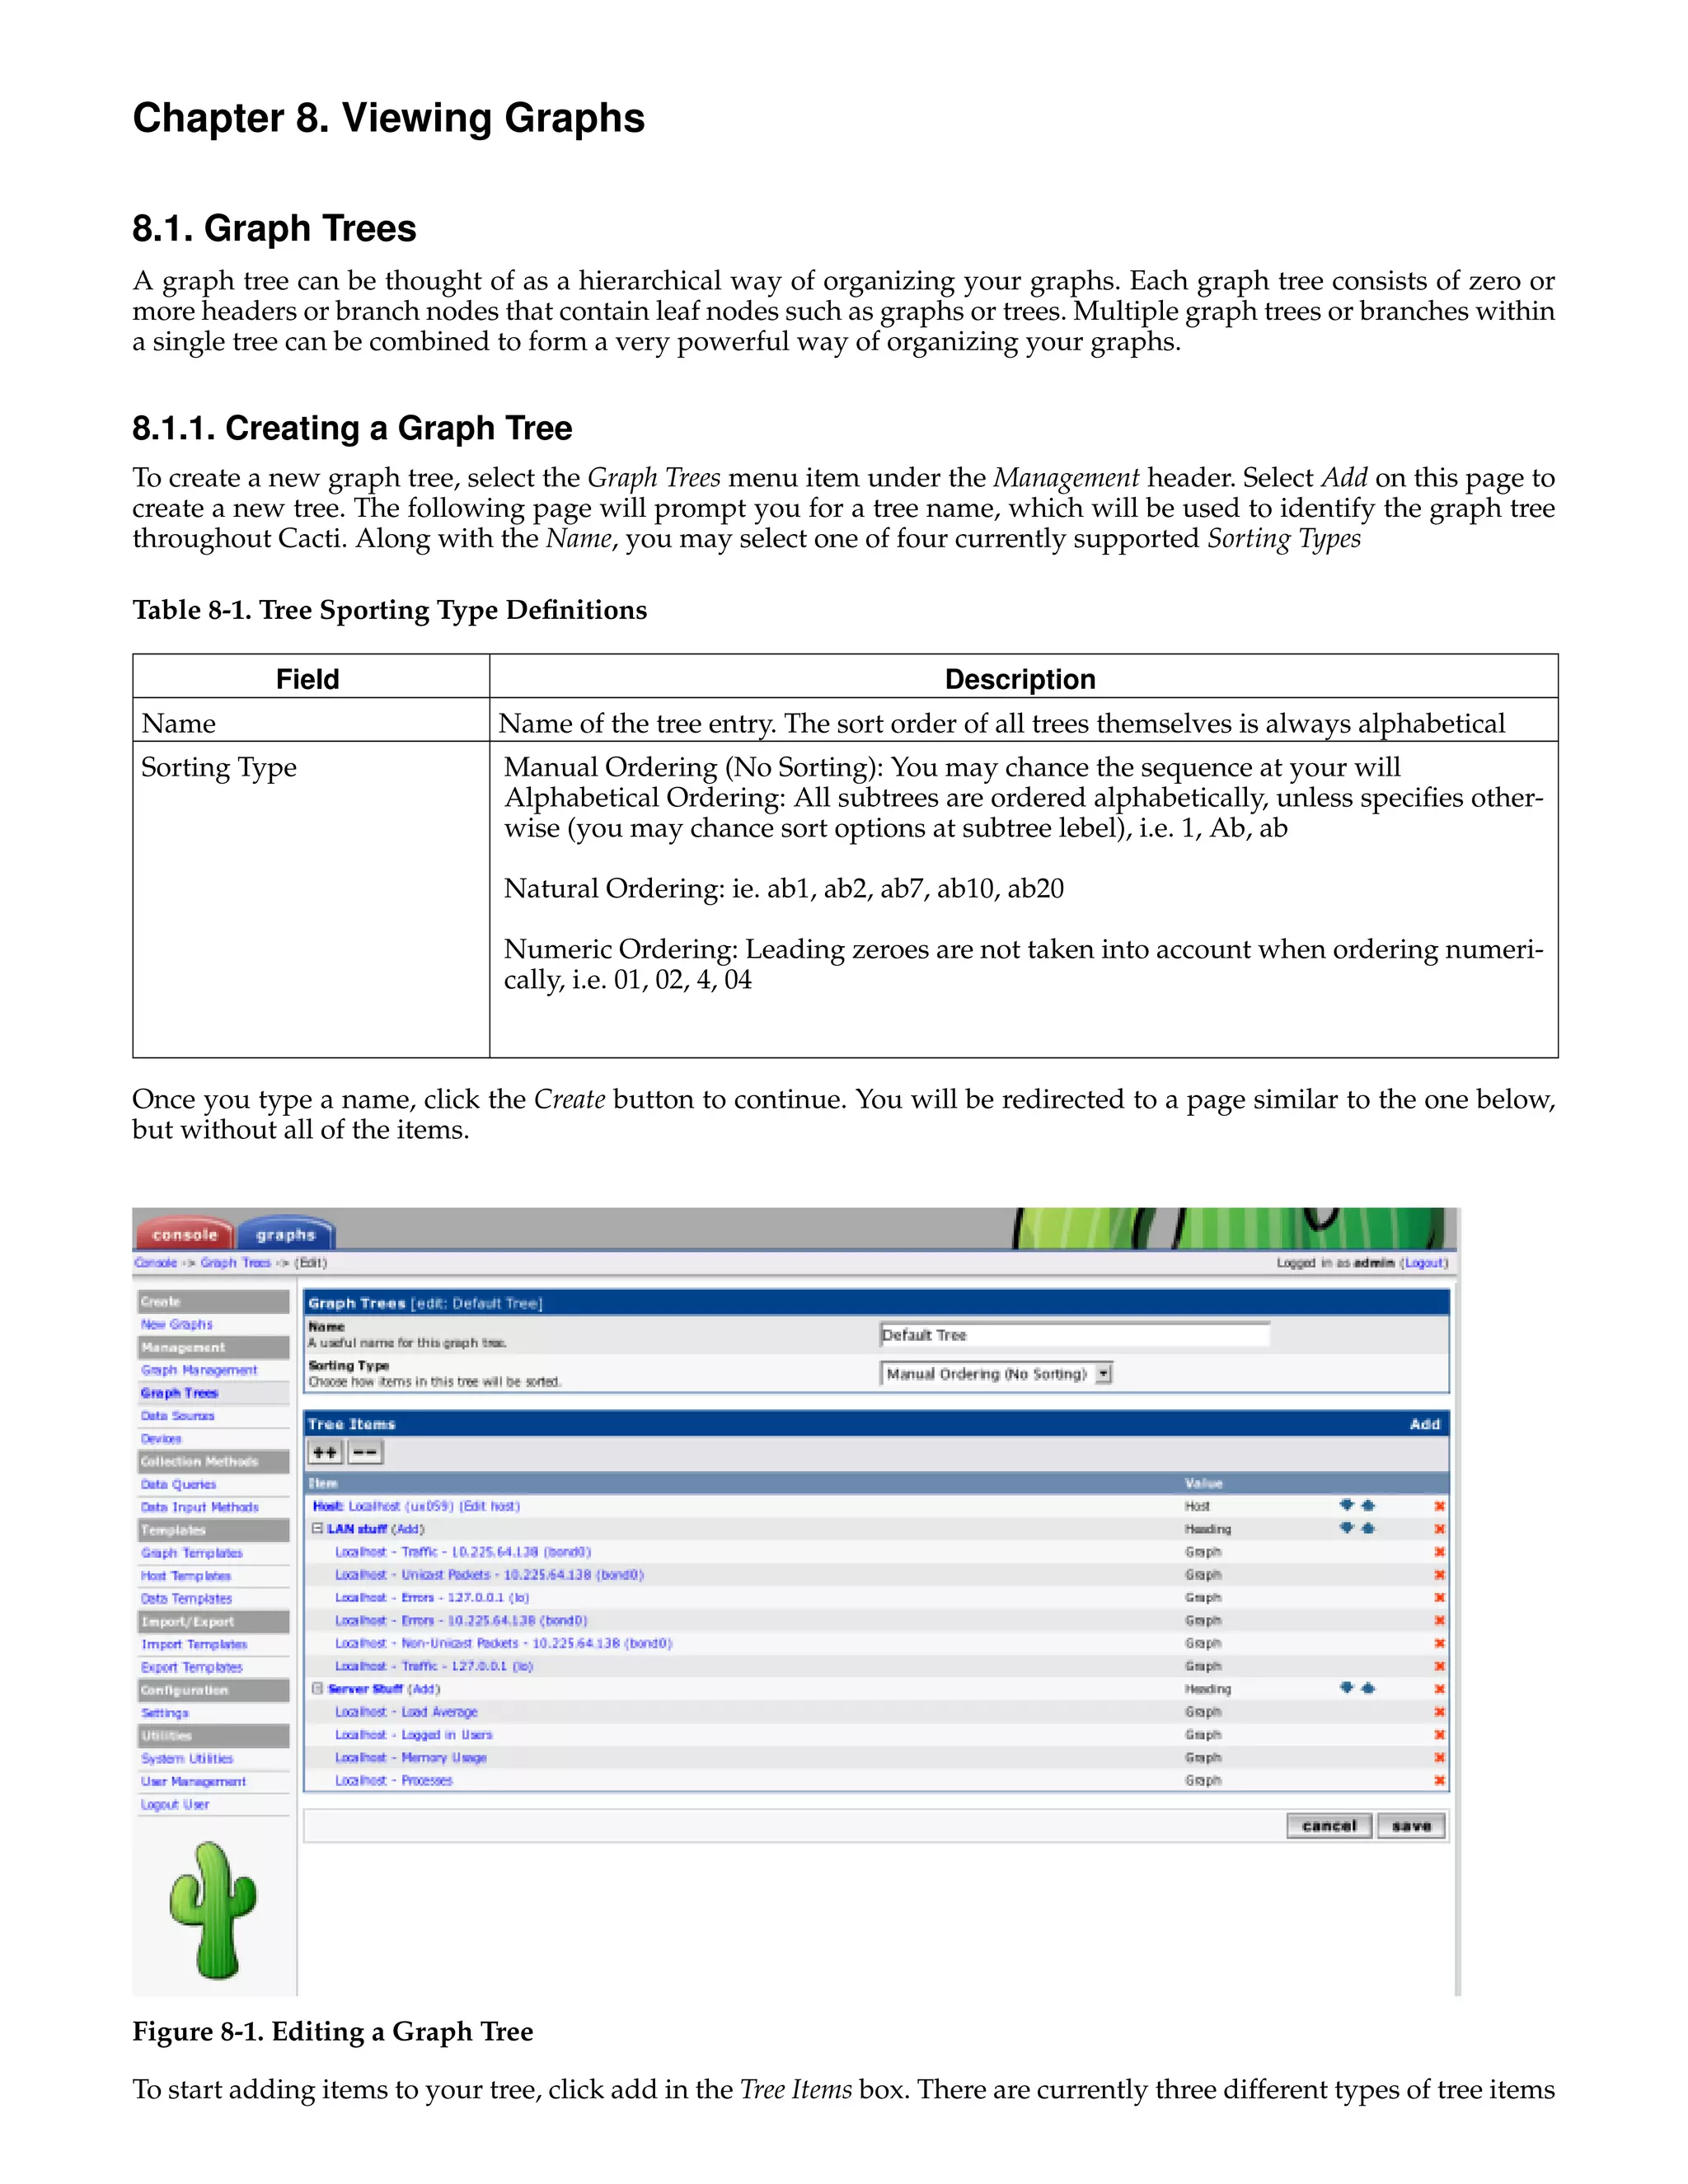
• Click Graph Trees under Management
• We’ll create a tree called "test" to place our graph
• Click Add
• Name: test
• Should see "Save Successful"
• Click Add beside Tree Items (to add our graph to this tree)
• Under Tree Items [graph]...
• Graph: RANDOM NUMBERS (we named this in step 3)
• Round Robin Archive: Daily (5 Minute Average)
• Click Create
• Should see "Save Successful." and RANDOM NUMBERS listed under Tree Items
• Click Save
• Should see "Save Successful." and test listed under Graph Trees
5. View Graph
54](https://image.slidesharecdn.com/cactimanual-121101075848-phpapp01/75/Cacti-manual-59-2048.jpg)
![Chapter 16. How To
• Select Graphs tab
• Select tree view (Tree beside settings tab)
• Select test tree on left
• You may see "Random Graph" but no graph. It takes two or three polls (10 - 15 minutes) to see a graph. I
believe poll 1 to create the rrd, poll 2 to get the first data point and poll 3 to have graphable points.
• While waiting, you can click the RANDOM NUMBERS graph. You’ll see place holders for 4 graphs. Select
[source] under Daily (5 Minute Average). You’ll see the source for the call to rrdtool graph. Give it a sanity
check.
• Now be patient. Hit your refresh button every few minutes. After the first poll I got a few empty graphs. A
few minutes later data started showing up.
Notes
1. http://kdeuja.com/~kevin/
55](https://image.slidesharecdn.com/cactimanual-121101075848-phpapp01/75/Cacti-manual-60-2048.jpg)
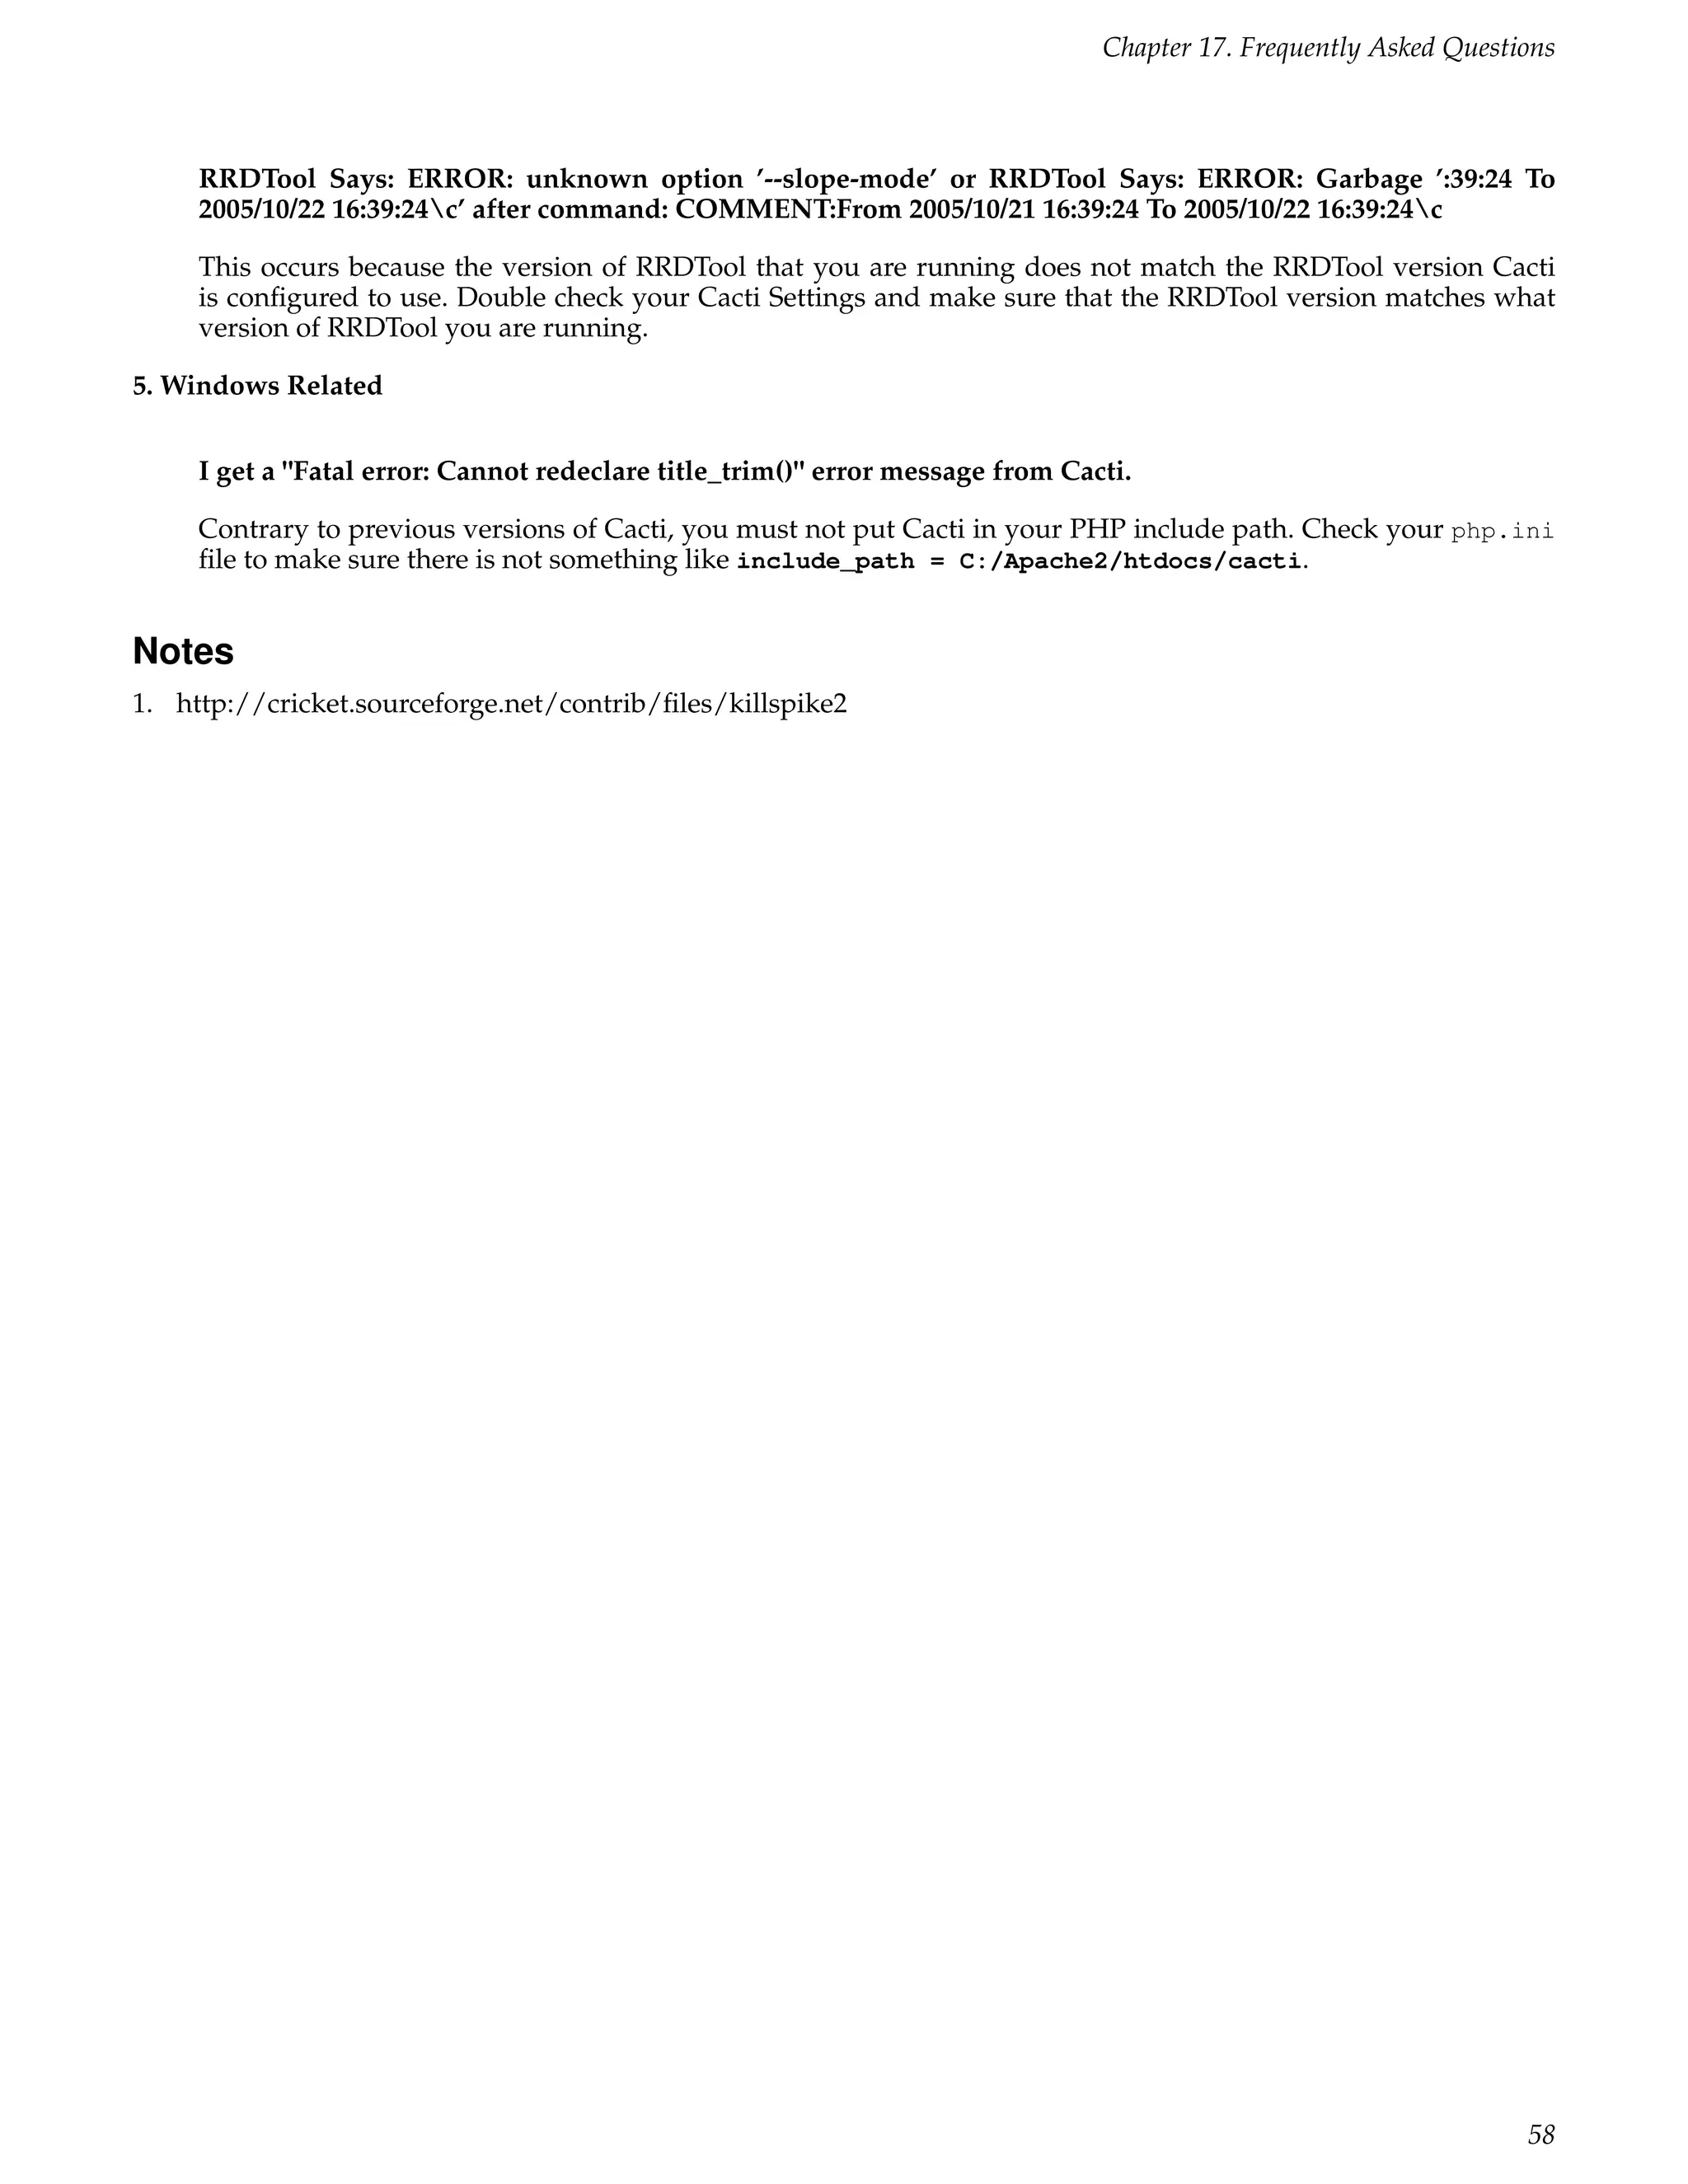
![Chapter 17. Frequently Asked Questions
1. Using Cacti
How do I create traffic graphs?
Before you can create traffic graphs, Cacti must have working SNMP support. One way to do this is to compile
PHP with SNMP support built in, many times you can install the ’php-snmp’ package to do this. The second
option is to have Cacti call the snmpget and snmpwalk binaries from your ucd-snmp or net-snmp installation.
You can use the about page to determine whether to are using "built-in" or "external" SNMP support.
Now that you have working SNMP support, follow these steps.
1. Click Devices on Cacti’s menu.
2. Click Add to add a new device.
3. Type a description, hostname, management IP, and SNMP community. Make sure to select "Generic SNMP-
enabled Host" under Host Template and click Create.
4. Click Create Graphs for this Host at the top of the page.
5. You should see one or more interfaces listed under the Data Query [SNMP - Interface Statistics] box. Place a
check next to each interface that you want to graph. Below the box, select type of graph that you want to
create (bits, bytes, summation, etc).
6. Click Create, and Create again on the following screen to create your graphs.
2. General
I get a "Undefined variable: _SERVER" error message from Cacti.
Cacti 0.8.6 and above requires that you have at least PHP 4.1 or greater installed.
I get a "Call to undefined function: mysql_connect()" error message from Cacti.
Your installation of PHP does not have MySQL installed or enabled. On binary-based distributions, make sure
you have the ’php-mysql’ package installed. Also make sure that ’extension=mysql.so’ is uncommented in your
php.ini file.
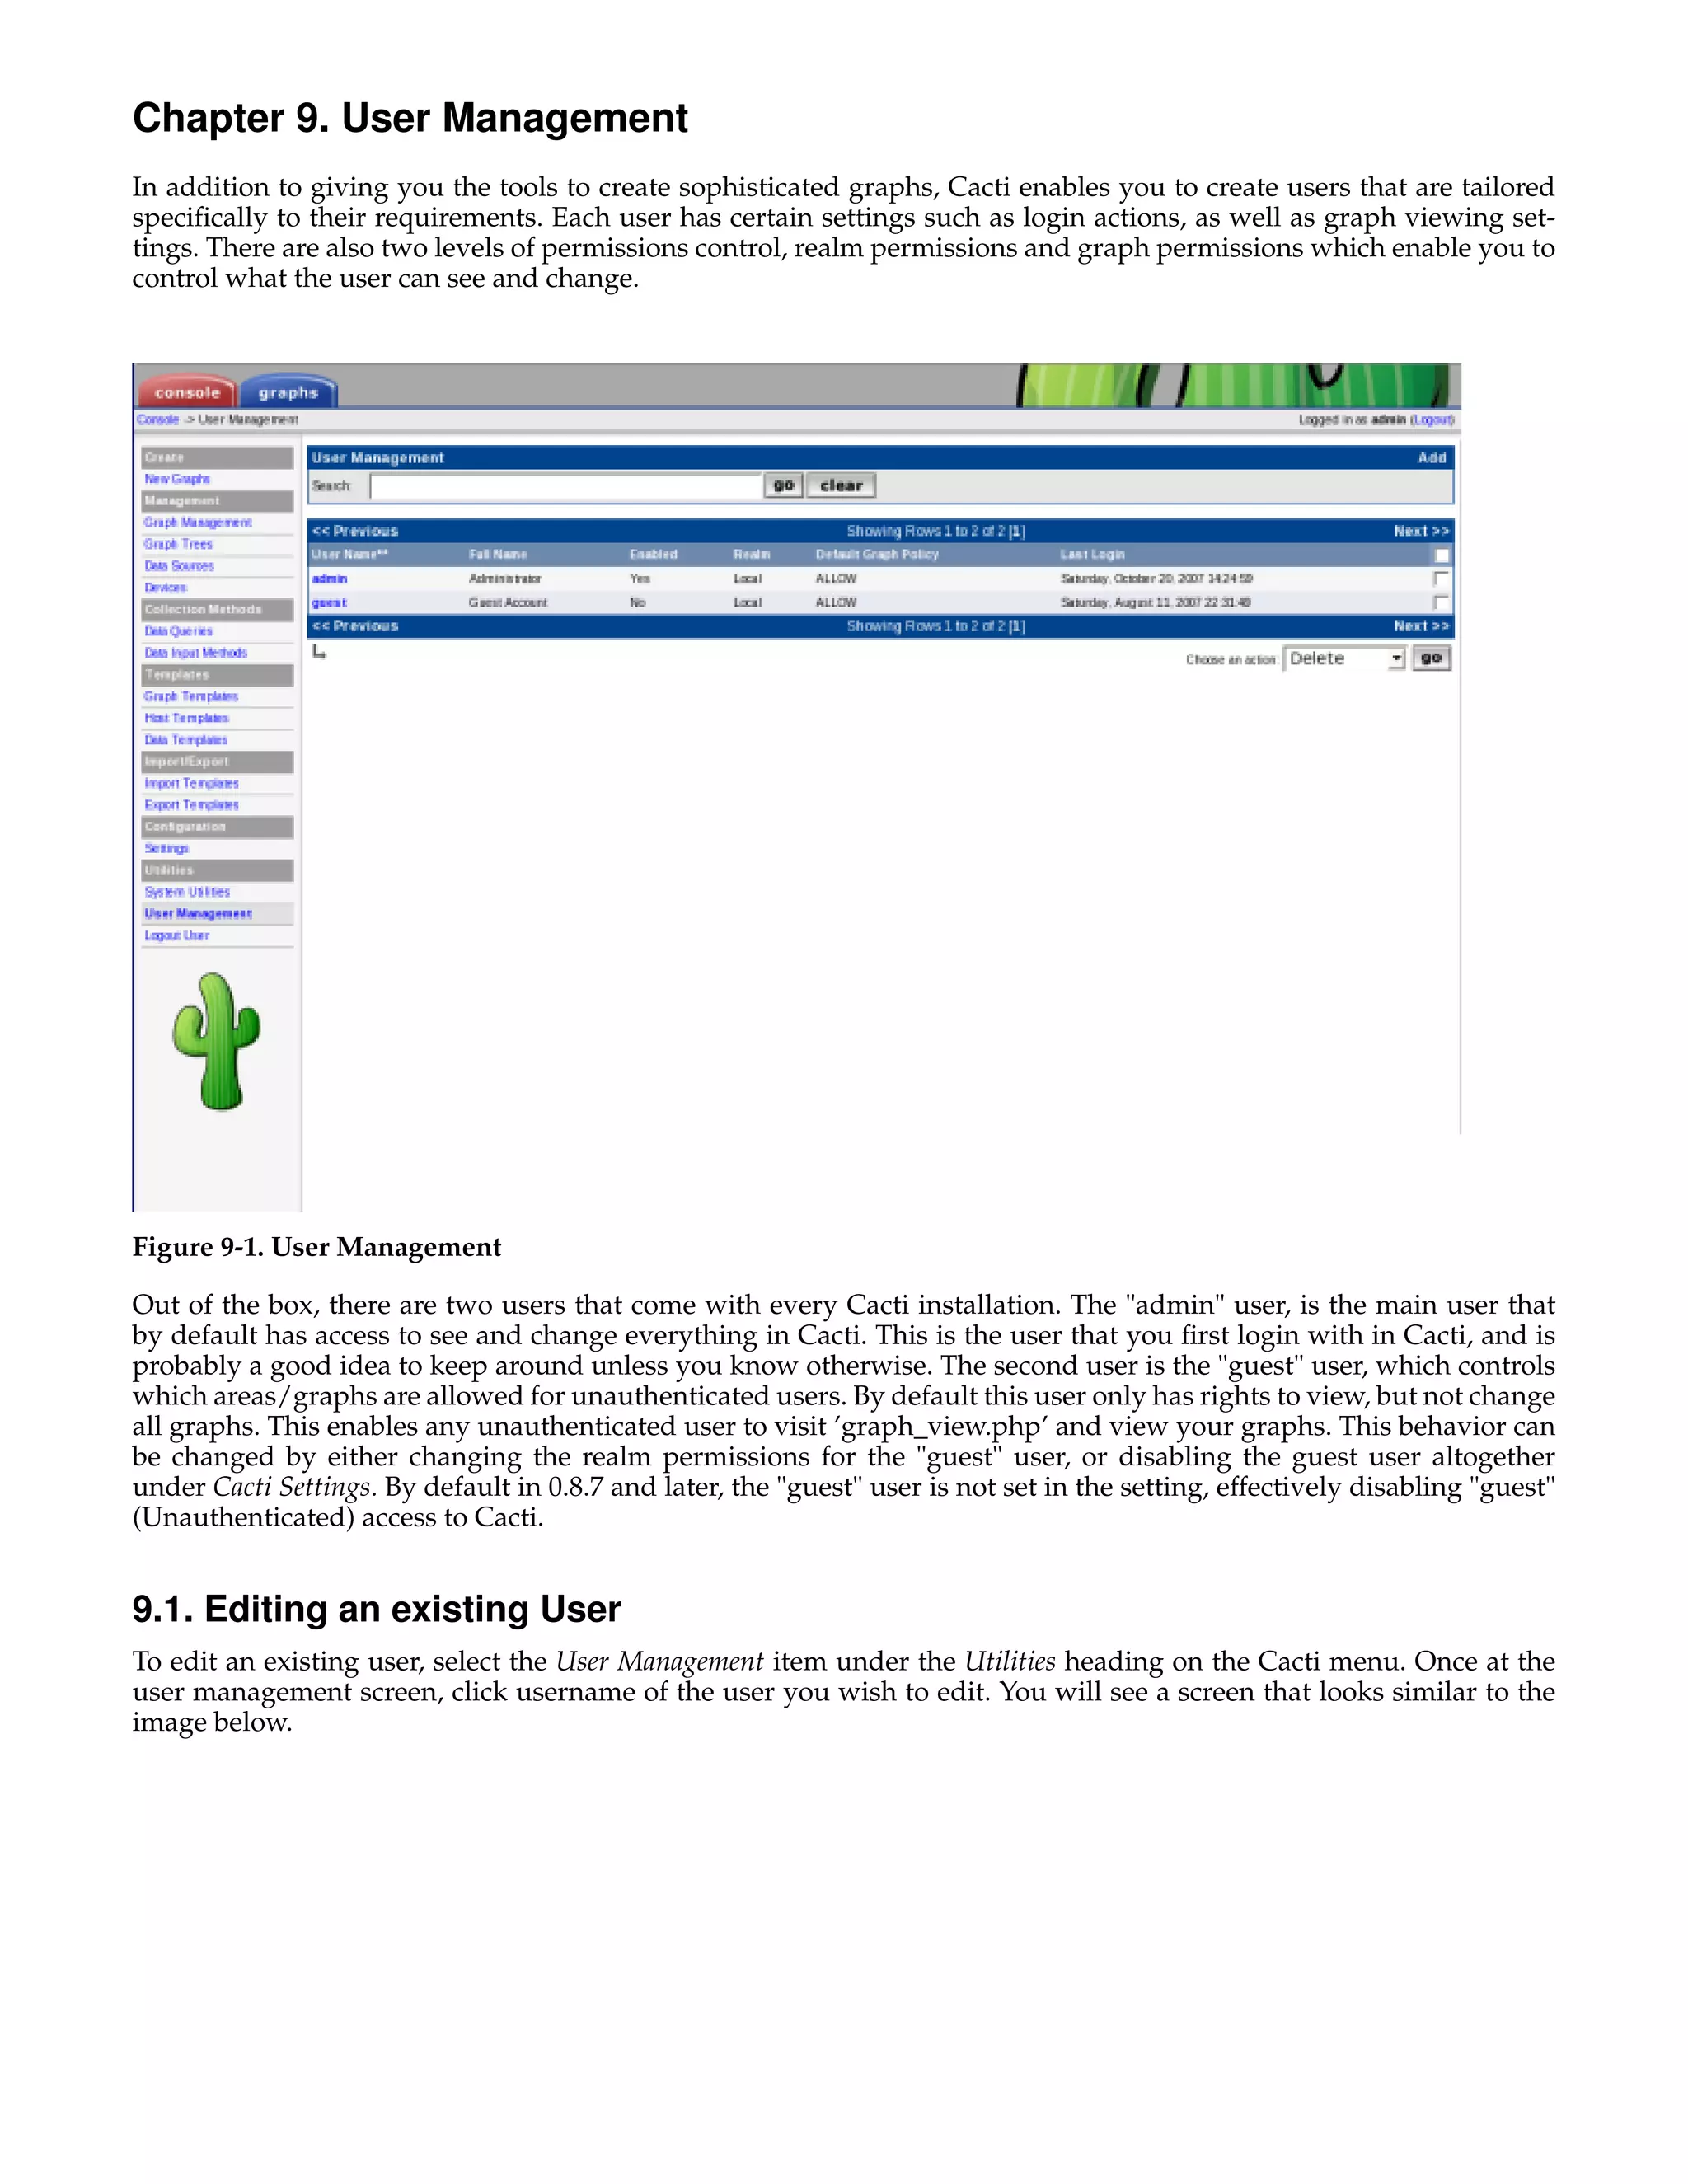
I have forgotten my ’admin’ password to Cacti, how do I reset it?
To reset the admin account password back to the default of ’admin’, connect to your Cacti database at the com-
mand line.
shell> mysql -u root -p cacti
Now execute the following SQL:
mysql> update user_auth set password=md5(’admin’) where username=’admin’;
3. Monitoring
I am polling thousands of items and poller.php takes more than 5 minutes to run.
Give Spine, the fast replacement for poller.php a try. Unlike poller.php, Spine is written in c and makes use of
pthreads. On a typical installation, it is not uncommon for Spine to poll about 500 items in less then 10 seconds.
I changed x, and now some of my graphs are not updating.
The best thing to do here is to force Cacti to rebuild its poller cache. To do this click Utilities on the Cacti menu,
and select Clear Poller Cache.
I am using Redhat 8.0 and SNMP is not working.](https://image.slidesharecdn.com/cactimanual-121101075848-phpapp01/75/Cacti-manual-61-2048.jpg)

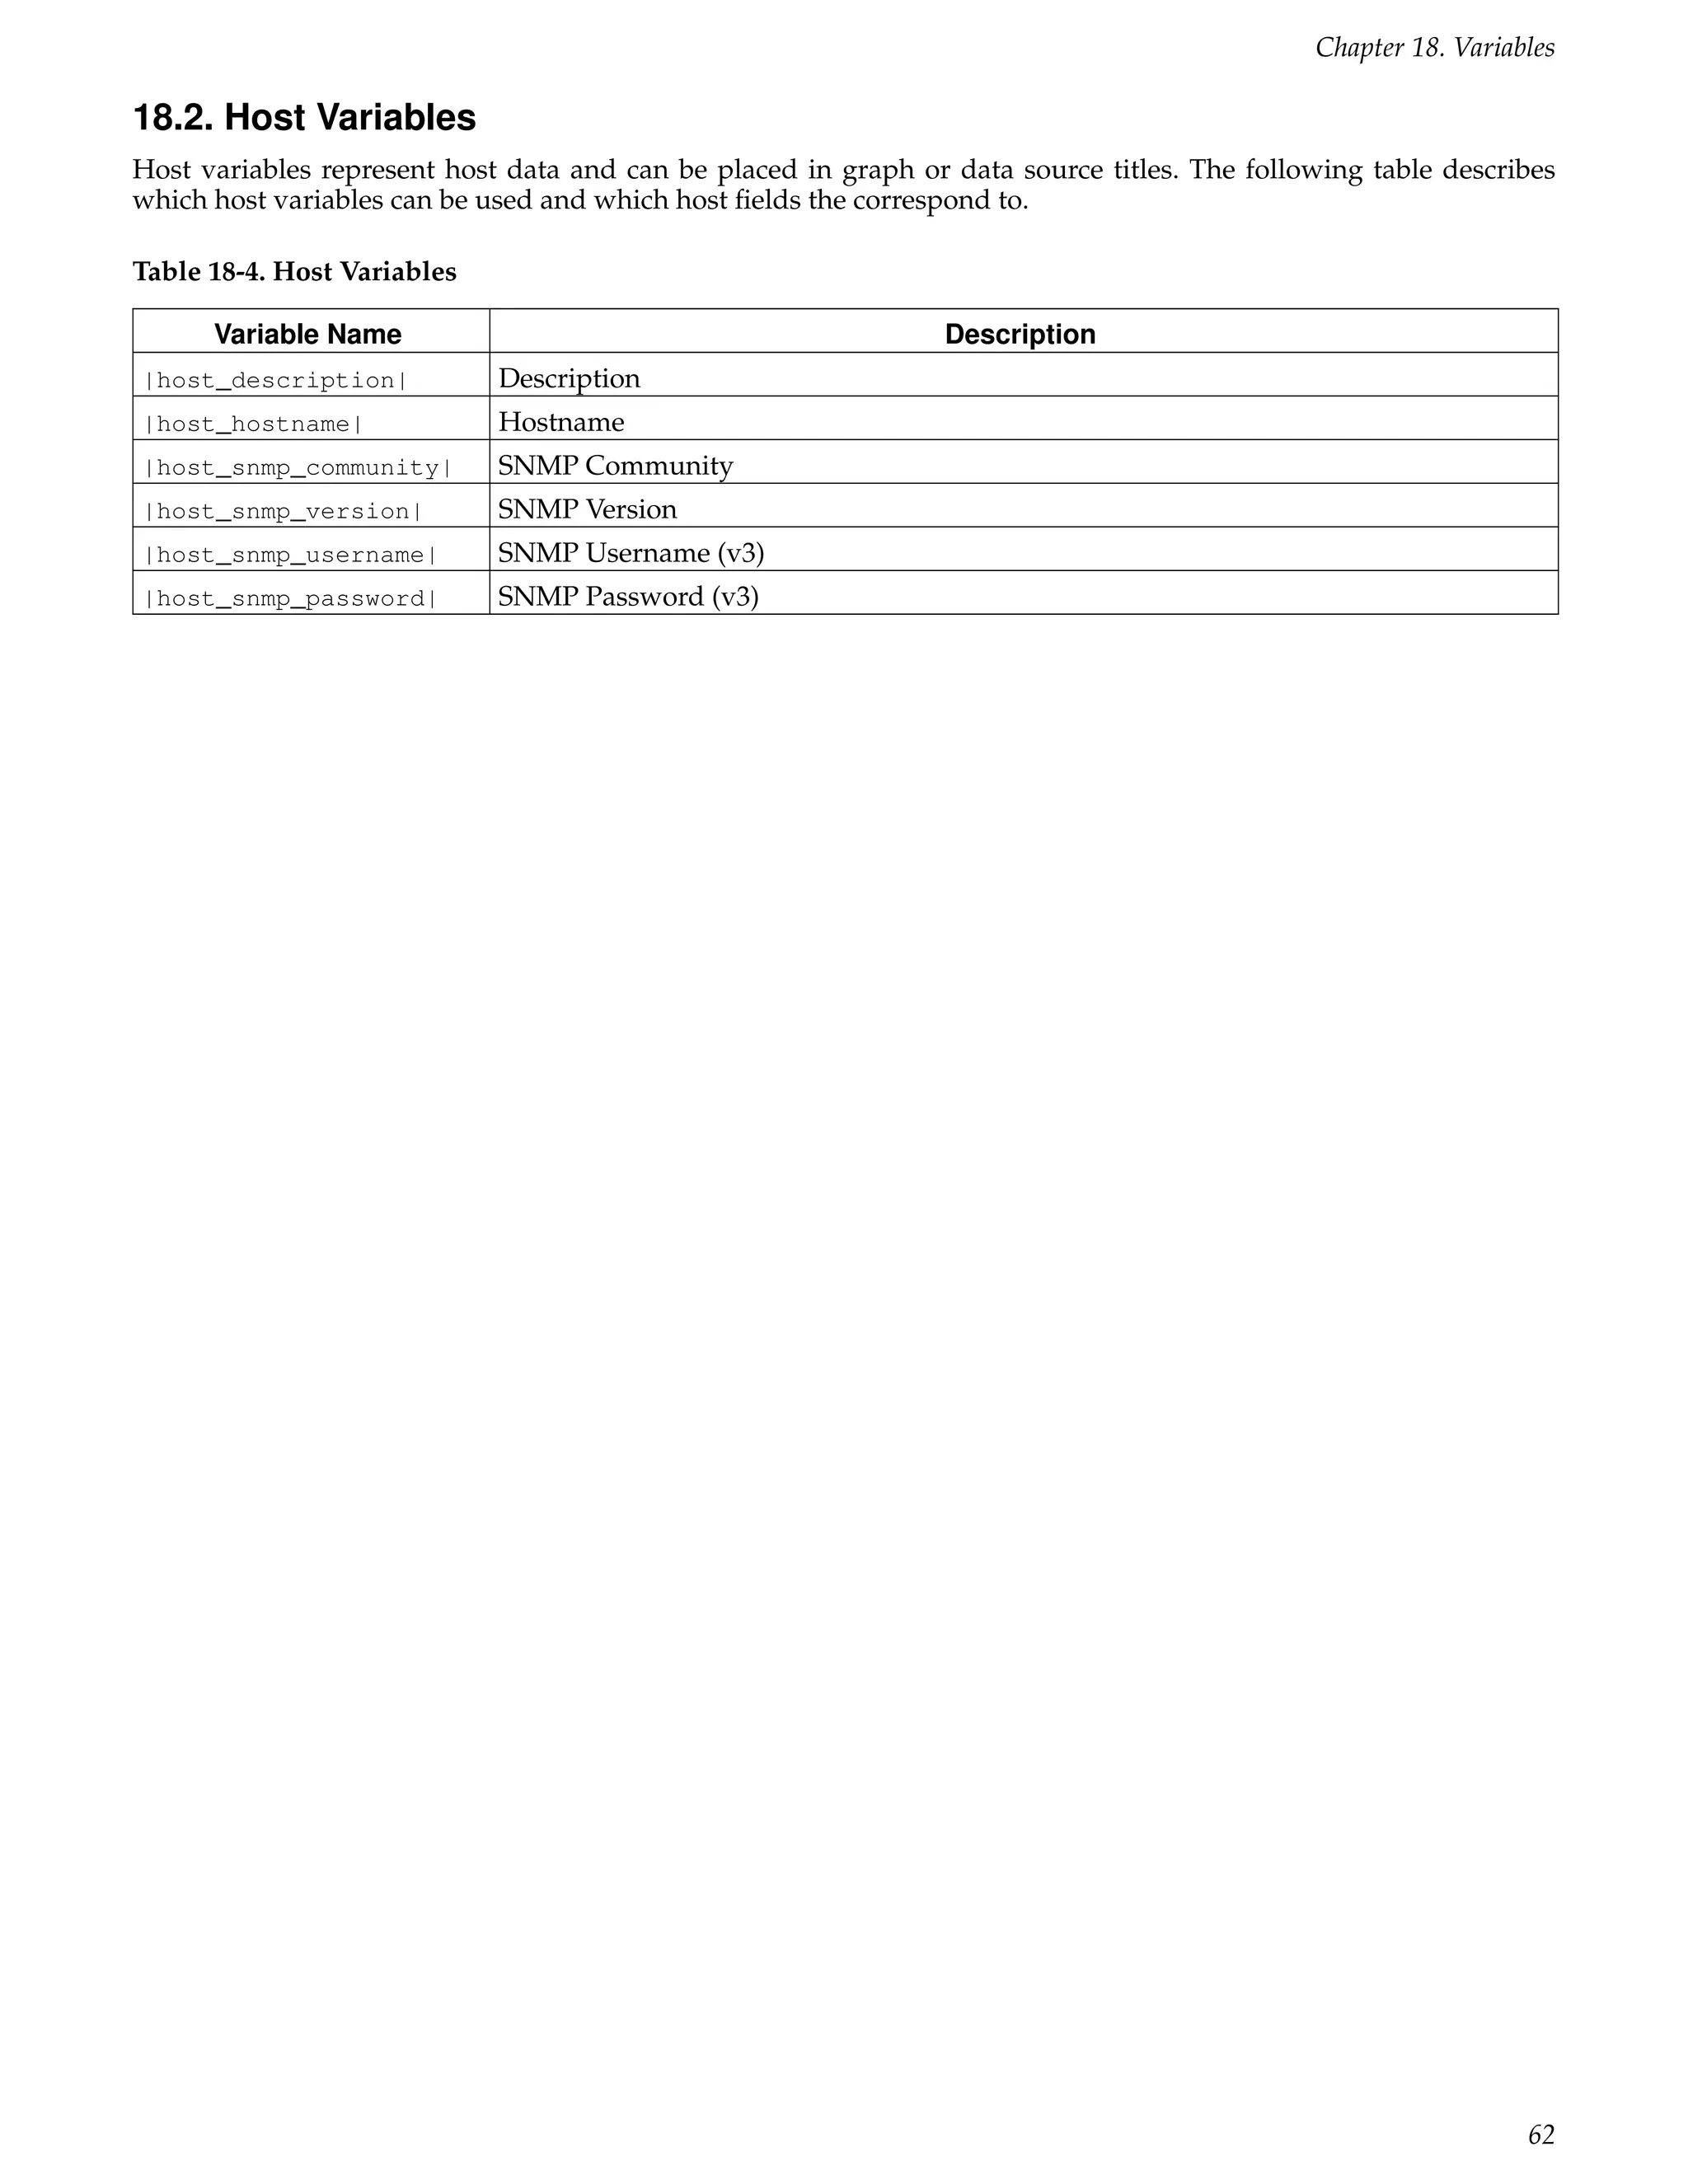
![Chapter 18. Variables
18.1. Graph Variables
The following variables can be used in the Text Format and Value graph item fields. Below is a description of each of
these variables.
18.1.1. Date/Time
|date_time|
This variable will place the date and time of the last poller run on the graph. It can be used to replicate MRTG’s "graph
last updated" feature.
18.1.2. Data Query Fields
|query_field_name|
You can place the value of any data query field on the by including this variable. Make sure to substitute "field_name"
with the actual data query field name.
Example 18-1. Print the IP Address on a traffic graph
|query_ifIP|
Example 18-2. Print the mount point on net-snmp disk graph
|query_dskPath|
18.1.3. Nth Percentile
|[0-9]:(bits|bytes):[0-9]:(current|total|max|total_peak|all_max_current|all_max_peak|aggregate_max|aggregate_sum|aggr
Nth percentile is often used by hosting providers to bill customers based on their peak traffic usage while ignoring
their top (100 - Nth) percent. This way if a customer has a fairly consistent traffic pattern and decides to download a
huge file one day, the large spike will be ignored. Common Nth percentile is 95, which would cut off the top 5% of the
traffic.
In Cacti, Nth percentile works just like any other graph variable. To use this variable you must give it five arguments:
Table 18-1. Nth Percentile Argument Description
Name Description
[0-9] The first argument is a number between 1 and 99. This number represents the Nth
percentile that you would like to calculate.
(bits|bytes) Choose whether you want to represent your Nth percentile in bits or bytes. The only
valid values for this field are ’bits’ and ’bytes’.
[0-9] This field determines the power of 10 divisor that will be applied to your Nth
percentile number. Enter ’0’ to leave the number alone, ’3’ for kilo or ’6’ for mega, etc.](https://image.slidesharecdn.com/cactimanual-121101075848-phpapp01/75/Cacti-manual-64-2048.jpg)
![Chapter 18. Variables
Name Description
( current | total | Nth Percentile Type - Refer to Nth Types
max | total_peak |
all_max_current |
all_max_peak |
aggregate_max |
aggregate_sum |
aggregate_current |
aggregate )
[0-9] Enter the number of digits to use for floating point precision when printing out the
final number. The default value for this field is two decimal places.
Table 18-2. Nth Percentile Types
Type Description
current Calculates the Nth percentile based off the selected data source on the graph item
wich the variable is used. This type requires a selected Data Source Item in the graph
item in which it is defined.
total Calculates the Nth percentile based off the selected data source on the graph item
wich the variable is used. But unlike current, this function totals the Nth percentile
results of all same named data source names on the graph. Example, all traffic_in
would have their Nth percentile calculated and then totaled. This type requires a
selected Data Source Item in the graph item in which it is defined.
max Calculates the Nth percentile based off the selected data source on the graph item
which the variable is used, but it is important to note that it selects the higher of the
values for each row in data source and then uses the resulting set to calculate the Nth
percentile. Example, you have selected a interface data source for traffic_in, this will
evaluate traffic_out and traffic_in for that selected data source (rrdtool file) and select
the higher of the two values for each row of data. The resulting max values are used to
calculate the Nth percentile value. This type requires a selected Data Source Item in
the graph item in which it is defined.
total_peak Calculates the Nth percentile based on the max for each data source defined on the
graph. Example, the max is taken for each data source defined on the graph, but it’s
the max of traffic_in or traffic_out for that data source (rrdtool file). The resulting max
values are summed and returned.
all_max_current Calculates the Nth percentile based off the selected data source on the graph item
which the variable is used, but it only selects the highest (max) value of all the data
source items on the graph. Example, there are 3 data sources defined on the graph, the
selected data source is traffic_in, all data sources for traffic_in will be compared
against each other and the highest Nth value of all graph items will be selected as the
result. This type requires a selected Data Source Item in the graph item in which it is
defined.
all_max_peak Calculates the Nth percentile by selecting the highest (max) calculated max Nth
percentile value for each data source (rrdtool file) selected on the graph. Example, 3
data sources are defined on the graph, for each data source, the max Nth percentile is
calculated, and out of the resulting set of values, the highest value is selected and
returned.
aggregate_max Calculates the Nth percentile by selecting the highest value for each summed value of
like data sources and selecting the maximum value of that set to calculate the Nth
percentile value. Example, you have a graph with 5 traffic_in and 18 traffic_out data
sources. The traffic_in rows are summed together, then the traffic_out rows are
summed together, then for each row, the higher of the 2 values is selected. The Nth
percentile is calculated from the resulting maximum values.
aggregate_sum Calculates the Nth percentile by summing all data sources on the graph row for row
and calculates the Nth value on the resulting summed data. Example, you have a
graph with 4 traffic_in and 3 traffic_out data sources defined. All the defined traffic_in
and traffic_out are summed together and then the Nth percentile value is calculated
from that set.
60](https://image.slidesharecdn.com/cactimanual-121101075848-phpapp01/75/Cacti-manual-65-2048.jpg)
![Chapter 18. Variables
Type Description
aggregate_current Calculates the Nth percentile by summing items matching the selected data source
name row for row from each data source defined on the graph with the same data
source name and then returning the Nth percent value calculated. Example, you have
a graph with 3 traffic_out and 5 traffic_in data sources defined. The traffic_in is
selected on the graph item where this variable is used, so all graph items for traffic_in
are summed and then the Nth value is calculated and returned as the variable.
aggregate Calculates the Nth percentile by summing like data source names row for row from
each data source defined on the graph and then returning the highest Nth percent
value calculated for like data source names. Example, you have a graph with 3
traffic_out and 5 traffic_in data sources defined. The traffic_in and traffic_out are
summed then the Nth value is calculated and the higher of the 2 values is returned as
the variable.
Concerning aggregate Nth percentile functions and rra definitions: All data sources used in a graph MUST have the same
rra definitions. If the number of rows do not match when calculations are attempted, the results may produce errors and invalid
results. Please also be aware the aggregate functions take more memory and processor power when used. Recommended
minimum of 64 megs memory limit for php when querying large ranges or graphs with a large ammount of aggregated data
sources.
Example 18-3. Output in the following format, for 95th percentile: 42.58 mbit
|95:bits:6:max:2|
18.1.4. Bandwidth Summation
|sum:([0-9]|auto):(current|total):([0-9]):([0-9]+|auto)|
Bandwidth summation is useful for summing up all values in an RRD file for a given time range. This is typically
useful on traffic graphs where you can see a total of all traffic that has gone through an interface in a given time
period.
In Cacti, bandwidth summation works just like any other graph variable. To use this variable you must give it three
arguments:
Table 18-3. Bandwidth Summation Argument Description
Name Description
([0-9]|auto) This field determines the power of 10 divisor that will be applied to your number.
Enter ’0’ to leave the number alone, ’3’ for kilo or ’6’ for mega, etc. You can also enter
’auto’ for this field to have Cacti automatically scale the number and insert the
appropriate label.
(current|total) You can choose to calculate the summation based on the current data source or a total
of all data sources used on the graph. The only valid values for this field are ’current’
and ’total’.
[0-9] Enter the number of digits to use for floating point precision when printing out the
final number. The default value for this field is two decimal places.
([0-9]+|auto) Enter the number of seconds in the past to perform the summation calculation for. For
instance ’86400’ for 24 hours, ’172800’ for 48 hours, etc. You can also enter ’auto’ for
this field to have Cacti use the graph timespan.
Example 18-4. Output in the following format: 36.47 GB
|sum:auto:current:2:auto|
61](https://image.slidesharecdn.com/cactimanual-121101075848-phpapp01/75/Cacti-manual-66-2048.jpg)
![Chapter 20. Command Line Scripts
Cacti support a number of command line scripts. Please find them in the ./cli directory. As of current, following
scripts are supported:
add_device.php
add_graphs.php
add_perms.php
add_tree.php
copy_user.php
poller_graphs_reapply_names.php
poller_output_empty.php
poller_reindex_hosts.php
rebuild_poller_cache.php
Numbers may vary!
In the following examples, several numbers are shown as output from various scripts. They will vary between different
installations. So don’t bother, if your numbers will vary
20.1. Rebuild Poller Cache
The poller cache holds all commands that cacti will issue during the polling process in an internal format. It is possible,
to review the currenty contents of the poller cache by visiting System Utilities, View Poller Cache. It is possible
to apply filters to this view; it will show up like
Localhost - Hard Drive Space Script Server: /var/www/html/cacti/scripts/ss_host_disk.php ss_host_disk
RRD: /var/www/html/cacti/rra/localhost_hdd_total_61.rrd
Localhost - Load Average Script: /usr/bin/perl /var/www/html/cacti/scripts/loadavg_multi.pl
RRD: /var/www/html/cacti/rra/localhost_load_1min_5.rrd
Localhost - Logged in Users Script: /usr/bin/perl /var/www/html/cacti/scripts/unix_users.pl
RRD: /var/www/html/cacti/rra/localhost_users_6.rrd
Localhost - Memory - Free Script: /usr/bin/perl /var/www/html/cacti/scripts/linux_memory.pl MemFree:
RRD: /var/www/html/cacti/rra/localhost_mem_buffers_3.rrd
Localhost - Memory - Free Swap Script: /usr/bin/perl /var/www/html/cacti/scripts/linux_memory.pl SwapFre
RRD: /var/www/html/cacti/rra/localhost_mem_swap_4.rrd
Localhost - mtaReceivedMessages SNMP Version: 1, Community: somesecret, OID: .1.3.6.1.2.1.28.1.1.1.1
RRD: /var/www/html/cacti/rra/localhost_mtareceivedmessages_47.rrd
Localhost - mtaReceivedVolume SNMP Version: 1, Community: somesecret, OID: .1.3.6.1.2.1.28.1.1.4.1
RRD: /var/www/html/cacti/rra/localhost_mtareceivedvolume_49.rrd
There are several circumstances, that may result in the poller cache being out of sync. An example would be a change
of the name of a script used in a Data Input Method. This change is not automatically propagated to the poller cache.
It is required, to run php -q rebuild poller_cache.php manually.
Calling the script with the parameter --help yields
shell>php -q rebuild_poller_cache.php --help
Cacti Rebuild Poller Cache Script 1.0, Copyright 2007 - The Cacti Group
usage: rebuild_poller_cache.php [-d] [-h] [--help] [-v] [--version]
-d - Display verbose output during execution
-v --version - Display this help message
-h --help - Display this help message
Debug mode lists the data sources items that are worked upon.
shell>php -q rebuild_poller_cache.php -d
WARNING: Do not interrupt this script. Rebuilding the Poller Cache can take quite some time
DEBUG: There are ’38’ data source elements to update.
DEBUG: Data Source Item ’1’ of ’38’ updated
DEBUG: Data Source Item ’2’ of ’38’ updated
DEBUG: Data Source Item ’3’ of ’38’ updated
DEBUG: Data Source Item ’4’ of ’38’ updated
....
Without any parameter, some dots are shown as progress indicators.
shell>php -q rebuild_poller_cache.php](https://image.slidesharecdn.com/cactimanual-121101075848-phpapp01/75/Cacti-manual-69-2048.jpg)
![Chapter 20. Command Line Scripts
WARNING: Do not interrupt this script. Rebuilding the Poller Cache can take quite some time
......................................
shell>
Stop the Poller when Rebuilding the Poller Cache
Rebuilding the poller cache interferes with the poller operation. Please make sure, that the poller is not running and will
not start during a rebuild operation
20.2. Re-Index Hosts
Re-Indexing is required only for SNMP/Script Data Queries. Remember, that whan applying a Data Query to a Host, a
Re-Index Method has to be chosen. This reindex method governs the automatic re-indexing based on specific events.
Table 20-1. Re_Index Methods
Re-Index Method Description
Uptime Goes Backwards Refers to a system reboot. Cacti will detect if the target has been rebootet by querying
sysUptime (.1.3.6.1.2.1.1.3.0). If the current value for the uptime is lower than the
previous one (uptime goes backwards), a reboot is assumed and a re-index is
performed
Index Count Changed Refers to a change of the number of indexed items, e.g. interfaces, without checking
sysUptime. It is of particular interest in cases, where indexed entries may change
without the need of a reboot. As modern operating systems seldom require reboots for
system configuration changes, you may want to consider this setting for many cases
(e.g. creating of a new filesystem without a reboot). The index to be considered is
defined by the according XML file.
Verify All Fields All index fields of the according XML file are checked for changes. This is of particular
interest e.g. in cases, where the index is non-numeric (e.g. a MAC address).
If you feel the need for manual re-indexing, you may run it from cli. Calling the script with the parameter --help
yields
shell>php -q poller_reindex_hosts.php --help
Cacti Reindex Host Script 1.0, Copyright 2007 - The Cacti Group
usage: poller_reindex_hosts.php -id=[host_id|All] [-d] [-h] [--help] [-v] [--version]
-id=host_id - The host_id to have data queries reindexed or ’All’ to reindex all hosts
-d - Display verbose output during execution
-v --version - Display this help message
-h --help - Display this help message
Running it in debug mode for the host with id=2 may yield
shell>php -q poller_reindex_hosts.php -id=2 -d
WARNING: Do not interrupt this script. Reindexing can take quite some time
DEBUG: There are ’1’ data queries to run
DEBUG: Data query number ’1’ starting
DEBUG: Data query number ’1’ ending
A silent run for all devices is issued by
shell>php -q poller_reindex_hosts.php -id=All
WARNING: Do not interrupt this script. Reindexing can take quite some time
.....shell>
Stop the Poller during Re-Indexing
Re-Indexing interferes with the poller operation. Please make sure, that the poller is not running and will not start during
a reindex operation
65](https://image.slidesharecdn.com/cactimanual-121101075848-phpapp01/75/Cacti-manual-70-2048.jpg)
![Chapter 20. Command Line Scripts
20.3. Empty Poller Output Table
During normal poller operation, all retrieved results are intermediately stored in the table named poller_output Af-
ter execution of cmd.php or Spine, this table holds all results. The poller.php finally issues all rrdtool update
operations. Thus, after polling has completed, the table should be empty.
Conditions may arise, where the table is not (completely) emptied. The most often known issue is lack of php memory.
In those cases, the table is bigger than the php memory size, thus not all items are handled correctly. If that issue occurs,
you may save all pending updates after increasing PHP memory appropriately by running this very script. Calling the
script with the parameter --help yields
shell>php -q poller_output_empty.php --help
Cacti Empty Poller Output Table Script 1.0, Copyright 2007 - The Cacti Group
usage: poller_output_empty.php [-h] [--help] [-v] [--version]
-v --version - Display this help message
-h --help - Display this help message
You see, no parameter is required for operating successfully. Under normal circumstances, running this script should
yield
shell>php -q poller_output_empty.php
There were 0, RRD updates made this pass
shell>
In case, you hit the poller process or if the table was really not fully processed, you may find
shell>php -q poller_output_empty.php
OK u:0.00 s:0.00 r:0.04
OK u:0.00 s:0.00 r:0.04
OK u:0.00 s:0.00 r:0.04
OK u:0.00 s:0.00 r:0.04
OK u:0.00 s:0.00 r:0.04
OK u:0.00 s:0.00 r:0.04
OK u:0.00 s:0.00 r:0.04
OK u:0.00 s:0.00 r:0.04
OK u:0.00 s:0.00 r:0.04
OK u:0.00 s:0.00 r:0.05
OK u:0.00 s:0.00 r:0.05
OK u:0.00 s:0.00 r:0.05
OK u:0.00 s:0.00 r:0.05
OK u:0.00 s:0.00 r:0.05
OK u:0.00 s:0.00 r:0.05
OK u:0.00 s:0.00 r:0.05
OK u:0.00 s:0.00 r:0.05
OK u:0.00 s:0.00 r:0.05
OK u:0.00 s:0.00 r:0.05
OK u:0.00 s:0.00 r:0.05
OK u:0.00 s:0.01 r:0.06
There were 21, RRD updates made this pass
shell>
If logging level verbosity was switched to DEBUG you may find additional debug messages that usually show up in
cacti.log
20.4. Reapply Suggested Names to Graphs
For a general understanding of suggested names used with data queries, please see Section 12.1.1>. Be aware, that
changes to the Suggested Names section of a data query will not automatically be propagated to all existing graphs.
This is, where poller_graphs_reapply_names.php drops in. Calling the script with the parameter --help yields
shell>php -q poller_graphs_reapply_names.php --help
Cacti Reapply Graph Names Script 1.0, Copyright 2007 - The Cacti Group
usage: poller_graphs_reapply_names.php -id=[host_id|All][host_id1|host_id2|...] [-s=[search_string] [-d]
-id=host_id - The host_id or ’All’ or a pipe delimited list of host_id’s
-s=search_str - A graph template name or graph title to search for
-d - Display verbose output during execution
-v --version - Display this help message
66](https://image.slidesharecdn.com/cactimanual-121101075848-phpapp01/75/Cacti-manual-71-2048.jpg)
![Chapter 20. Command Line Scripts
usage: add_device.php --description=[description] --ip=[IP] --template=[ID] [--notes="[]"] [--disable]
[--avail=[ping]] --ping_method=[icmp] --ping_port=[N/A, 1-65534] --ping_retries=[2]
[--version=[1|2|3]] [--community=] [--port=161] [--timeout=500]
[--username= --password=] [--authproto=] [--privpass= --privproto=] [--context=]
[--quiet]
Required:
--description the name that will be displayed by Cacti in the graphs
--ip self explanatory (can also be a FQDN)
Optional:
--template 0, is a number (read below to get a list of templates)
--notes ”, General information about this host. Must be enclosed using double quotes.
--disable 0, 1 to add this host but to disable checks and 0 to enable it
--avail pingsnmp, [ping][none, snmp, pingsnmp]
--ping_method tcp, icmp|tcp|udp
--ping_port ”, 1-65534
--ping_retries 2, the number of time to attempt to communicate with a host
--version 1, 1|2|3, snmp version
--community ”, snmp community string for snmpv1 and snmpv2. Leave blank for no community
--port 161
--timeout 500
--username ”, snmp username for snmpv3
--password ”, snmp password for snmpv3
--authproto ”, snmp authentication protocol for snmpv3
--privpass ”, snmp privacy passphrase for snmpv3
--privproto ”, snmp privacy protocol for snmpv3
--context ”, snmp context for snmpv3
List Options:
--list-host-templates
--list-communities
--quiet - batch mode value return
Wow, that’s quite a lot of options. To better understand it’s use, let’s first stick to the listing options
20.6.1. List all Host Templates
shell>php -q add_device.php --list-host-templates
Valid Host Templates: (id, name)
1 Generic SNMP-enabled Host
3 ucd/net SNMP Host
4 Karlnet Wireless Bridge
5 Cisco Router
6 Netware 4/5 Server
7 Windows 2000/XP Host
8 Local Linux Machine
Why are those Host Templates of such importance for this script? Well, when using this script to add a new device,
there are 3 required parameters. The description and the device ip address are of course left to you. But for
assigning the correct Host Template Id, you should first know the correct id of that very parameter. For the purpose
of this chapter we assume to add a device that will be associated to a ucd/net SNMP Host, so the id of 3 is required.
If you do not want to associate the host to any Host Template Id, known as host template None, please provide the
parameter --template=0 or omit this parameter.
20.6.2. List all Community Strings
shell>php -q add_device.php --list-communities
Known communities are: (community)
public
snmp-get
Of course, your list will vary
68](https://image.slidesharecdn.com/cactimanual-121101075848-phpapp01/75/Cacti-manual-73-2048.jpg)
![Chapter 20. Command Line Scripts
20.6.3. Create a New Device
Now, let’s set up the most basic command to add a new device. The description shall be "Device Add Test", the ip
will be given as a FQDN, router.mydomain.com. As a SNMP enabled device, surely a community string has to be
provided; in this case given as public. In total, this makes the following command
shell>php -q add_device.php --description="Device Add Test" --ip="router.mydomain.com" --template=3 --com
Adding Device Add Test (router.mydomain.com) as "ucd/net SNMP Host" using SNMP v1 with community "public"
Success - new device-id: (11)
Please visit Devices to see the result:
Description** Graphs Data Sources Status Hostname Current (ms) Average (ms) Availability
Device Add Test 0 0 Unknown router.mydomain.com 0 0 100
Please use any other combination of parameters in the same way as via the web browser console. You may want to
remember the new device id, 11 in this case, for the next steps.
20.7. Add a New Graph
You won’t stop now as you’ve just created a device from cli. Surely, the task of setting up graphs is the next step. This
is done using add_graphs.php. Calling the script with the parameter --help yields
shell>php -q add_graphs.php
Add Graphs Script 1.0, Copyright 2007 - The Cacti Group
A simple command line utility to add graphs in Cacti
usage: add_graphs.php --graph-type=[cg|ds] --graph-template-id=[ID]
--host-id=[ID] [--graph-title=title] [graph options] [--force] [--quiet]
For cg graphs:
[--input-fields="[data-template-id:]field-name=value ..."] [--force]
--input-fields If your data template allows for custom input data, you may specify that
here. The data template id is optional and applies where two input fields
have the same name.
--force If you set this flag, then new cg graphs will be created, even though they
may already exist
For ds graphs:
--snmp-query-id=[ID] --snmp-query-type-id=[ID] --snmp-field=[SNMP Field] --snmp-value=[SNMP Value]
[--graph-title=] Defaults to what ever is in the graph template/data-source template.
List Options:
--list-hosts
--list-graph-templates
--list-input-fields --graph-template-id=[ID]
--list-snmp-queries
--list-query-types --snmp-query-id [ID]
--list-snmp-fields --host-id=[ID]
--list-snmp-values --host-id=[ID] --snmp-field=[Field]
’cg’ graphs are for things like CPU temp/fan speed, while
’ds’ graphs are for data-source based graphs (interface stats etc.)
Like the graph creation from the console, this task is split into two different ones:
• Associated Graph Templates: These are named cg graph_type for this script.
• Associated Data Queries: These are named ds graph_type for this script. Additional SNMP parameters are required
to define those graphs.
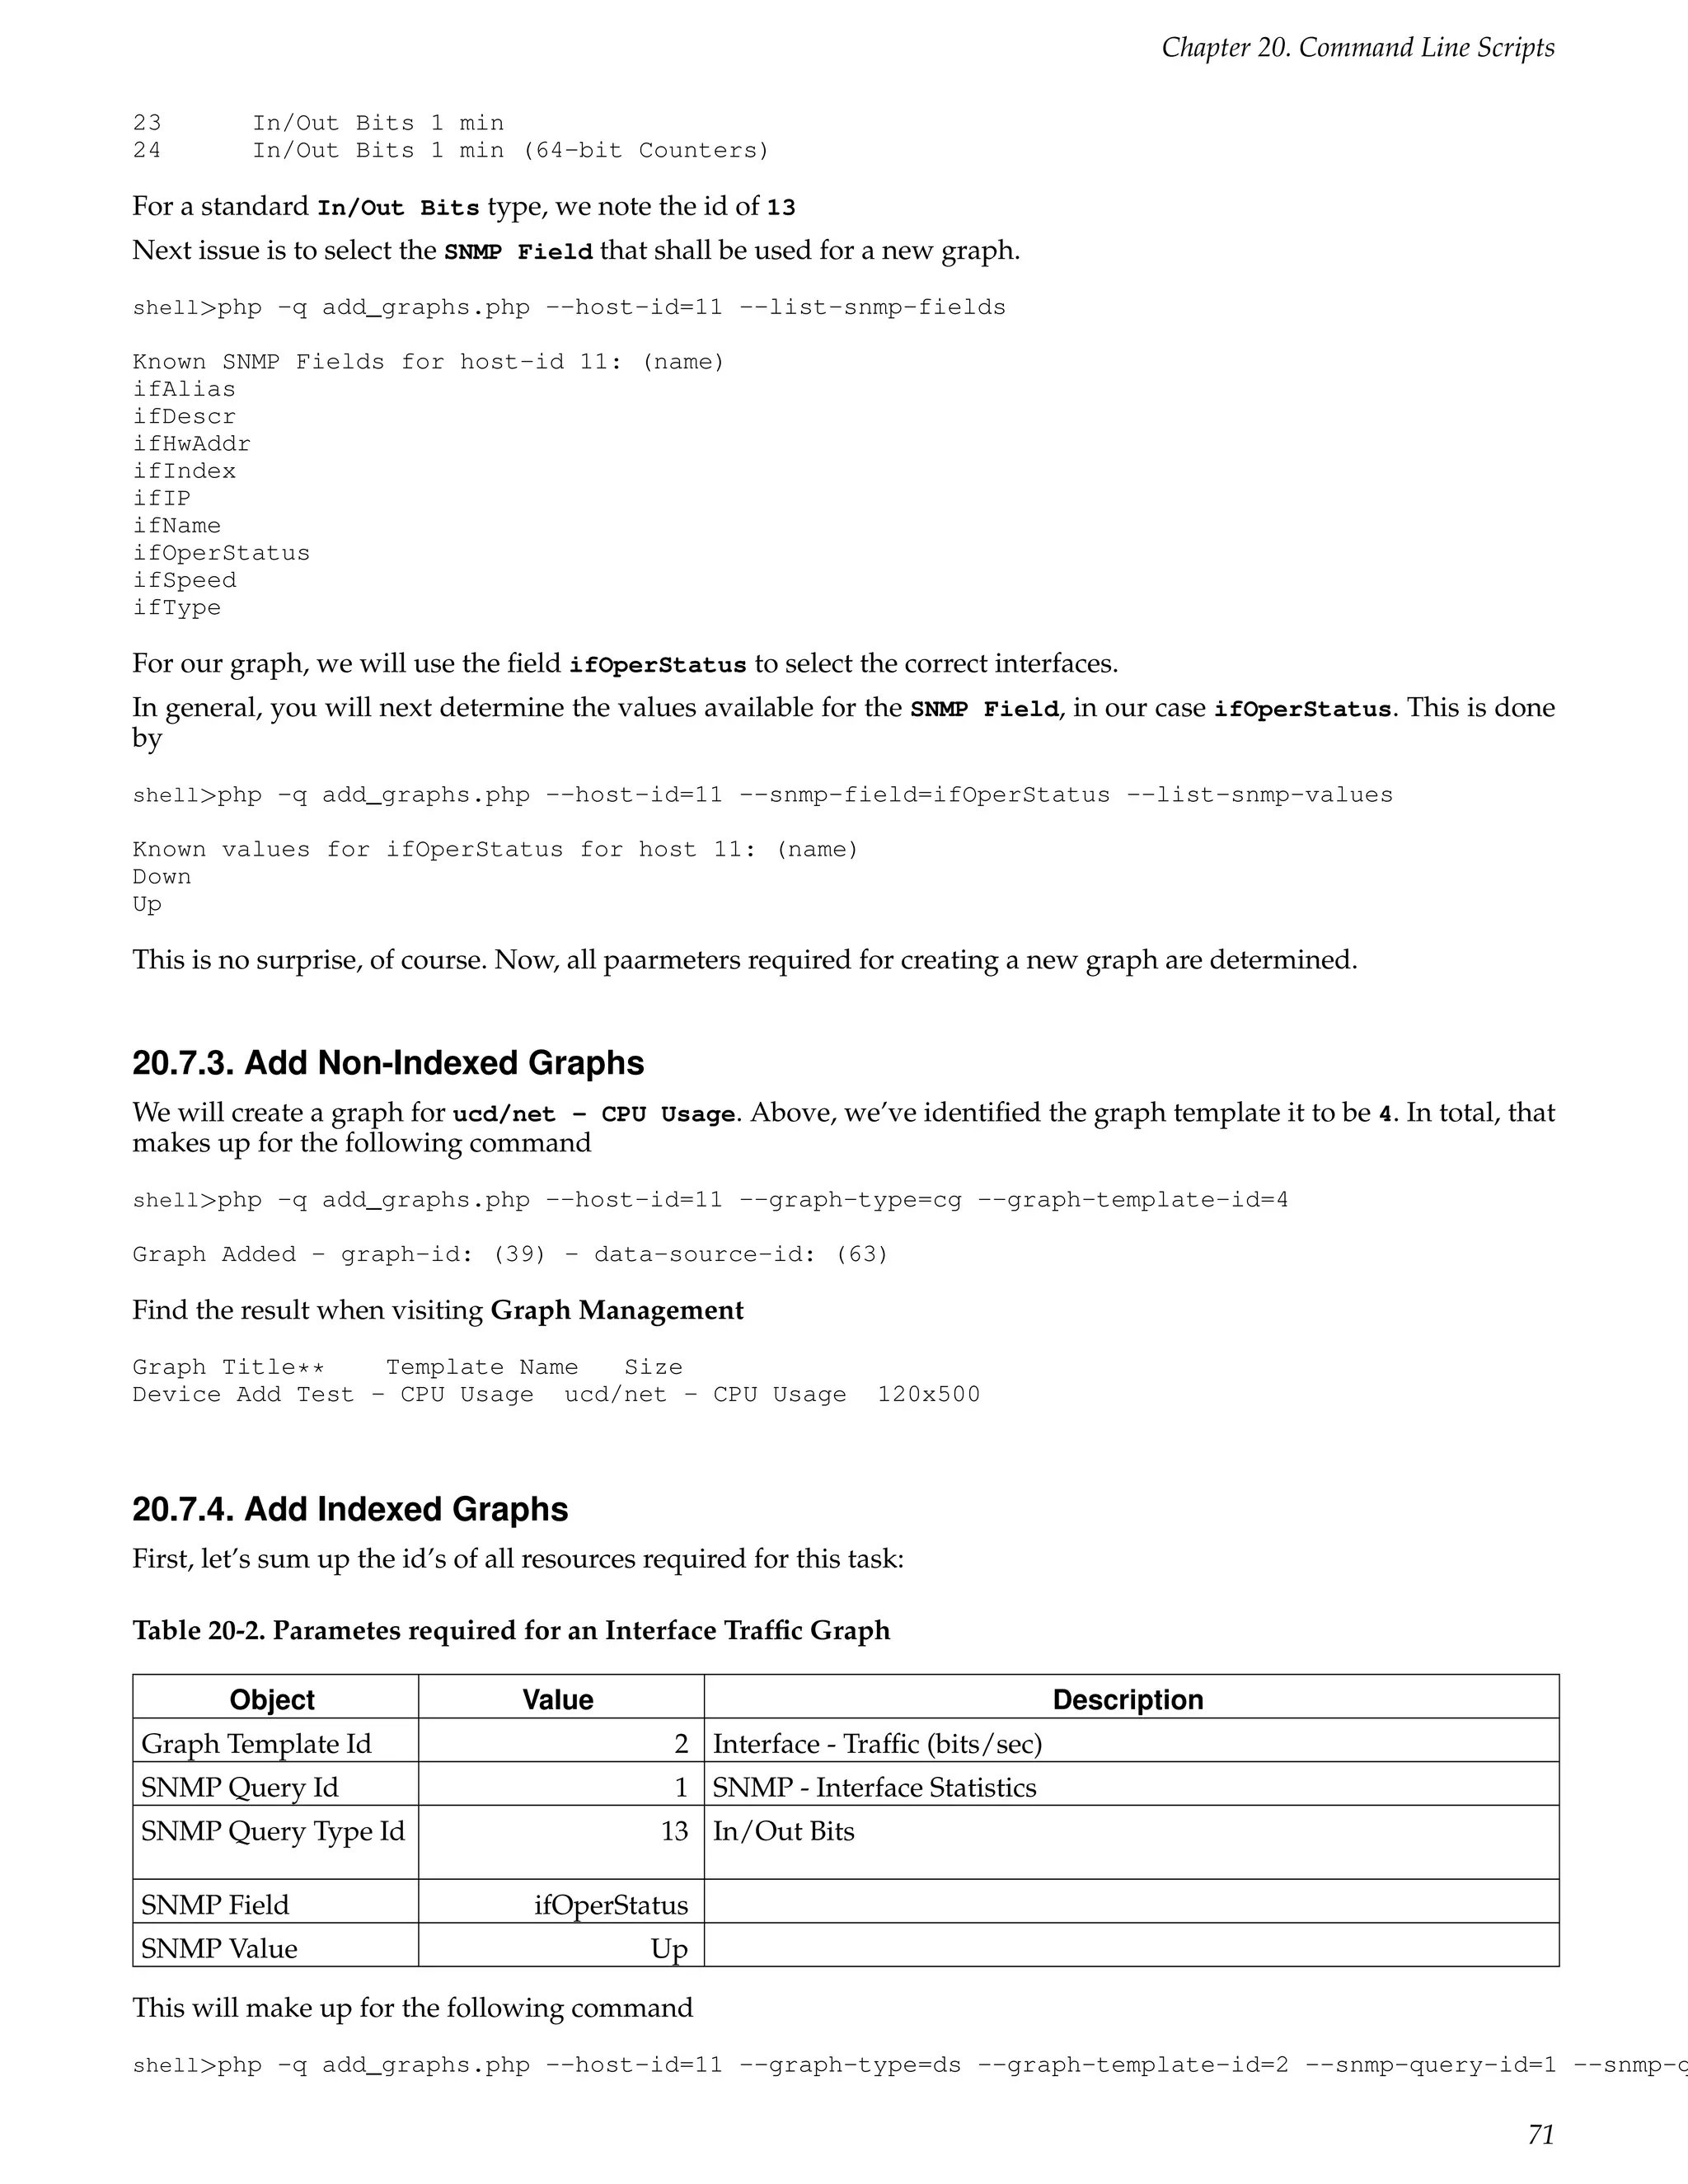
69](https://image.slidesharecdn.com/cactimanual-121101075848-phpapp01/75/Cacti-manual-74-2048.jpg)
![Chapter 20. Command Line Scripts
Graph Added - graph-id: (40) - data-source-id: (65)
Find the result when visiting Graph Management
Graph Title** Template Name Size
Device Add Test - CPU Usage ucd/net - CPU Usage 120x500
Device Add Test - Traffic - lo Interface - Traffic (bits/sec) 120x500
20.8. Add Items to a Tree
Now, that we’ve created some nice graphs, they should be put the graph trees. This is done using add_tree.php. As
you will notice soon, it is possible to even add header items, hosts and graphs to a tree as well as adding a new tree
itself. But let us first see the help output. Calling the script with the parameter --help yields
shell>php -q add_tree.php --help
Add Tree Script 1.0, Copyright 2007 - The Cacti Group
A simple command line utility to add objects to a tree in Cacti
usage: add_tree.php --type=[tree|node] [type-options] [--quiet]
Tree options:
--name=[Tree Name]
--sort-method=[manual|alpha|natural|numeric]
Node options:
--node-type=[header|host|graph]
--tree-id=[ID]
[--parent-node=[ID] [Node Type Options]]
Header node options:
--name=[Name]
Host node options:
--host-id=[ID]
[--host-group-style=[1|2]]
(host group styles:
1 = Graph Template,
2 = Data Query Index)
Graph node options:
--graph-id=[ID]
[--rra-id=[ID]]
List Options:
--list-hosts
--list-trees
--list-nodes --tree-id=[ID]
--list-rras
--list-graphs --host-id=[ID]
20.8.1. List Hosts
The first try is dedicated to the list option --list-hosts. It goes like
shell>php -q add_tree.php --list-hosts
Known Hosts: (id, hostname, template, description)
1 127.0.0.1 8 Localhost
2 gandalf 3 gandalf
...
11 router.mydomain.com 3 Device Add Test
72](https://image.slidesharecdn.com/cactimanual-121101075848-phpapp01/75/Cacti-manual-77-2048.jpg)
![Chapter 20. Command Line Scripts
20.8.2. List Trees
Now, let us --list-trees. It goes like
shell>php -q add_tree.php --list-trees
Known Trees:
id sort method name
1 Manual Ordering (No Sorting) Default Tree
20.8.3. List Nodes
Listing all existend node of a given tree is done by
shell>php -q add_tree.php --list-nodes --tree-id=1
Known Tree Nodes:
type id text
Host 7 127.0.0.1 Graph Template
Host 9 gandalf Graph Template
Host 12 gandalf Graph Template
20.8.4. List RRAs
For special tree add options, you will require the id of the RRA definition to completly specify the add request. That’s
why the corresponding --list-rras option is implemented. It goes this way
shell>php -q add_tree.php --list-rras
Known RRAs:
id steps rows timespan name
1 1 600 86400 Daily (5 Minute Average)
2 6 700 604800 Weekly (30 Minute Average)
3 24 775 2678400 Monthly (2 Hour Average)
4 288 797 33053184 Yearly (1 Day Average)
20.8.5. List Graphs for given Hosts
To be able to add a Graph, the id of that very graph is required. Thus, a --list-graphs --host-id=[id] option was
implemented
shell>php -q add_tree.php --list-graphs --host-id=1
Known Host Graphs: (id, name, template)
1 Localhost - Memory Usage Linux - Memory Usage
2 Localhost - Load Average Unix - Load Average
3 Localhost - Logged in Users Unix - Logged in Users
4 Localhost - Processes Unix - Processes
5 Localhost - Traffic - eth0 Interface - Traffic (bits/sec, 95th Percentile)
33 Localhost - Used Space - Memory Buffers Host MIB - Available Disk Space
34 Localhost - Used Space - Real Memory Host MIB - Available Disk Space
35 Localhost - Used Space - Swap Space Host MIB - Available Disk Space
36 Localhost - Used Space - / Host MIB - Available Disk Space
37 Localhost - Used Space - /sys Host MIB - Available Disk Space
38 Localhost - Used Space - /boot Host MIB - Available Disk Space
20.8.6. Add a new Tree
Cacti comes with a single tree, named Default Tree. Console entry Graph Trees is used to add more trees. With
add_tree.php, you may now do so from command line as well:
shell>php -q add_tree.php --type=tree --name="Test Tree Add" --sort-method=manual
Tree Created - tree-id: (6)
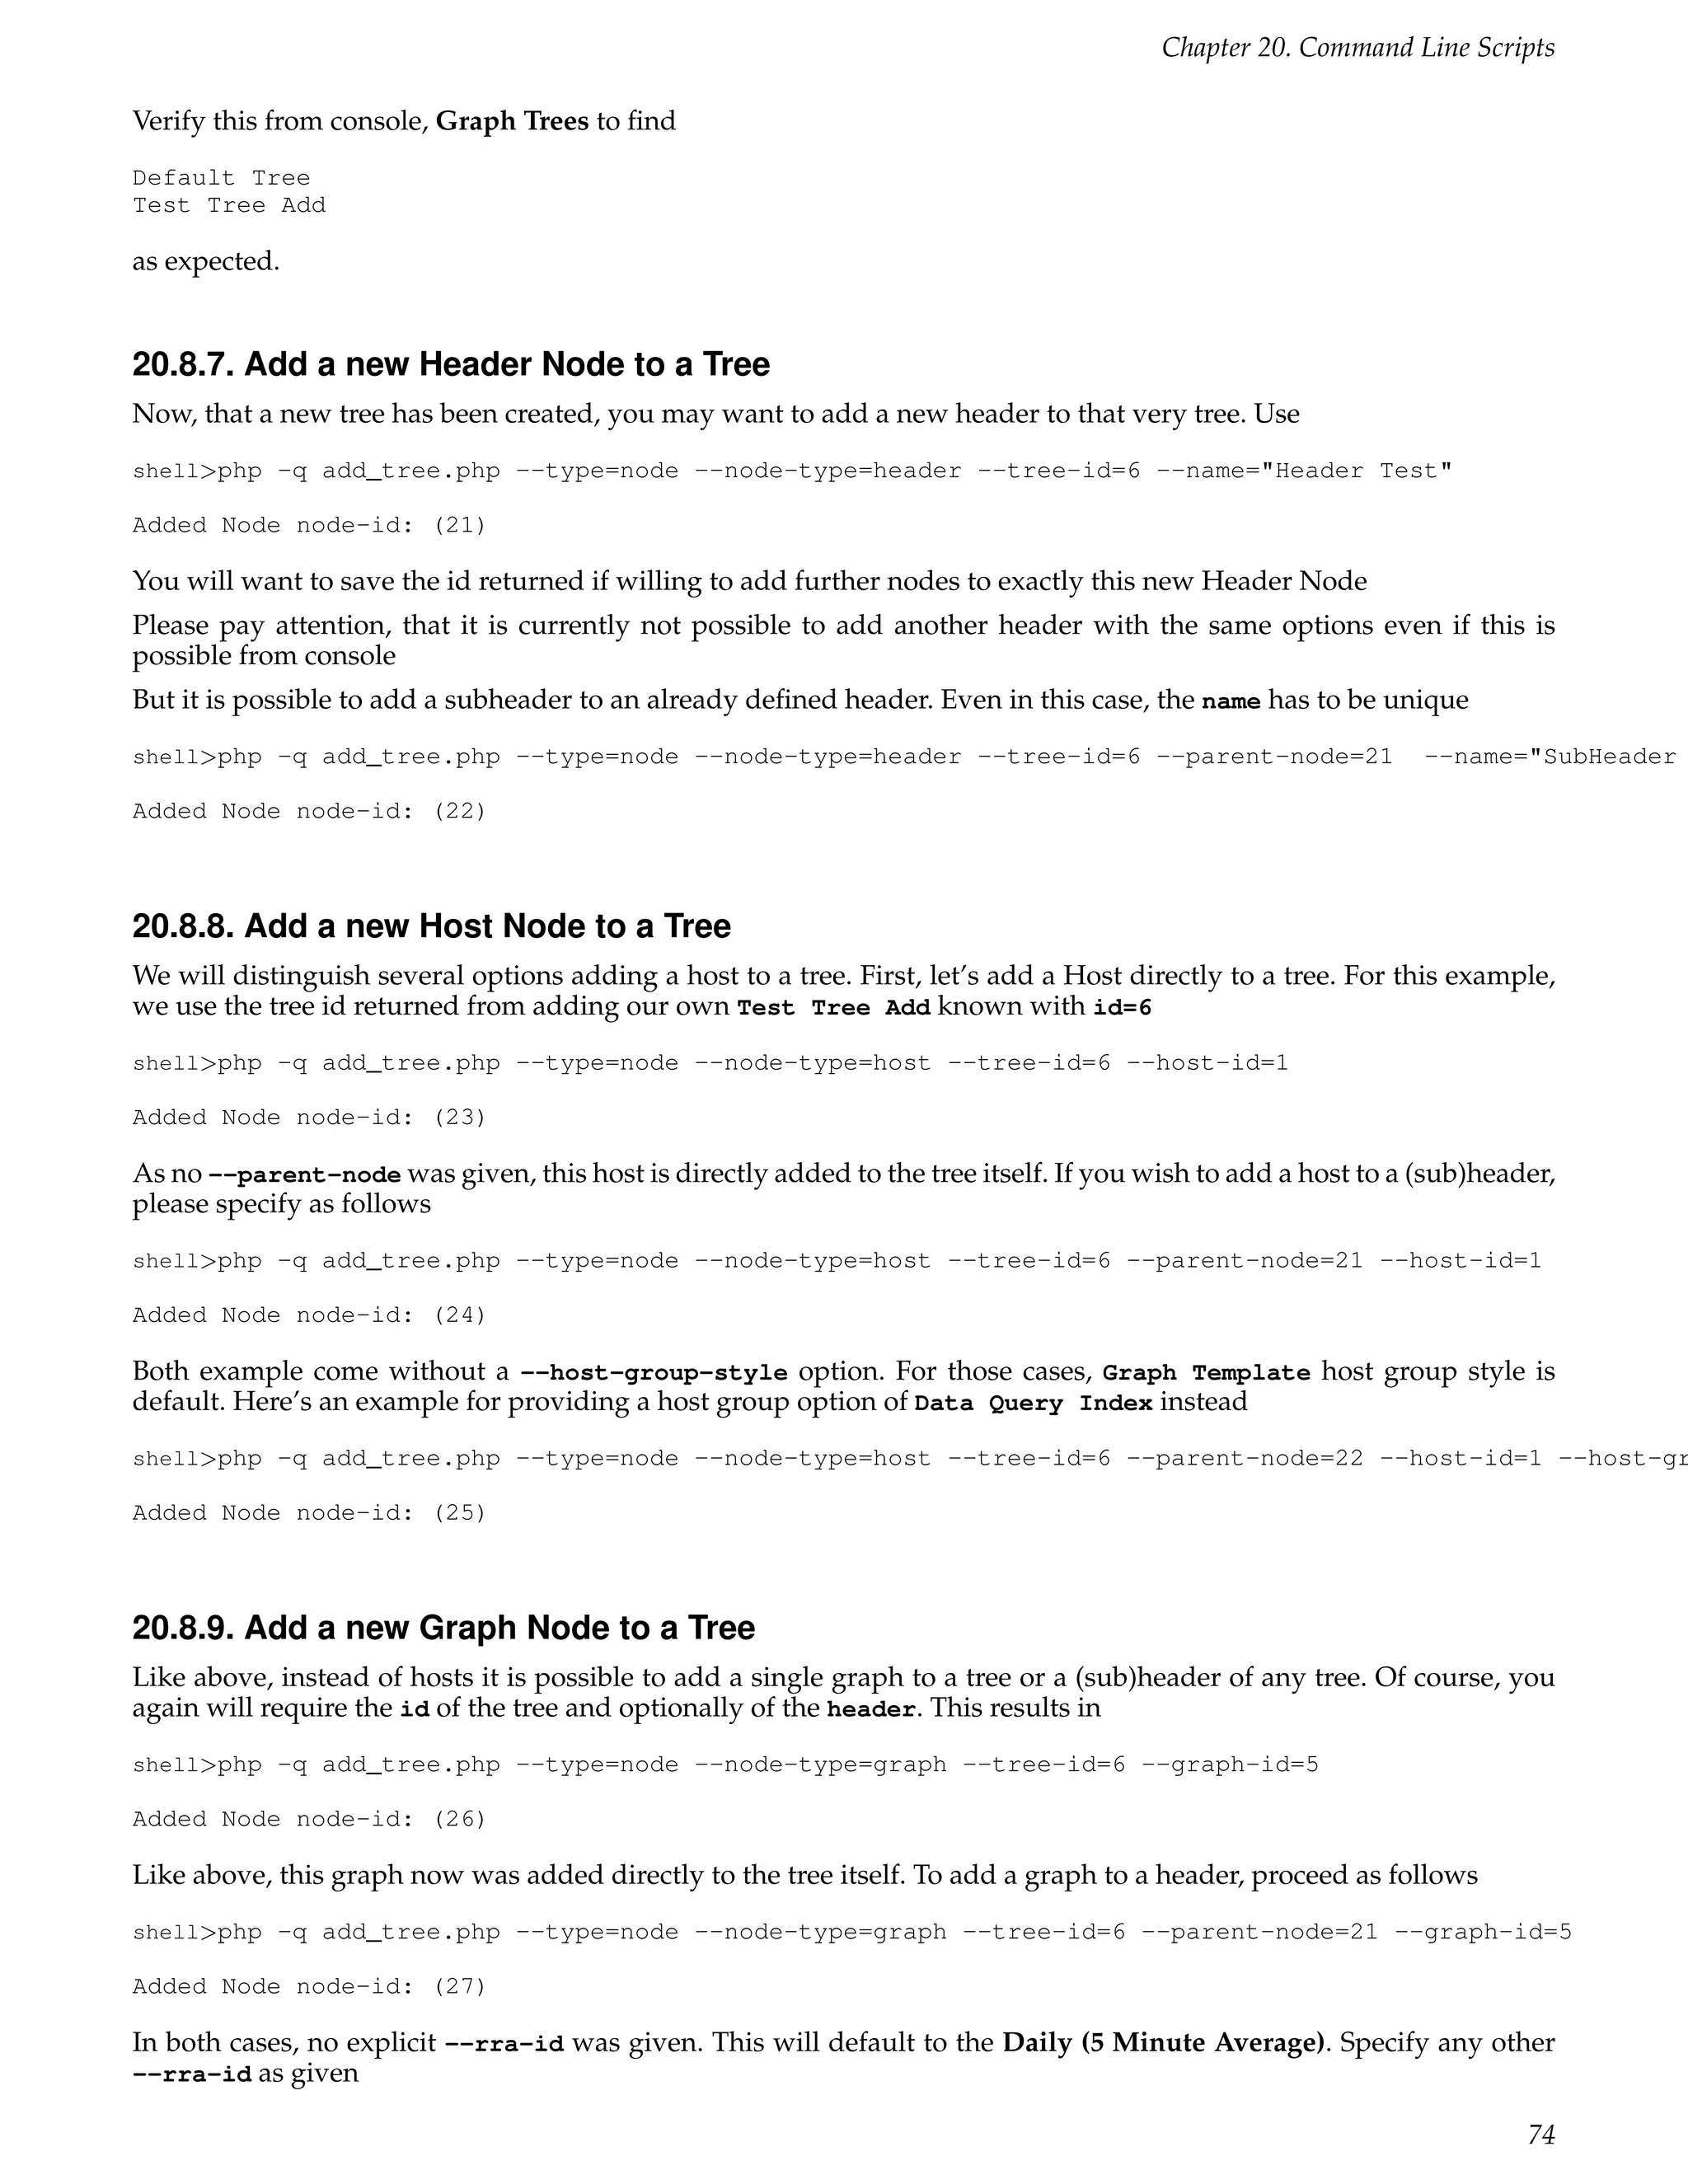
73](https://image.slidesharecdn.com/cactimanual-121101075848-phpapp01/75/Cacti-manual-78-2048.jpg)
![Chapter 20. Command Line Scripts
shell>php -q add_tree.php --type=node --node-type=graph --tree-id=6 --parent-node=21 --graph-id=1 --rra-i
Added Node node-id: (28)
to provide the --rra-id for a rra of Yearly (1 Day Average).
20.9. Add Graph Permissions
This script is used to specify special graph permissions to users. The list of parameters is displyed as usual when
calling the script with the parameter --help
shell>php -q add_perms.php --help
Add Permissions Script 1.0, Copyright 2007 - The Cacti Group
A simple command line utility to add permissions to tree items in Cacti
usage: add_perms.php [ --user-id=[ID] ]
--item-type=[graph|tree|host|graph_template]
--item-id [--quiet]
Where item-id is the id of the object of type item-type
List Options:
--list-users
--list-trees
--list-graph-templates
--list-graphs --host-id=[ID]
20.9.1. List Users
The list of users is retrieved by calling the script with the parameter --list-users. It goes like
shell>php -q add_perms.php --list-users
Known Users:
id username full_name
1 admin Administrator
3 guest Guest Account
20.9.2. List Trees
The list of trees is retrieved by calling the script with the parameter --list-trees. It goes like
shell>php -q add_perms.php --list-trees
Known Trees:
id sort method name
1 Manual Ordering (No Sorting) Default Tree
20.9.3. List Graph Templates
The list of available graph templates is retrieved by calling the script with the parameter --list-graph-templates.
It goes like
shell>php -q add_perms.php --list-graph-templates
Known Graph Templates:(id, name)
2 Interface - Traffic (bits/sec)
3 ucd/net - Available Disk Space
4 ucd/net - CPU Usage
5 Karlnet - Wireless Levels
6 Karlnet - Wireless Transmissions
7 Unix - Ping Latency
8 Unix - Processes
9 Unix - Load Average
75](https://image.slidesharecdn.com/cactimanual-121101075848-phpapp01/75/Cacti-manual-80-2048.jpg)
![Chapter 20. Command Line Scripts
...
20.9.4. List Graphs for given Hosts
To be able to add a permissions to a specific Graph, the id of that very graph is required. Thus, a --list-graphs
--host-id=[id] option was implemented
shell>php -q add_perms.php --list-graphs --host-id=1
Known Host Graphs: (id, name, template)
1 Localhost - Memory Usage Linux - Memory Usage
2 Localhost - Load Average Unix - Load Average
3 Localhost - Logged in Users Unix - Logged in Users
4 Localhost - Processes Unix - Processes
5 Localhost - Traffic - eth0 Interface - Traffic (bits/sec, 95th Percentile)
33 Localhost - Used Space - Memory Buffers Host MIB - Available Disk Space
34 Localhost - Used Space - Real Memory Host MIB - Available Disk Space
35 Localhost - Used Space - Swap Space Host MIB - Available Disk Space
36 Localhost - Used Space - / Host MIB - Available Disk Space
37 Localhost - Used Space - /sys Host MIB - Available Disk Space
38 Localhost - Used Space - /boot Host MIB - Available Disk Space
20.9.5. Add Graph Permissions to specific Users
There are various ways to define graph permissions to specific users. First, we will add graph permissions for a given
host. This is done using the parameter --item-type=host as follows
shell>php -q add_perms.php --user-id=4 --item-type=host --item-id=1
--user-id=4 must specify an existing users. Else, an error message will be printed. As --item-type=host is given,
--item-id=1 must specify a valid host. Again, if no host with this specific id exists, an error message will be printed.
No output is produced on successful operations.
Next, we will add graph permissions for a given tree. This is done using the parameter --item-type=tree as follows
shell>php -q add_perms.php --user-id=4 --item-type=tree --item-id=1
--user-id=4 must specify an existing users. Else, an error message will be printed. As --item-type=tree is given,
--item-id=1 must specify a valid tree (the Default Tree in this case). Again, if no tree with this specific id exists, an
error message will be printed. No output is produced on successful operations.
Adding graph permissions for a given graph template is done using the parameter --item-type=graph_template
as follows
shell>php -q add_perms.php --user-id=4 --item-type=graph_template --item-id=25
--user-id=4 must specify an existing users. Else, an error message will be printed. As
--item-type=graph_template is given, --item-id=1 must specify a valid graph_template (the Interface - Traffic
(bytes/sec) in this case). Again, if no graph template with this specific id exists, an error message will be printed. No
output is produced on successful operations.
Last but not least we add graph permissions for a given graph by using the parameter --item-type=graph as follows
shell>php -q add_perms.php --user-id=4 --item-type=graph --item-id=8
--user-id=4 must specify an existing users. Else, an error message will be printed. As --item-type=graph is given,
--item-id=1 must specify a valid graph. Again, if no graph template with this specific id exists, an error message
will be printed. No output is produced on successful operations.
76](https://image.slidesharecdn.com/cactimanual-121101075848-phpapp01/75/Cacti-manual-81-2048.jpg)
![Chapter 21. Debugging
Cacti users sometimes complain about NaN’s in their graphs. Unfortunately, there are several reasons for this result.
The following is a step-by-step procedure recommended for debugging.
21.1. Check Cacti Log File
Please have a look at your cacti log file. Usually, you’ll find it at <path_cacti>/log/cacti.log. Else see Settings,
Paths. Check for this kind of error:
CACTID: Host[...] DS[....] WARNING: SNMP timeout detected [500 ms], ignoring host ’........’
For "reasonable" timeouts, this may be related to a snmpbulkwalk issue. To change this, see Settings, Poller and
lower the value for The Maximum SNMP OID’s Per SNMP Get Request. Start at a value of 1 and increase it again, if
the poller starts working. Some agent’s don’t have the horsepower to deliver that many OID’s at a time. Therefore,
we can reduce the number for those older/underpowered devices.
21.2. Check Basic Data Gathering
For scripts, run them as cactiuser from cli to check basic functionality. E.g. for a perl script named
your-perl-script.pl with parameters "p1 p2" under *nix this would look like:
su - cactiuser
/full/path/to/perl your-perl-script.pl p1 p2
... (check output)
For snmp, snmpget the _exact_ OID you’re asking for, using same community string and snmp version as defined
within cacti. For an OID of .1.3.6.1.4.something, community string of very-secret and version 2 for target host
target-host this would look like
snmpget -c very-secret -v 2c target-host .1.3.6.1.4.something
.... (check output)
21.3. Check cacti’s poller
First make sure that crontab always shows poller.php. This program will either call cmd.php, the PHP based poller
_or_ cactid, the fast alternative, written in C. Define the poller you’re using at Settings, Poller. Cactid has to be
implemented seperately, it does not come with cacti by default.
Now, clear ./log/cacti.log (or rename it to get a fresh start)
Then, change Settings, Poller Logging Level to DEBUG for _one_ polling cycle. You may rename this log as well
to avoid more stuff added to it with subsequent polling cycles.
Now, find the host/data source in question. The Host[<id>] is given numerically, the <id> being a specific number
for that host. Find this <id> from the Devices menue when editing the host: The url contains a string like
id=<id>
Check, whether the output is as expected. If not, check your script (e.g. /full/path/to/perl). If ok, proceed to next
step
This procedure may be replaced by running the poller manually for the failing host only. To do so, you need the <id>,
again. If you’re using cmd.php, set the DEBUG logging level as defined above and run
php -q cmd.php <id> <id>
If you’re using cactid, you may override logging level when calling the poller:
./cactid --verbosity=5 <id> <id>
All output is printed to STDOUT in both cases. This procdure allows for repeated tests without waiting for the next
polling interval. And there’s no need to manually search for the failing host between hundreds of lines of output.](https://image.slidesharecdn.com/cactimanual-121101075848-phpapp01/75/Cacti-manual-82-2048.jpg)
![Chapter 21. Debugging
21.4. Check MySQL updating
In most cases, this step make be skipped. You may want to return to this step, if the next one fails (e.g. no rrdtool
update to be found)
From debug log, please find the MySQL update statement for that host concerning table poller_output. On very rare
occasions, this will fail. So please copy that sql statement and paste it to a mysql session started from cli. This may as
well be done from some tool like phpMyAdmin. Check the sql return code.
21.5. Check rrd file updating
Down in the same log, you should find some
rrdtool update <filename> --template ...
You should find exactly one update statement for each file.
RRD files should be created by the poller. If it does not create them, it will not fill them either. If it does, please check
your Poller Cache from Utilities and search for your target. Does the query show up here?
21.6. Check rrd file ownership
If rrd files were created e.g. with root ownership, a poller running as cactiuser will not be able to update those files
cd /var/www/html/cacti/rra
ls -l localhost*
-rw-r--r-- 1 root root 463824 May 31 12:40 localhost_load_1min_5.rrd
-rw-r--r-- 1 cactiuser cactiuser 155584 Jun 1 17:10 localhost_mem_buffers_3.rrd
-rw-r--r-- 1 cactiuser cactiuser 155584 Jun 1 17:10 localhost_mem_swap_4.rrd
-rw-r--r-- 1 cactiuser cactiuser 155584 Jun 1 17:10 localhost_proc_7.rrd
-rw-r--r-- 1 cactiuser cactiuser 155584 Jun 1 17:10 localhost_users_6.rrd
Run the following command to cure this problem
chown cactiuser:cactiuser *.rrd
21.7. Check rrd file numbers
You’re perhaps wondering about this step, if the former was ok. But due to data sources MINIMUM and MAXIMUM
definitions, it is possible, that valid updates for rrd files are suppressed, because MINIMUM was not reached or
MAXIMUM was exceeded.
Assuming, you’ve got some valid rrdtool update in step 3, perform a
rrdtool fetch <rrd file> AVERAGE
and look at the last 10-20 lines. If you find NaN’s there, perform
rrdtool info <rrd file>
and check the ds[...].min and ds[...].max entries, e.g.
ds[loss].min = 0.0000000000e+00
ds[loss].max = 1.0000000000e+02
In this example, MINIMUM = 0 and MAXIMUM = 100. For a ds.[...].type=GAUGE verify, that e.g. the number
returned by the script does not exceed ds[...].MAX (same holds for MINIMUM, respectively).
If you run into this, please do not only update the data source definition within the Data Template, but perform a
rrdtool tune <rrd file> --maximum <ds-name>:<new ds maximum>
for all existing rrd files belonging to that Data Template.
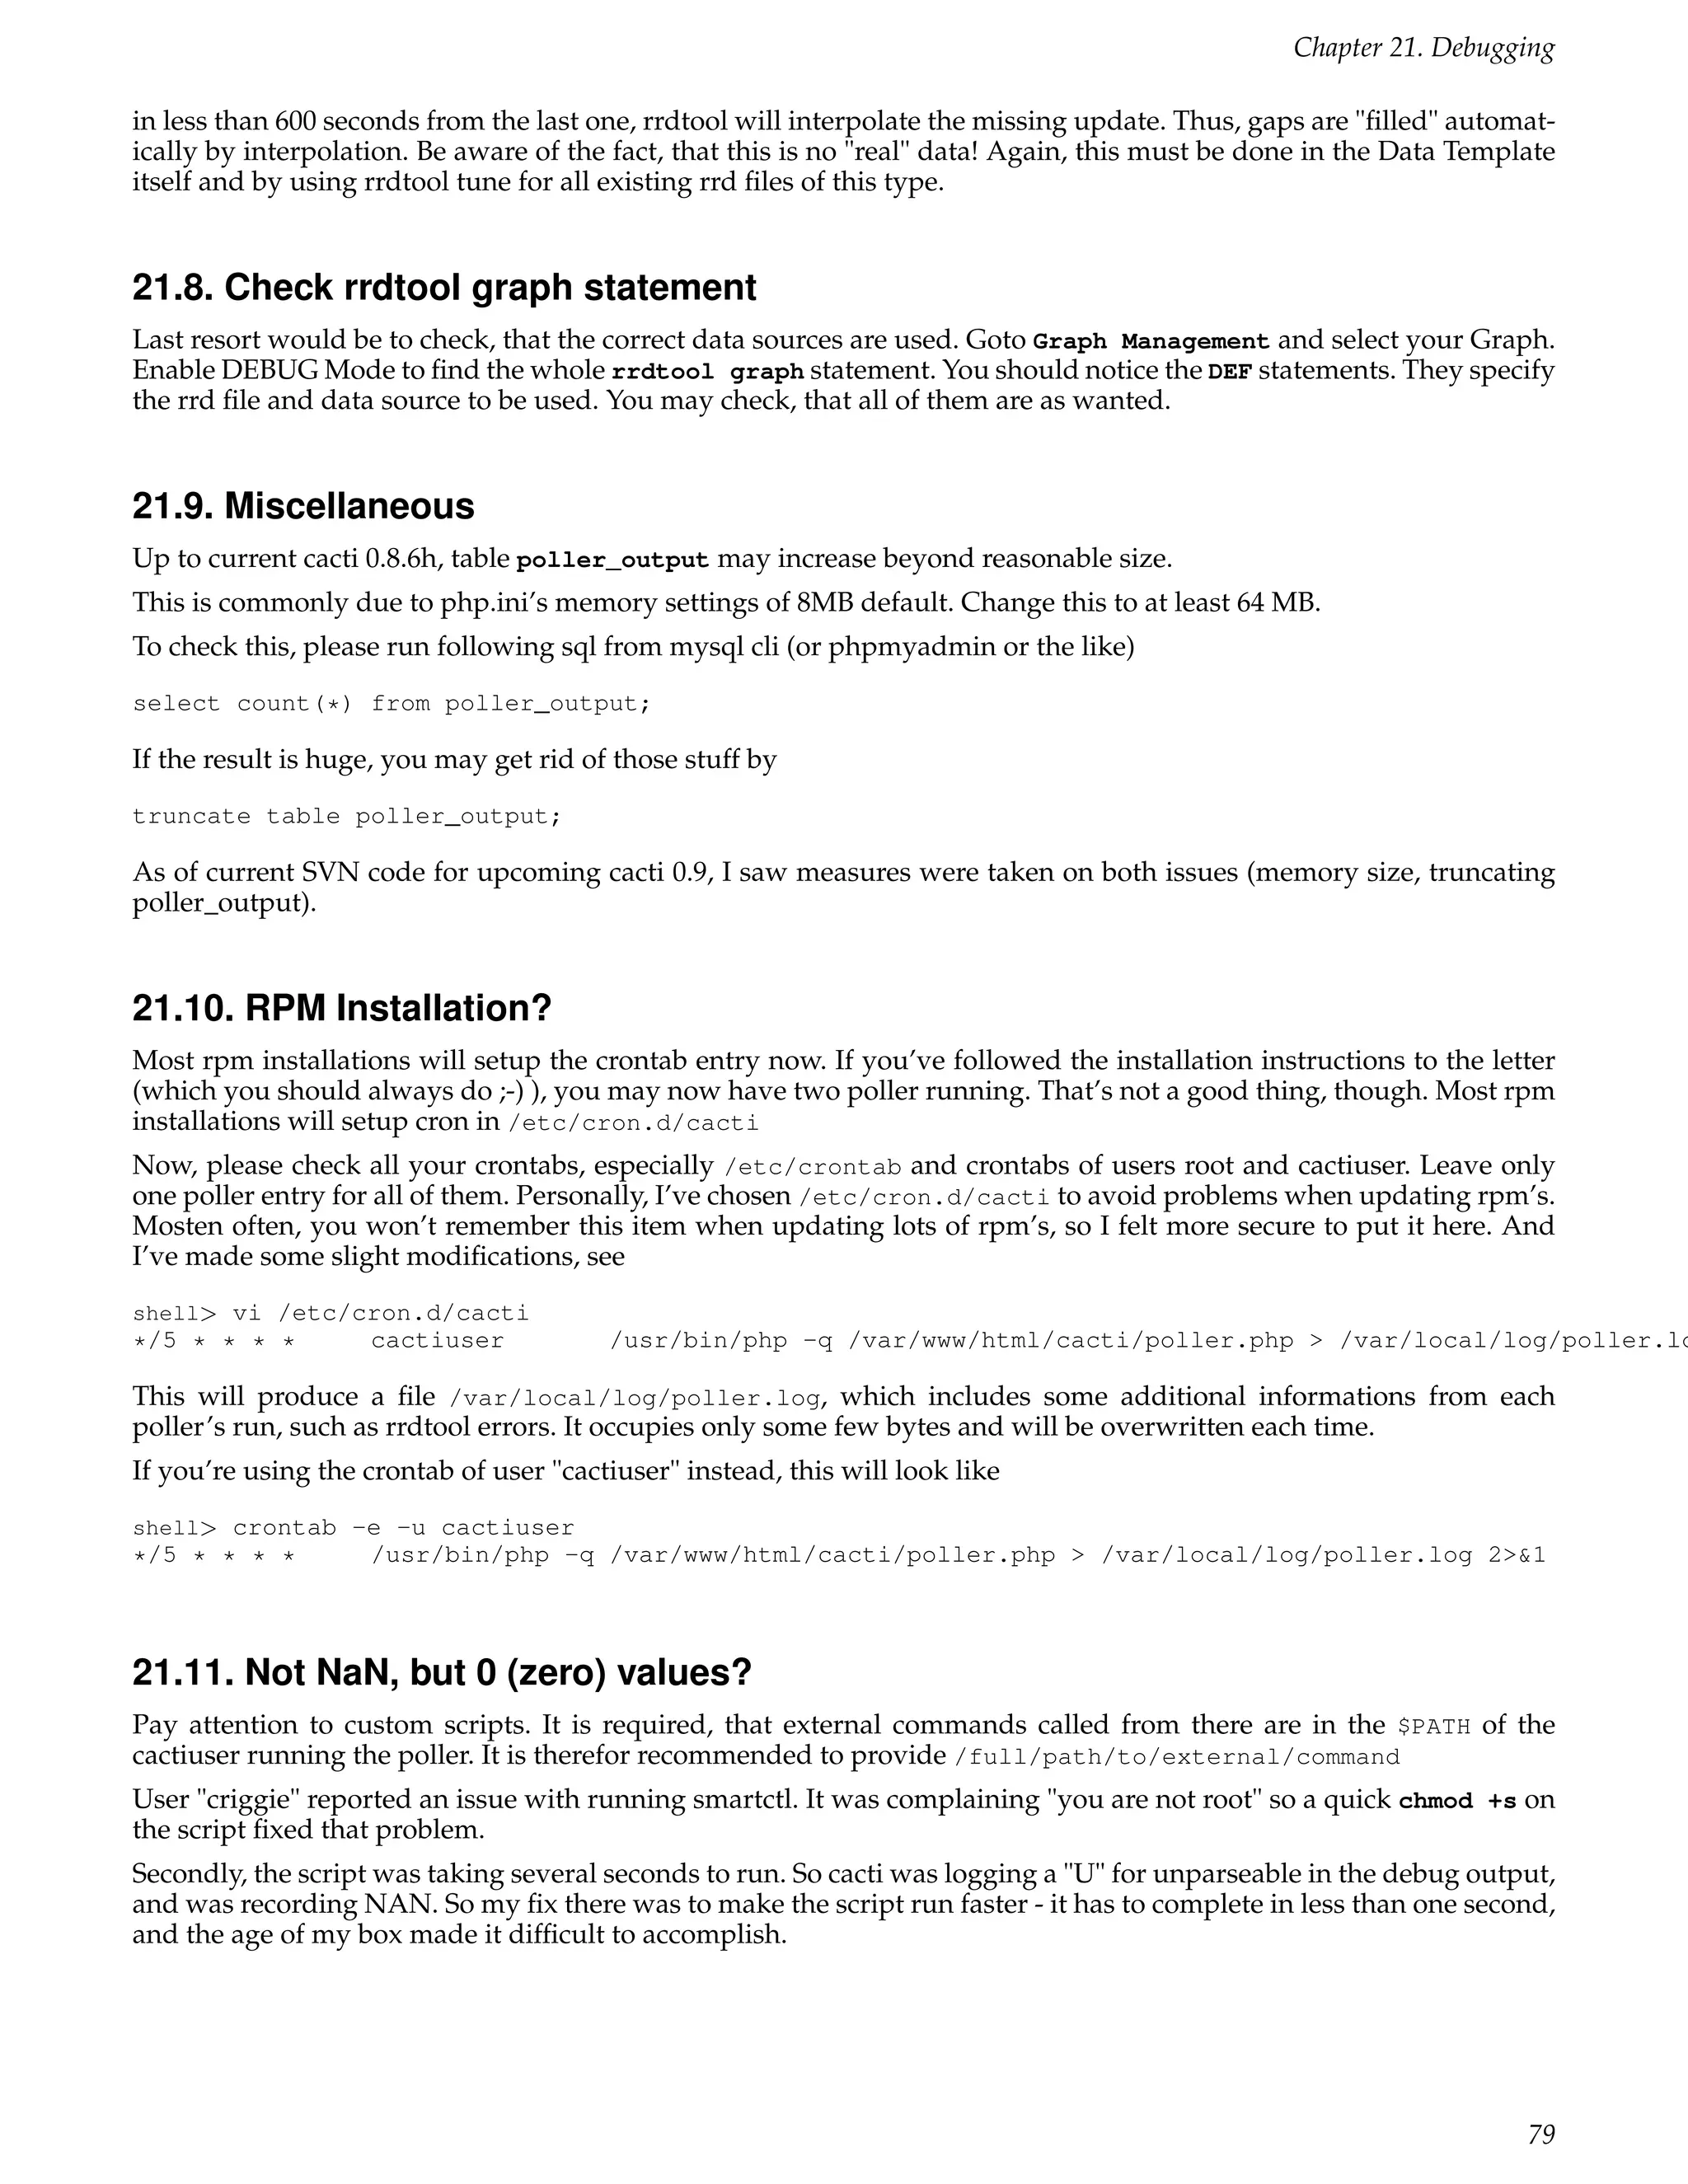
At this step, it is wise to check step and heartbeat of the rrd file as well. For standard 300 seconds polling intervals
(step=300), it is wise to set minimal_heartbeat to 600 seconds. If a single update is missing and the next one occurs
78](https://image.slidesharecdn.com/cactimanual-121101075848-phpapp01/75/Cacti-manual-83-2048.jpg)

This document is the manual for Cacti, an open source network monitoring and graphing tool. It contains instructions for installing Cacti on Unix and Windows systems, including required packages and configuration steps. It also provides basics on how Cacti works including retrieving and storing data, presenting graphs, and creating devices and graphs. Advanced topics covered include customizing data collection and storage using templates, scripts, and queries.