Download to read offline


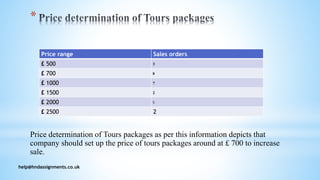
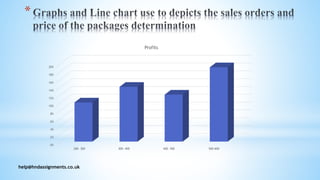


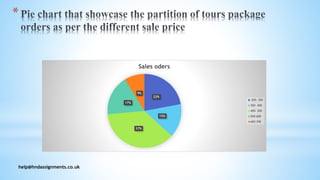


This document analyzes sales order data and profits from different price points for tour packages. Graphs and charts are used to evaluate the relationship between price and orders. The analysis finds that setting a price of £700 would likely increase sales based on the presented data. It examines correlation between price and order frequency, finding they are highly related with changes in one linked to changes in the other. The conclusion is that business decision making requires a systematic analysis of factors and their relationships to help determine optimal pricing.


![negotiating issues_Decision making for business leaders [compatibility mode]](https://cdn.slidesharecdn.com/ss_thumbnails/decisionmakingforbusinessleaderscompatibilitymode-100419071257-phpapp01-thumbnail.jpg?width=640&height=640&fit=bounds)


