This document provides training modules for using ArcGIS and the Business Analyst extension to perform site selection analysis. It covers essential operational issues, including file management, defining study areas, site prospecting, and optimizing analyses, while permitting academic use only. The modules, developed by Mike Reibel for the California State University GIS Specialty Center, do not instruct on basic ArcGIS operations or the broader theory of site selection.


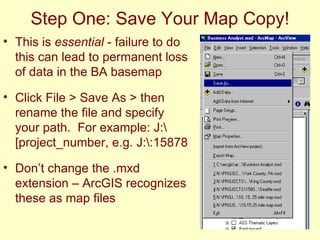
![File Management 1 Analyses and reports are automatically written to the default study area path If you work in a non-default path, e.g. J:\StudyAreas, analyses will be written to J:\StudyAreas\[AreaName]\Analyses\temp\*.* You may wish to store finished map files and reports in a separate location on disk from your preferred working path](https://image.slidesharecdn.com/business-analyst-modules-20941/85/Business-Analyst-Modules-10-320.jpg)


![Give the Store Layer a name and click Finish. The layer is added Layer symbolized by triangle looks identical to Monorail location [star], but is recognized as a store layer for analysis.](https://image.slidesharecdn.com/business-analyst-modules-20941/85/Business-Analyst-Modules-29-320.jpg)