Downloaded 12 times
![© Ricardo-AEA LtdRicardo-AEA in Confidence3
Challenges in the water sector
CIWEM, 2013. A BLUEPRINT FOR CARBON EMISSIONS REDUCTION IN THE UK WATER INDUSTRY, CIWEM. Available at: http://www.ciwem.org/media/959404/BLUEPRINT_WEB.pdf
[Accessed August 19, 2013].](https://image.slidesharecdn.com/burtonaaronpresentationazerbaijanprepvfinal1-150407093805-conversion-gate01/75/Climate-change-mitigation-and-adaptation-actions-for-the-water-sector-international-experience-3-2048.jpg)
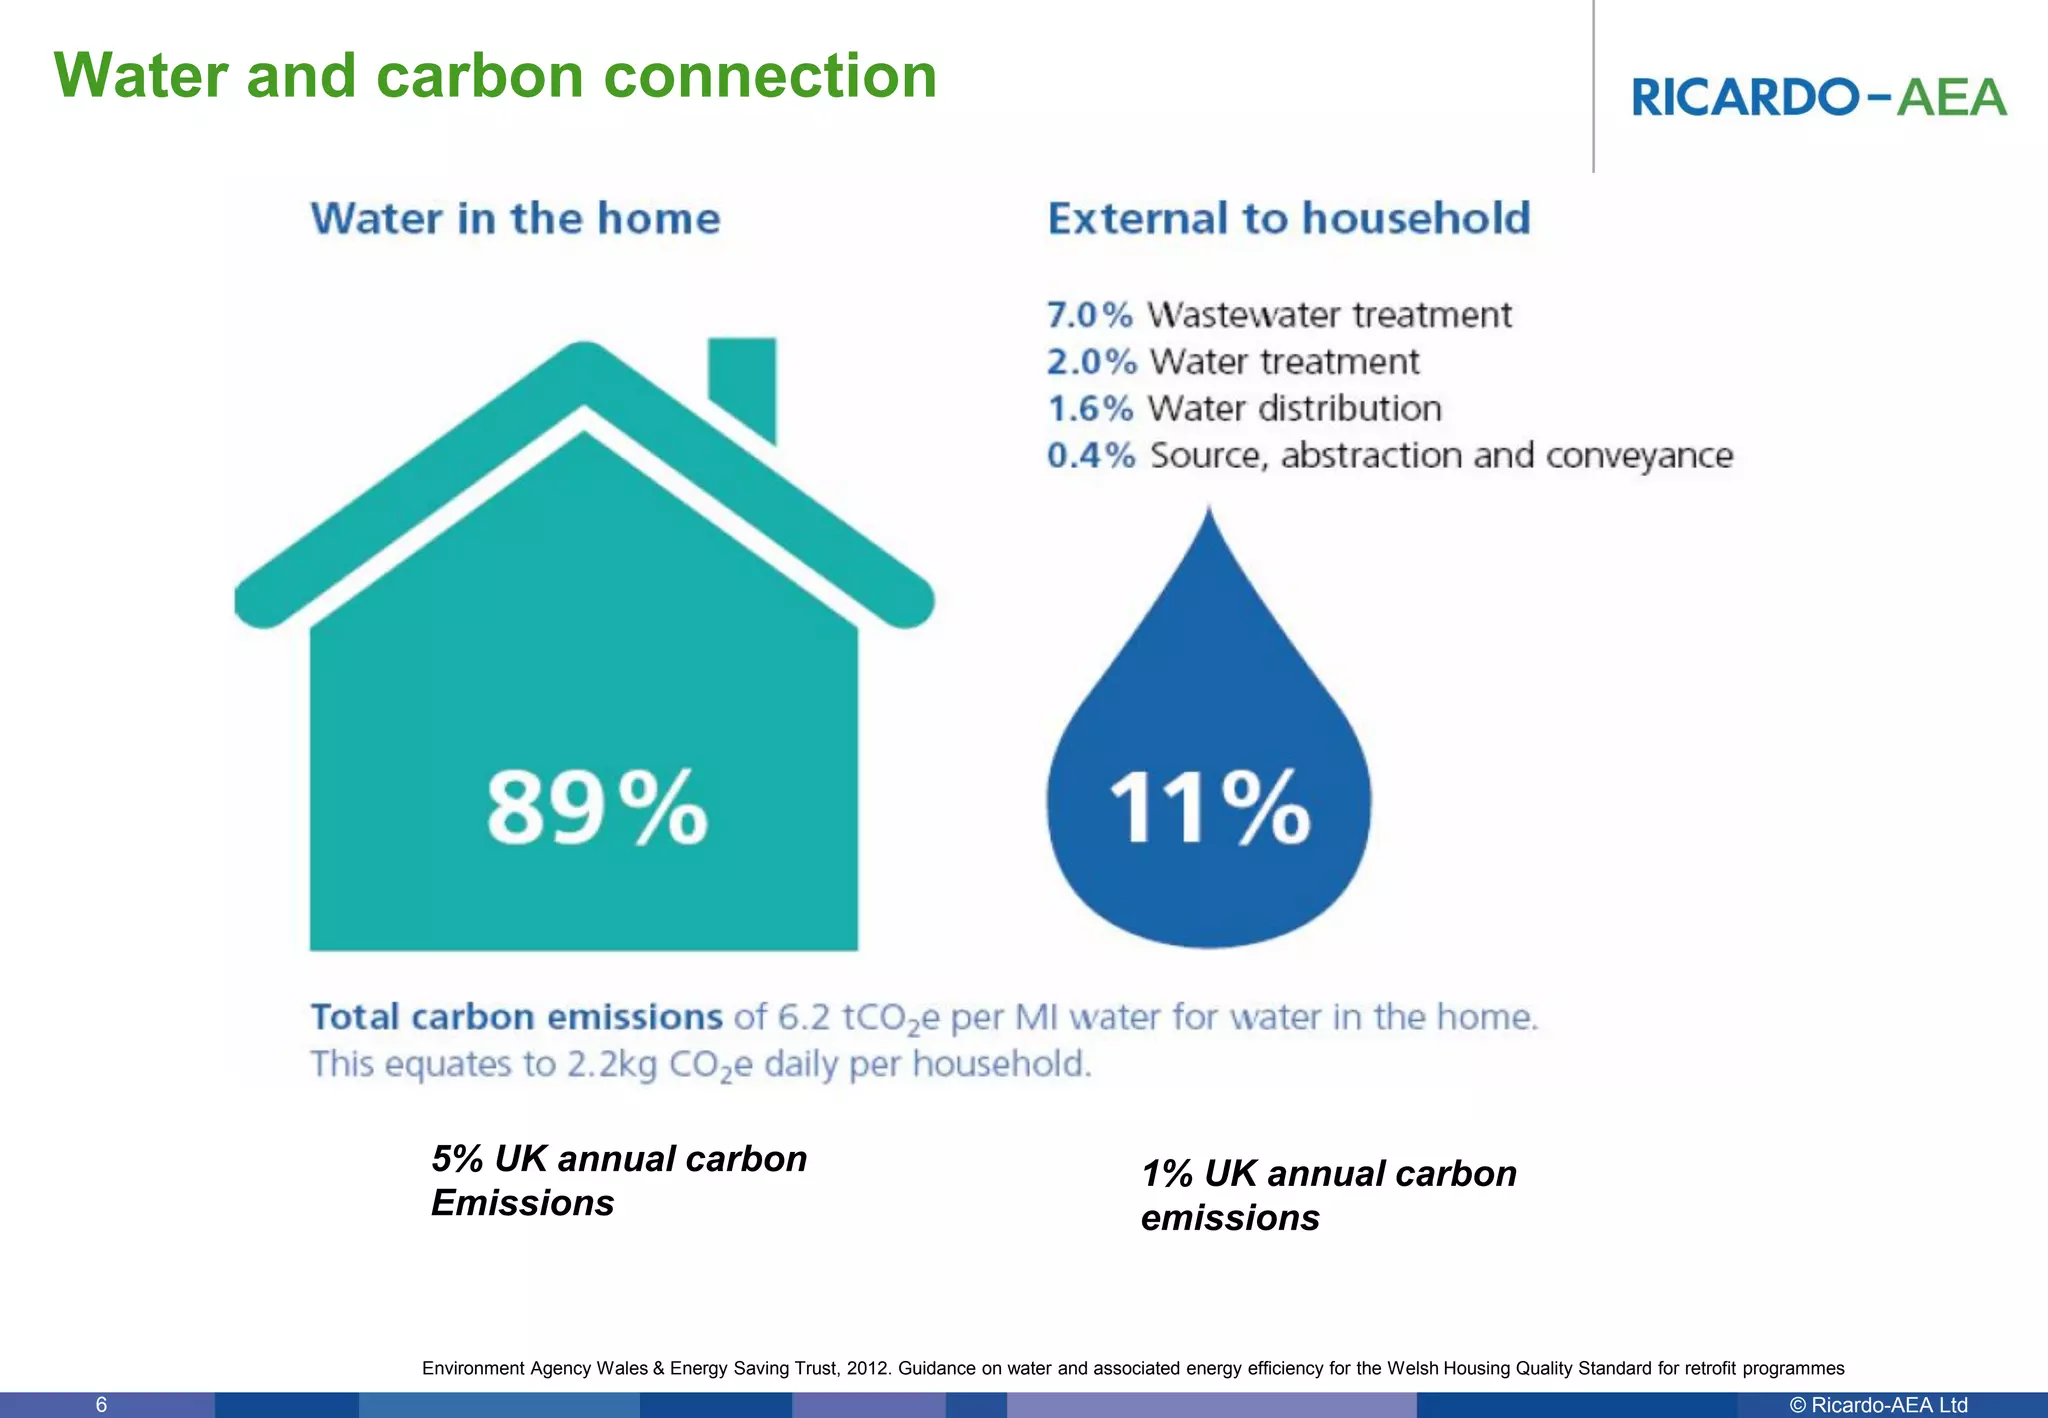
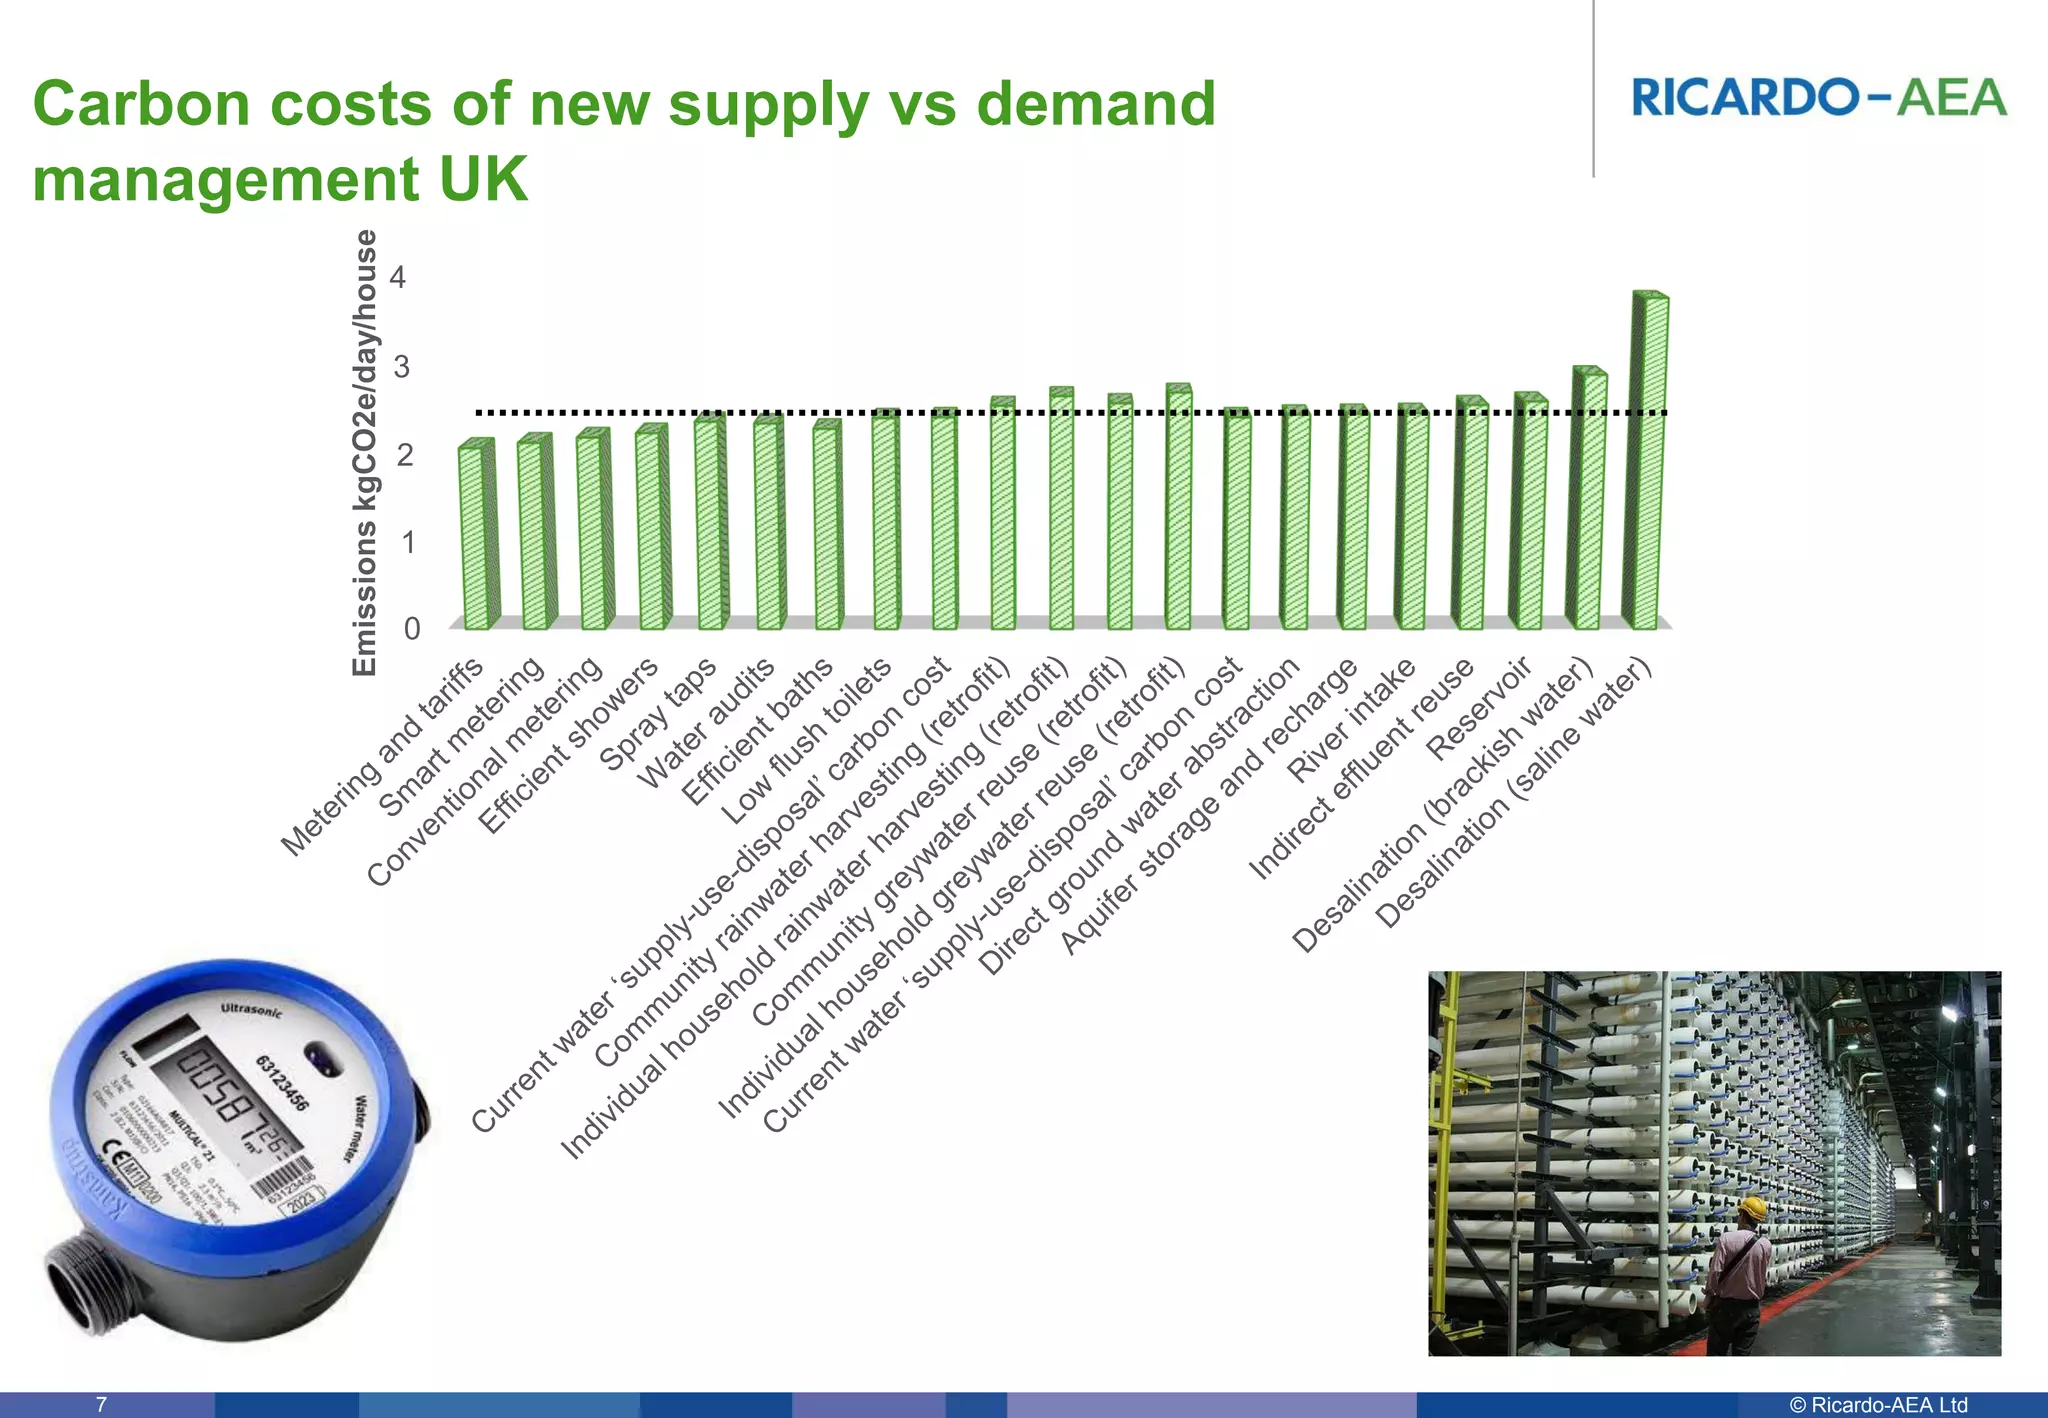
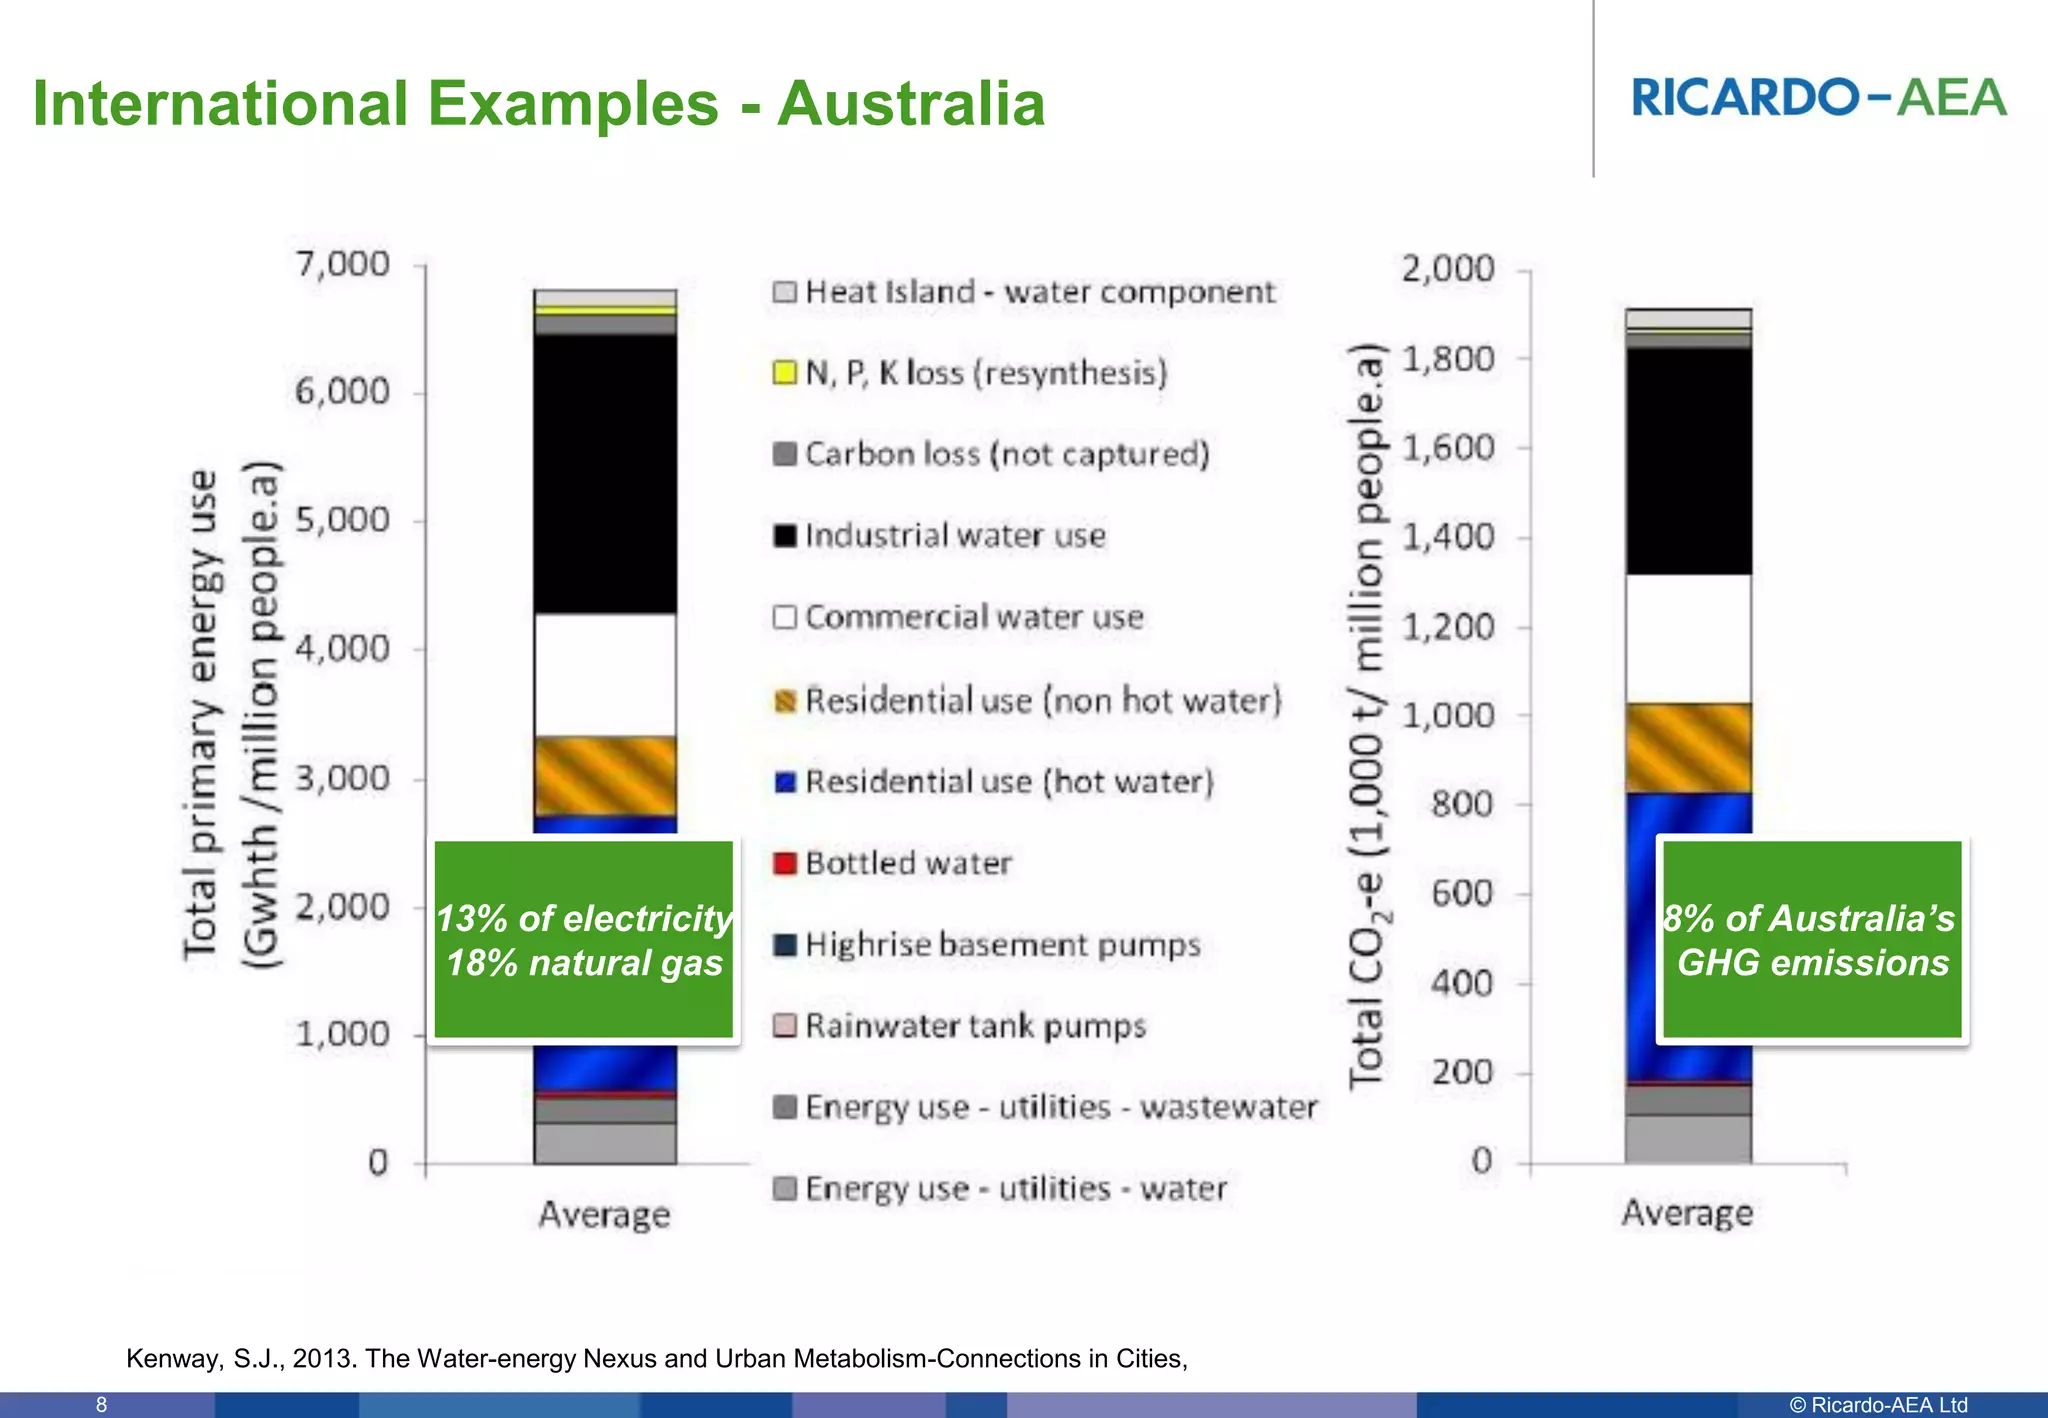
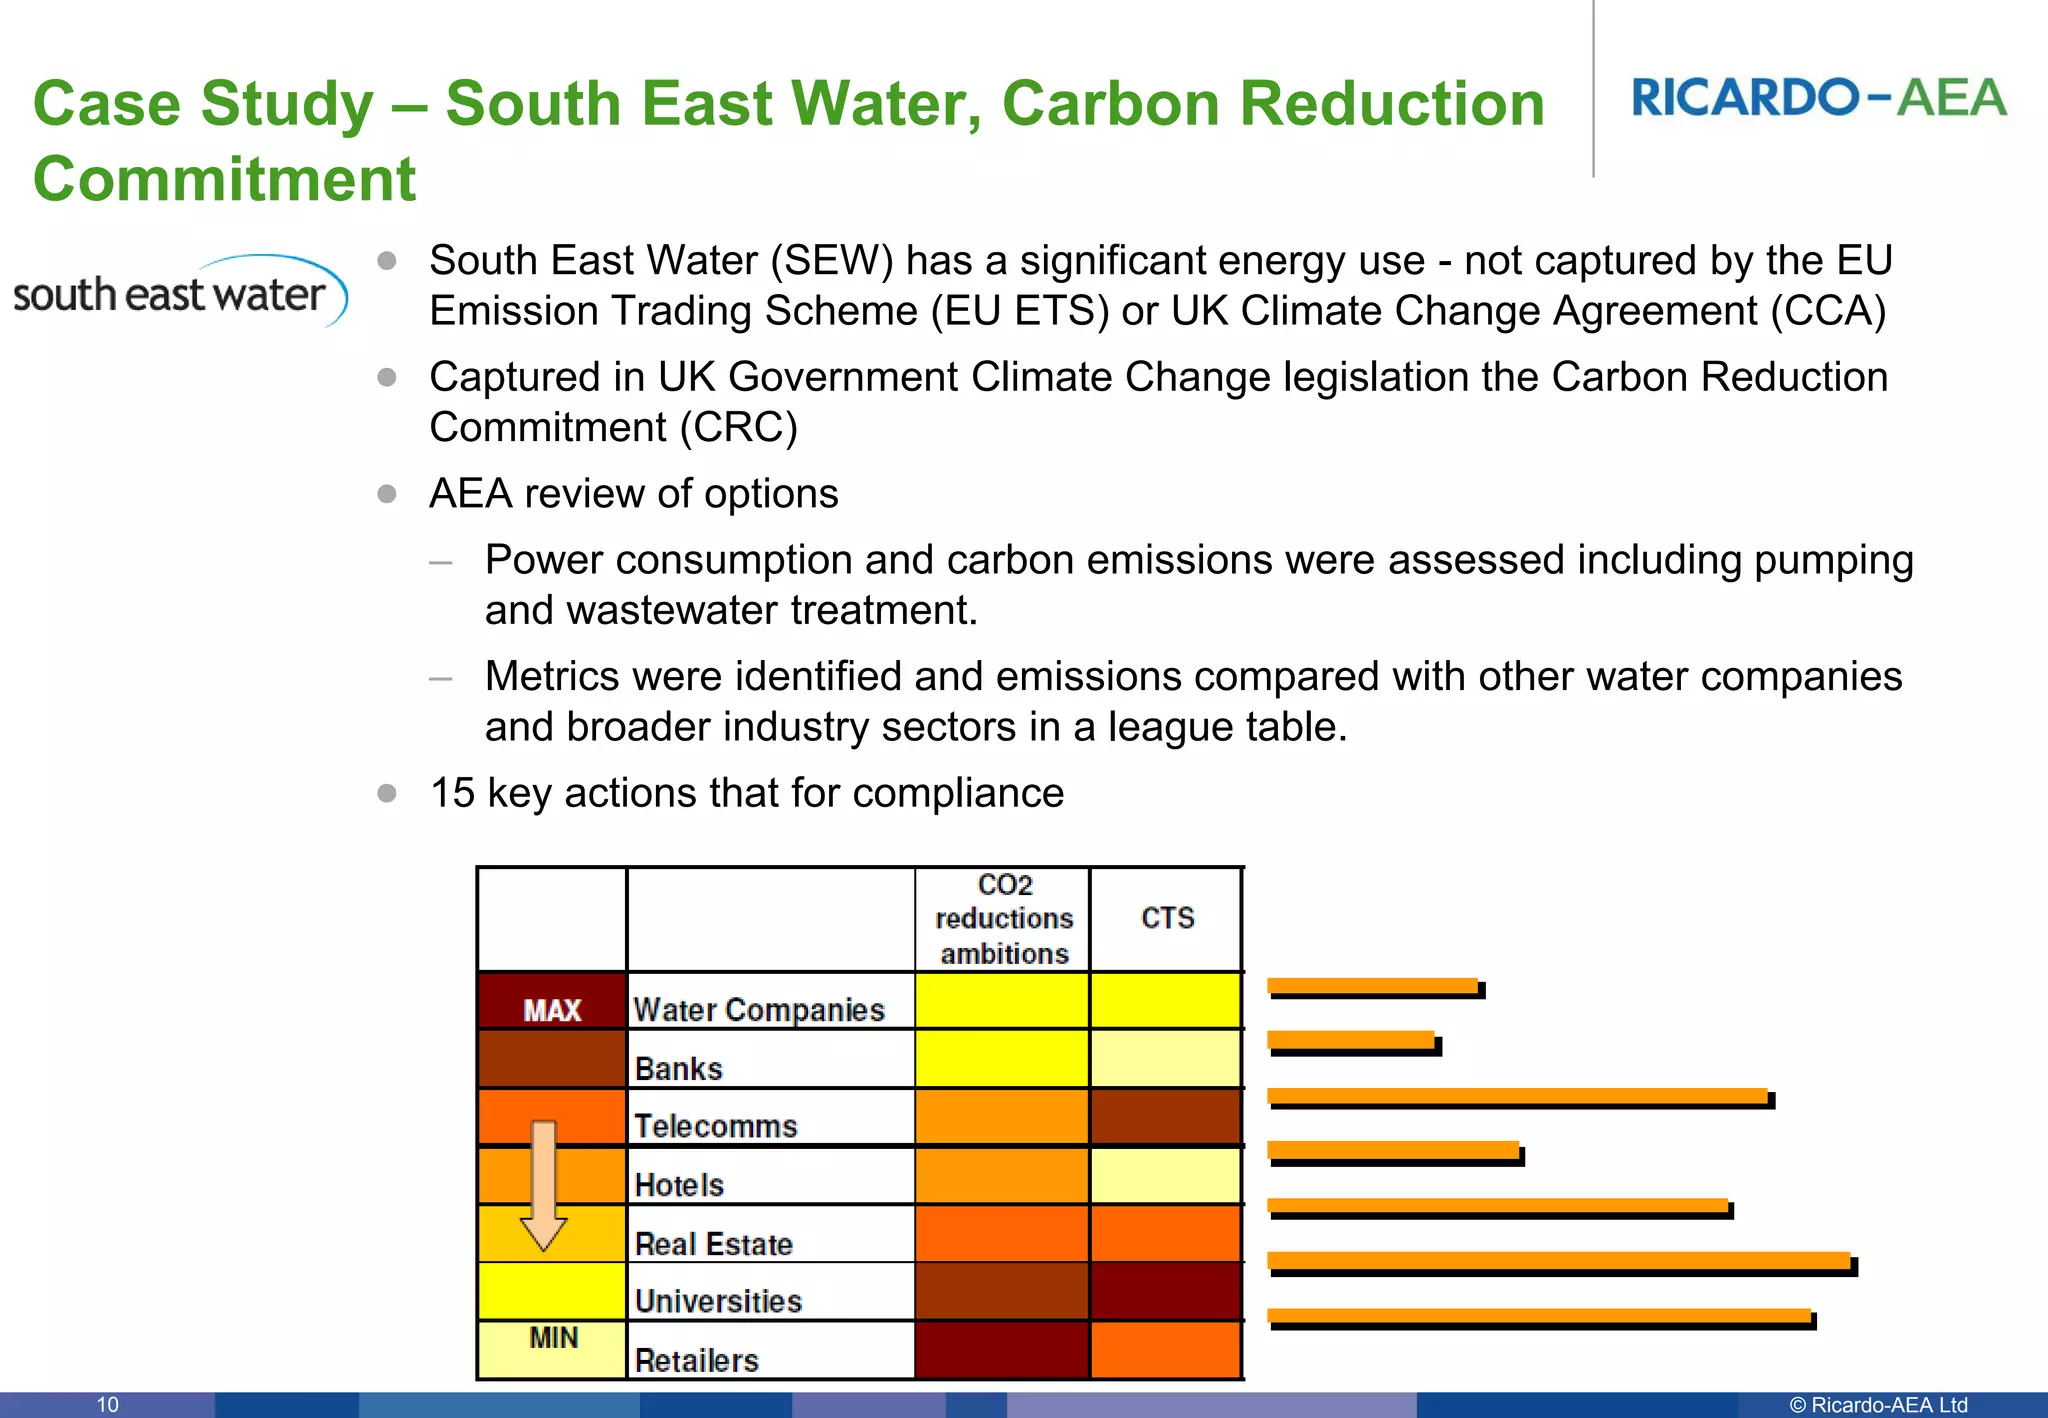
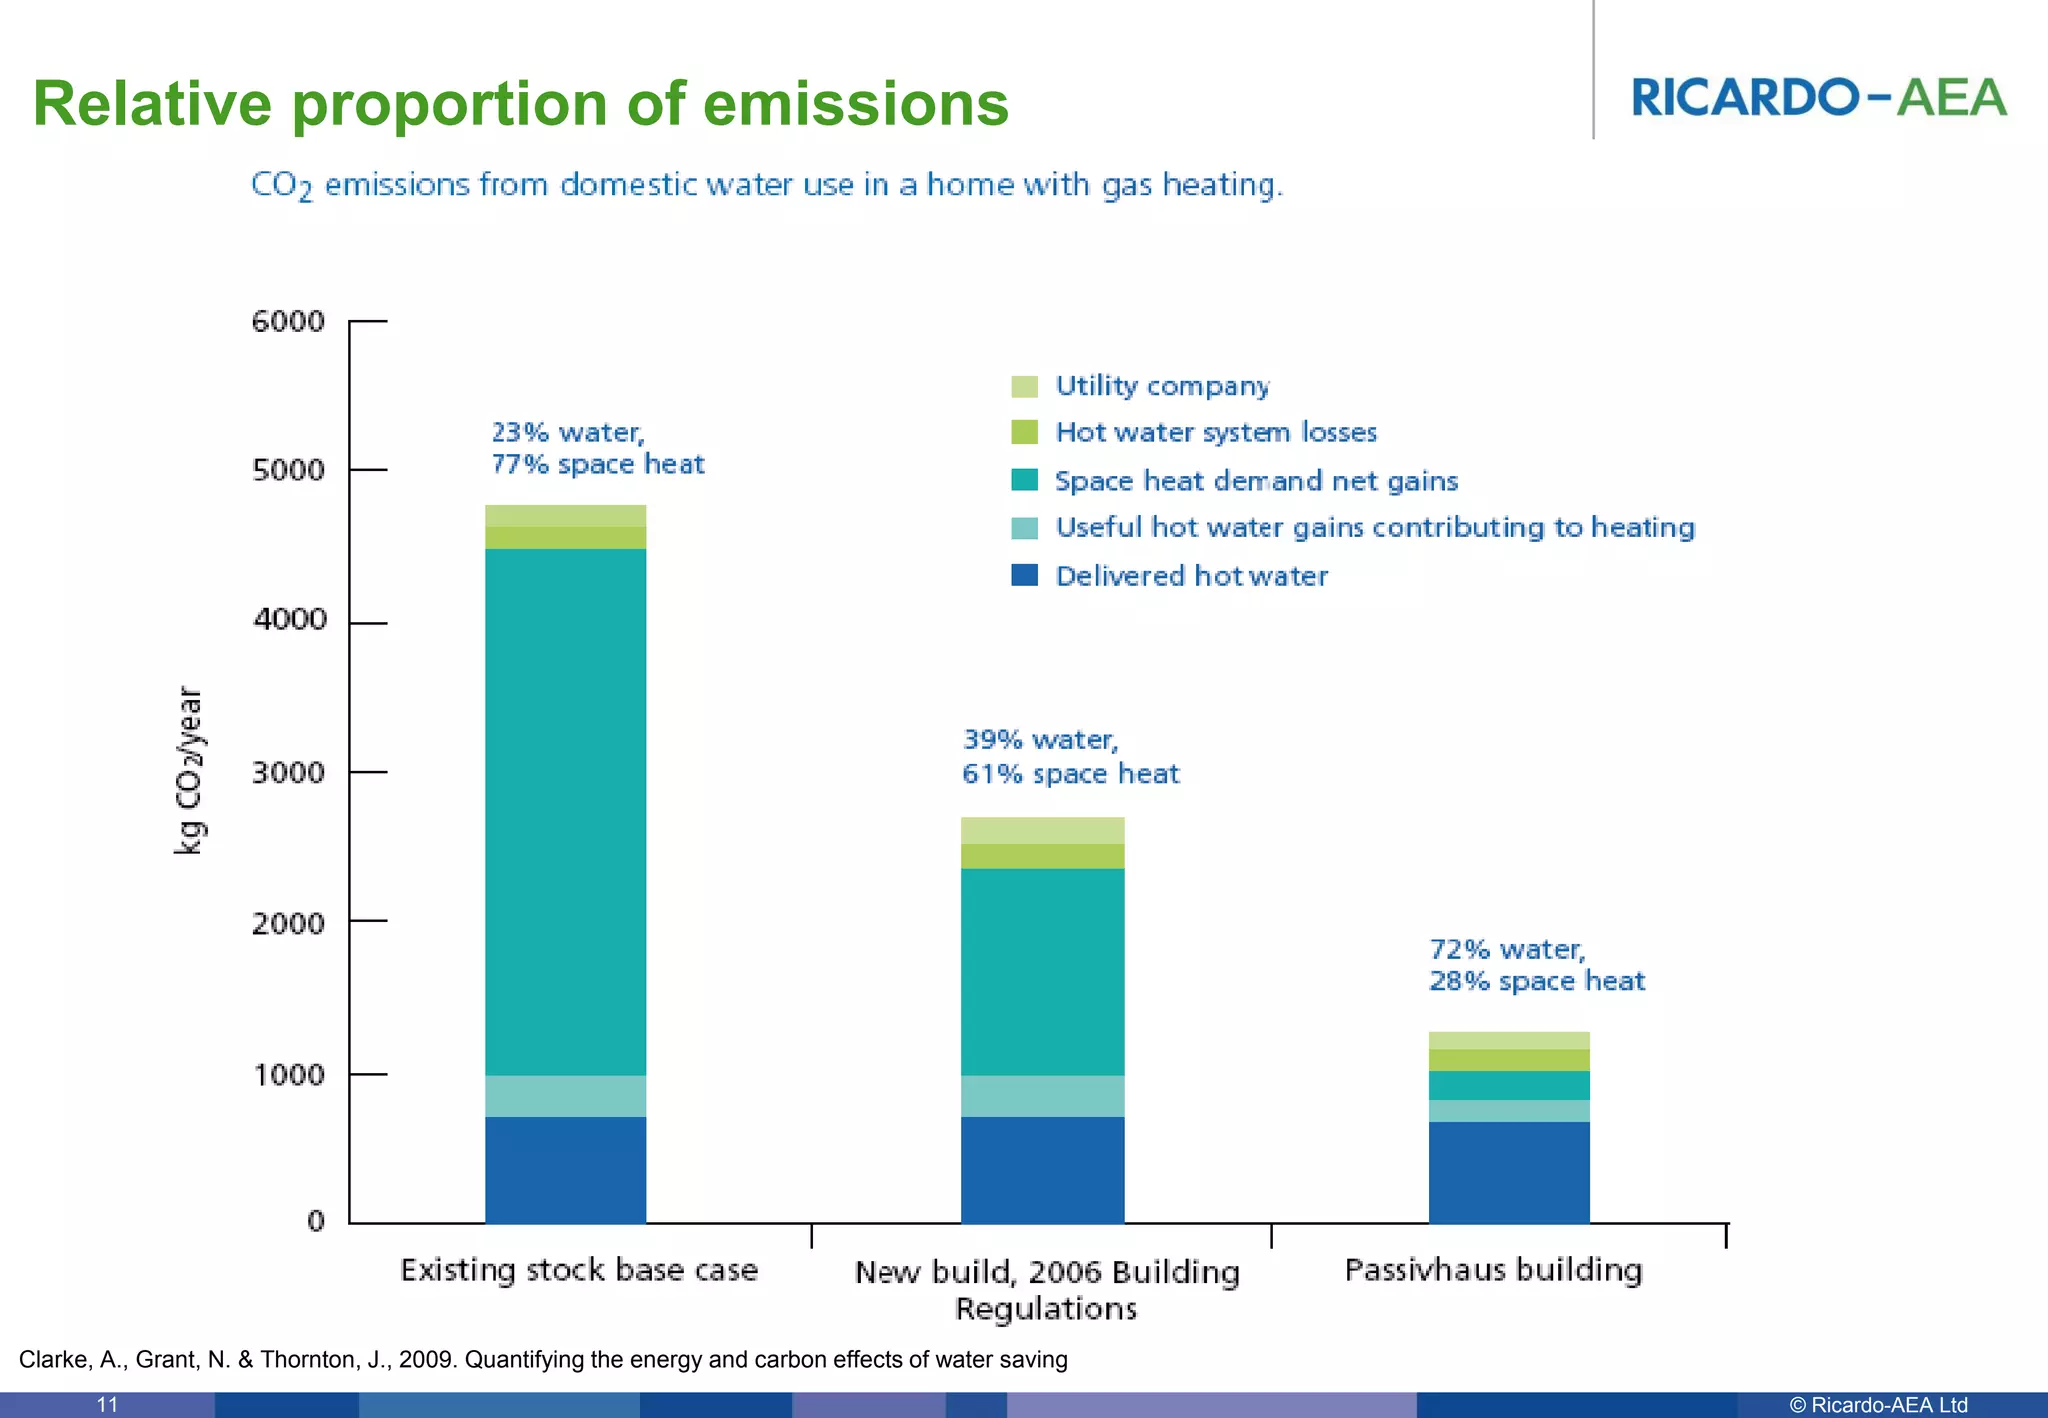
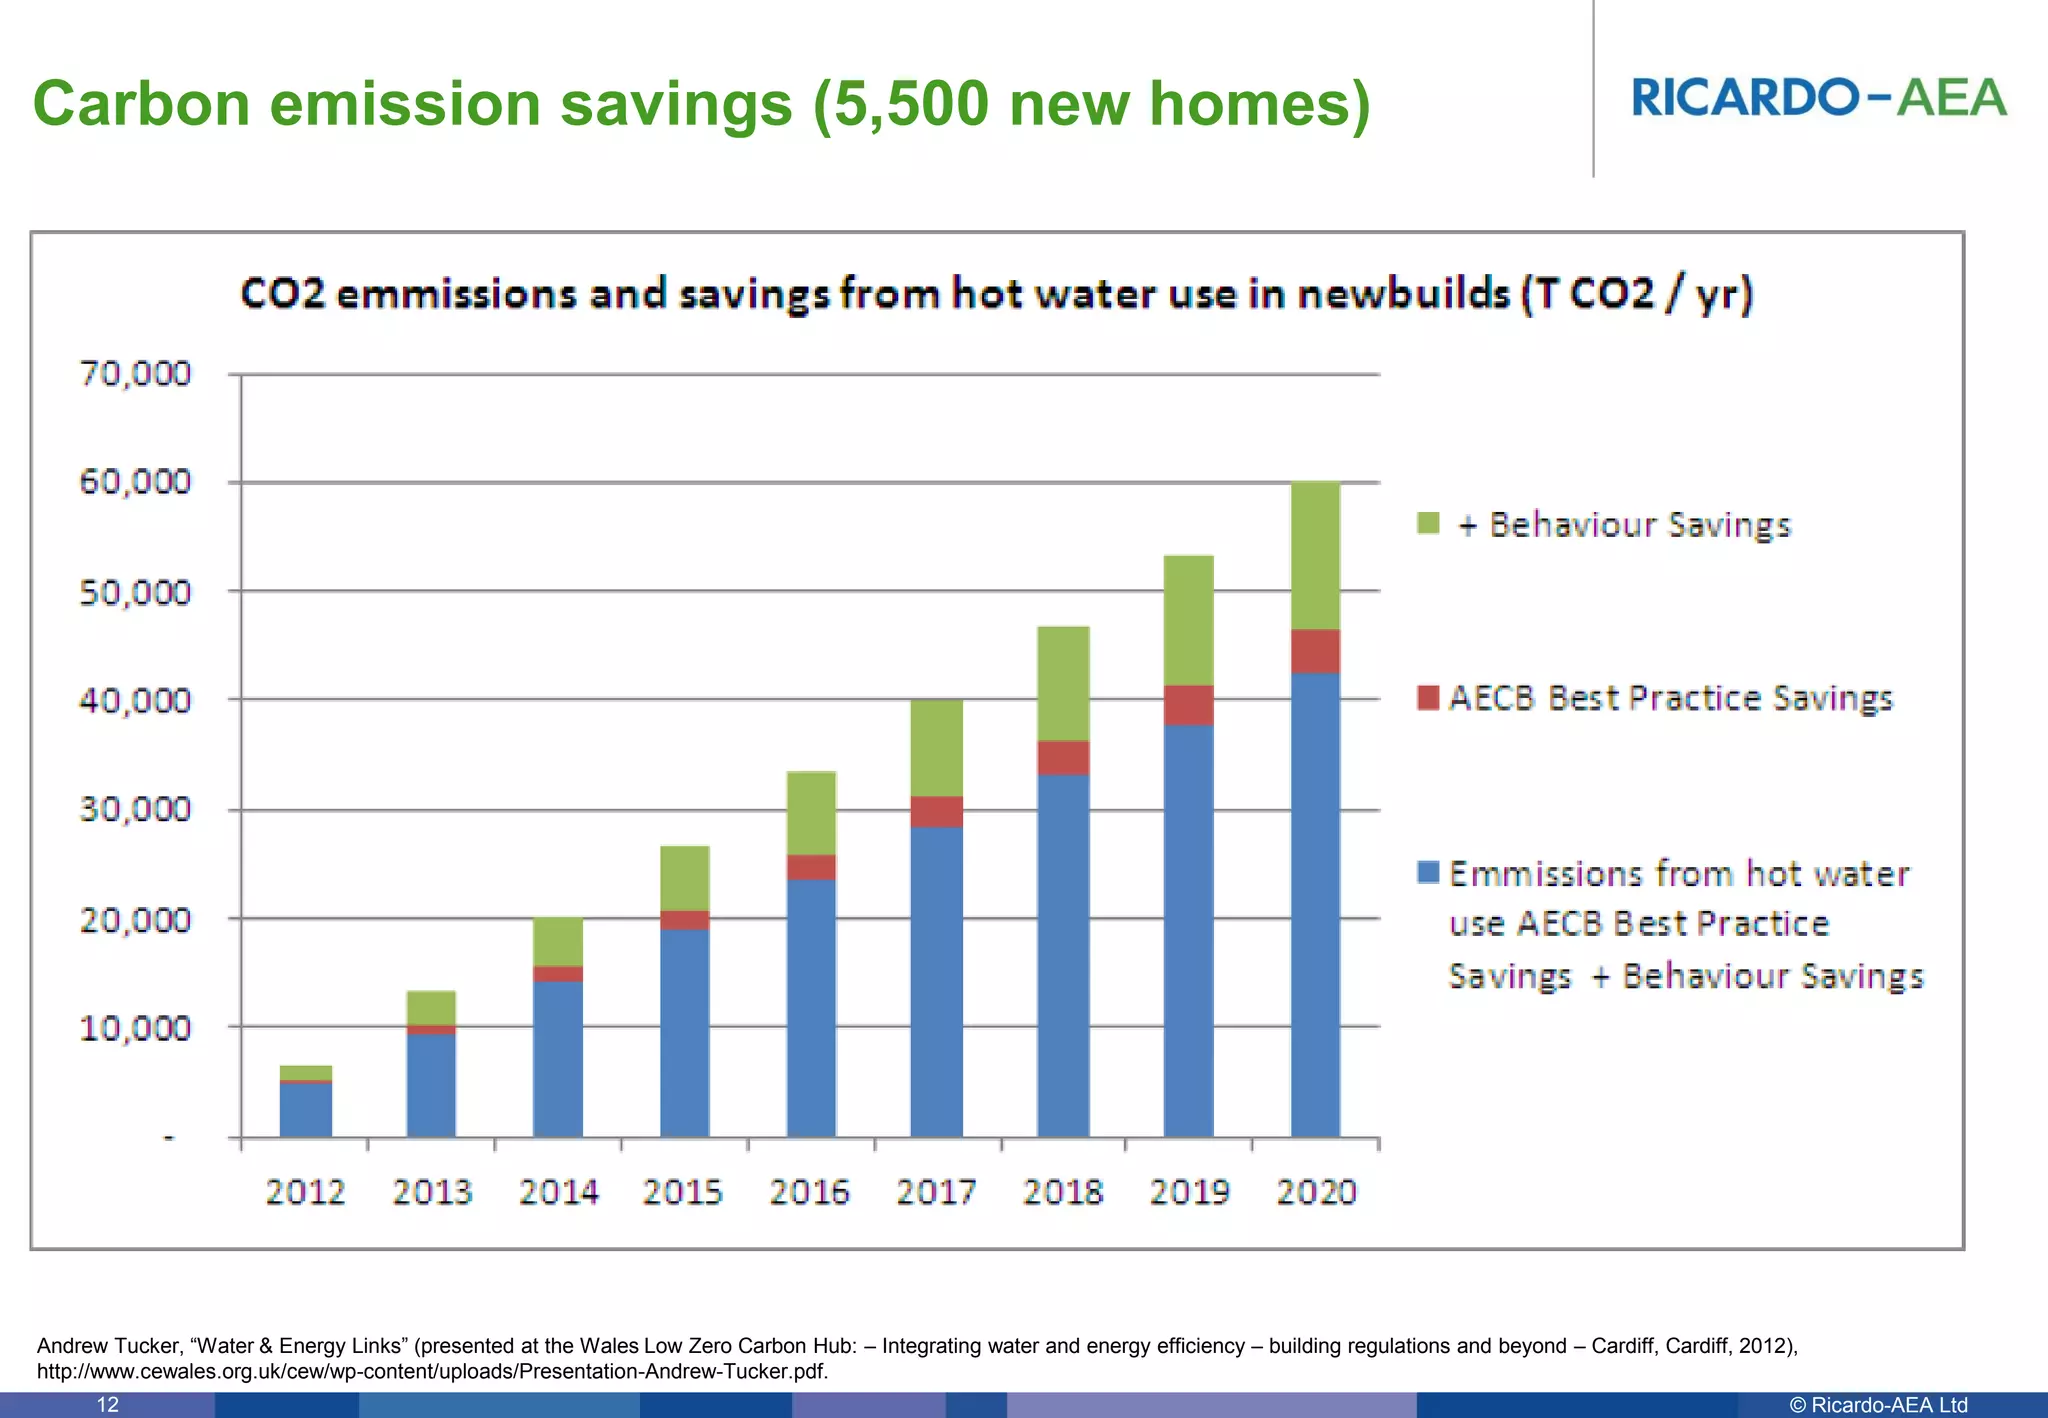
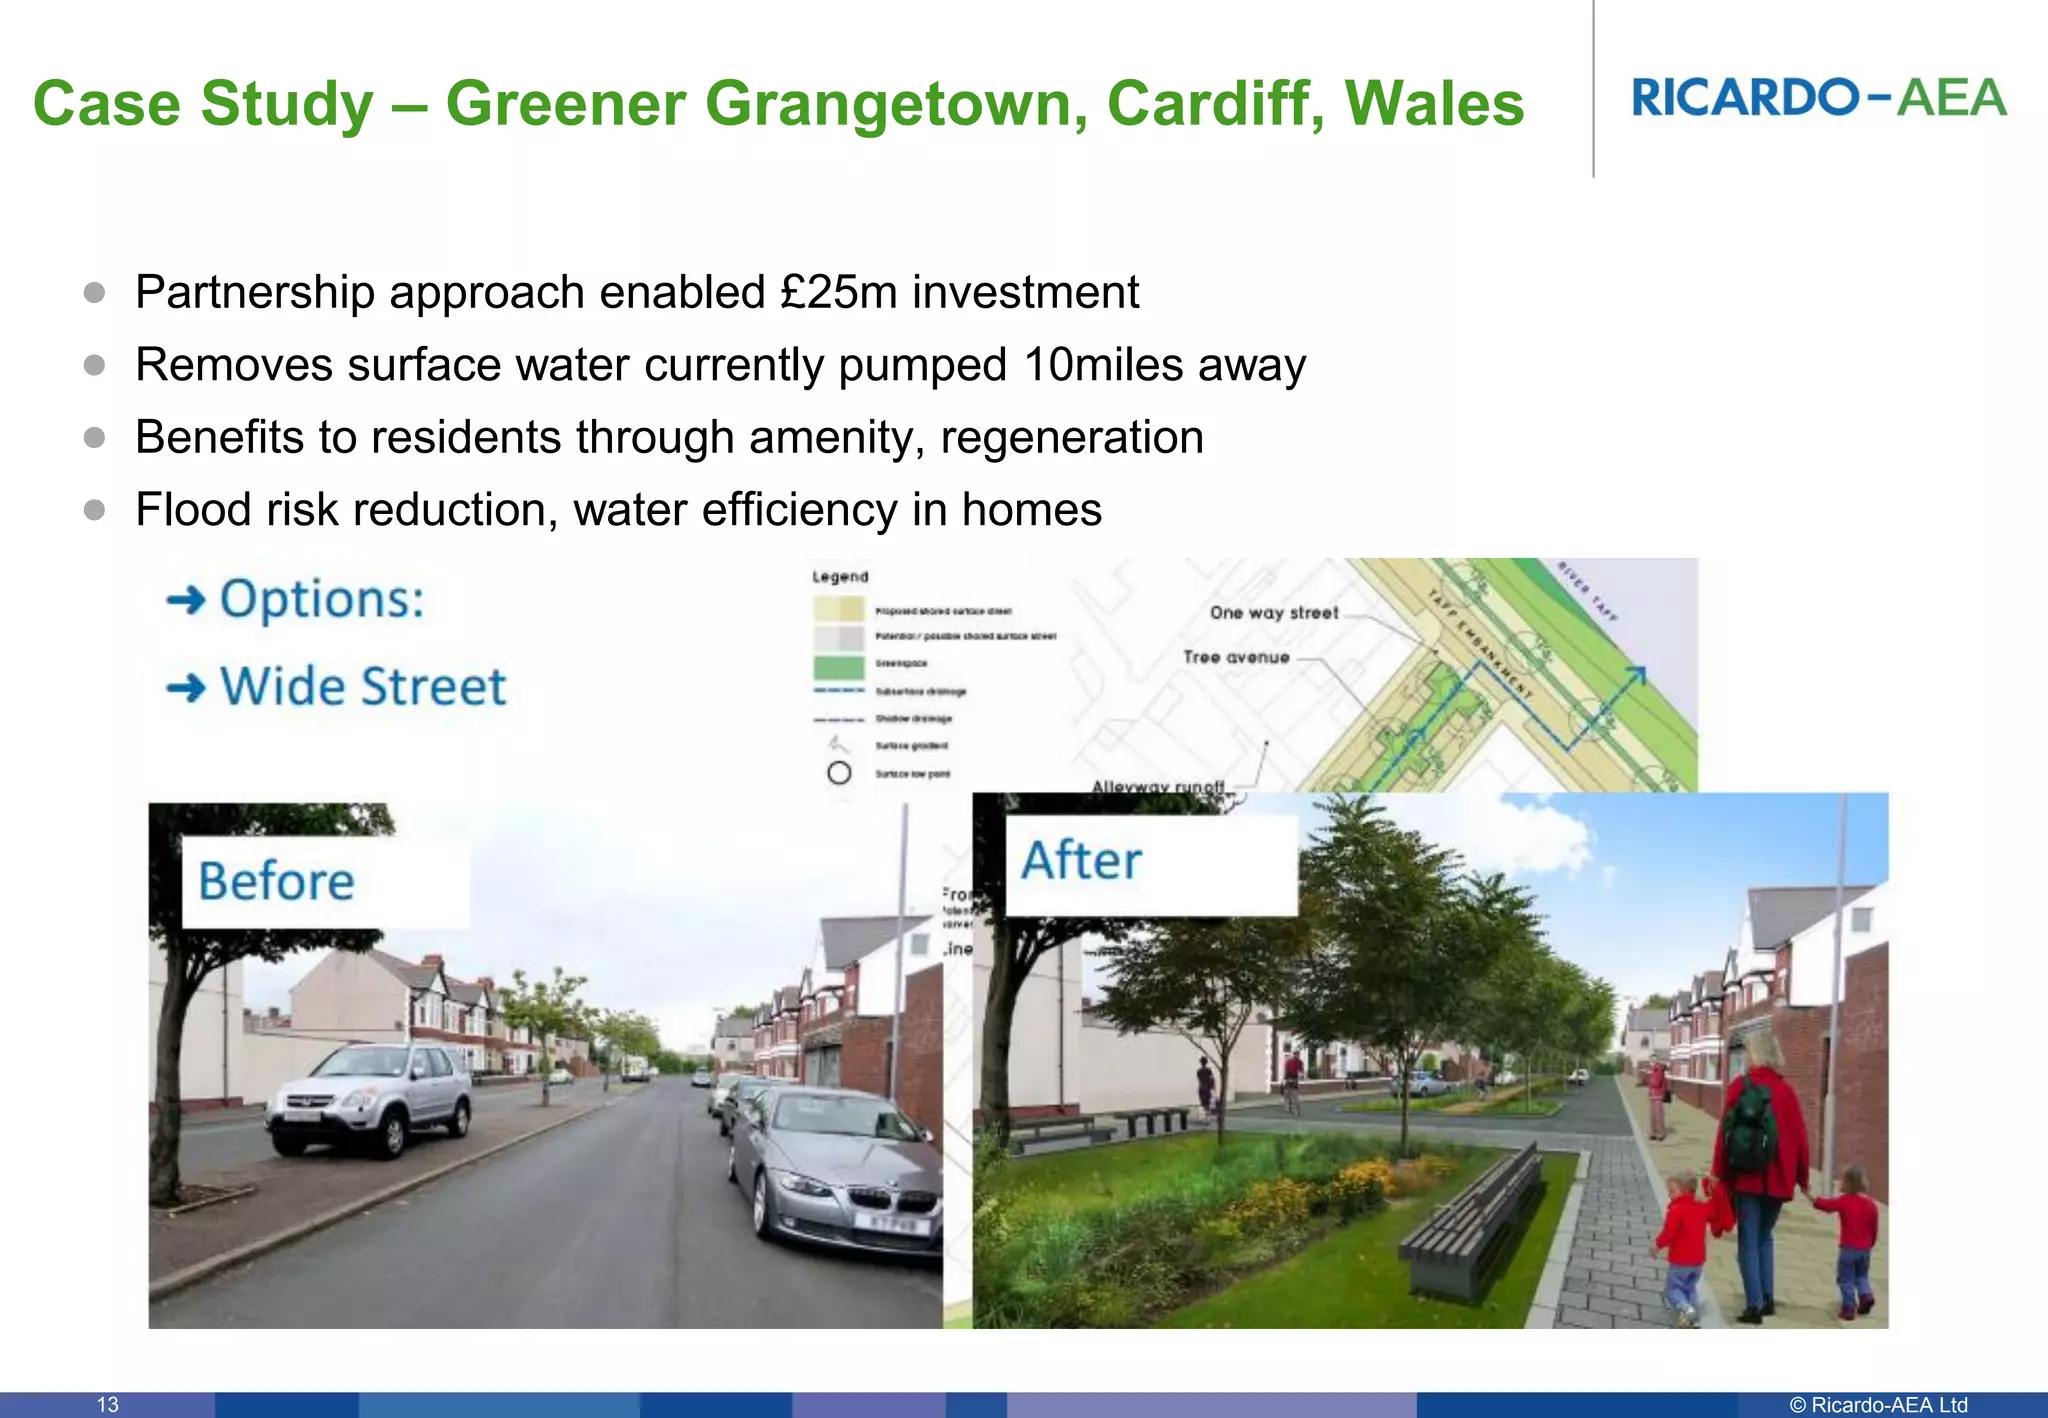
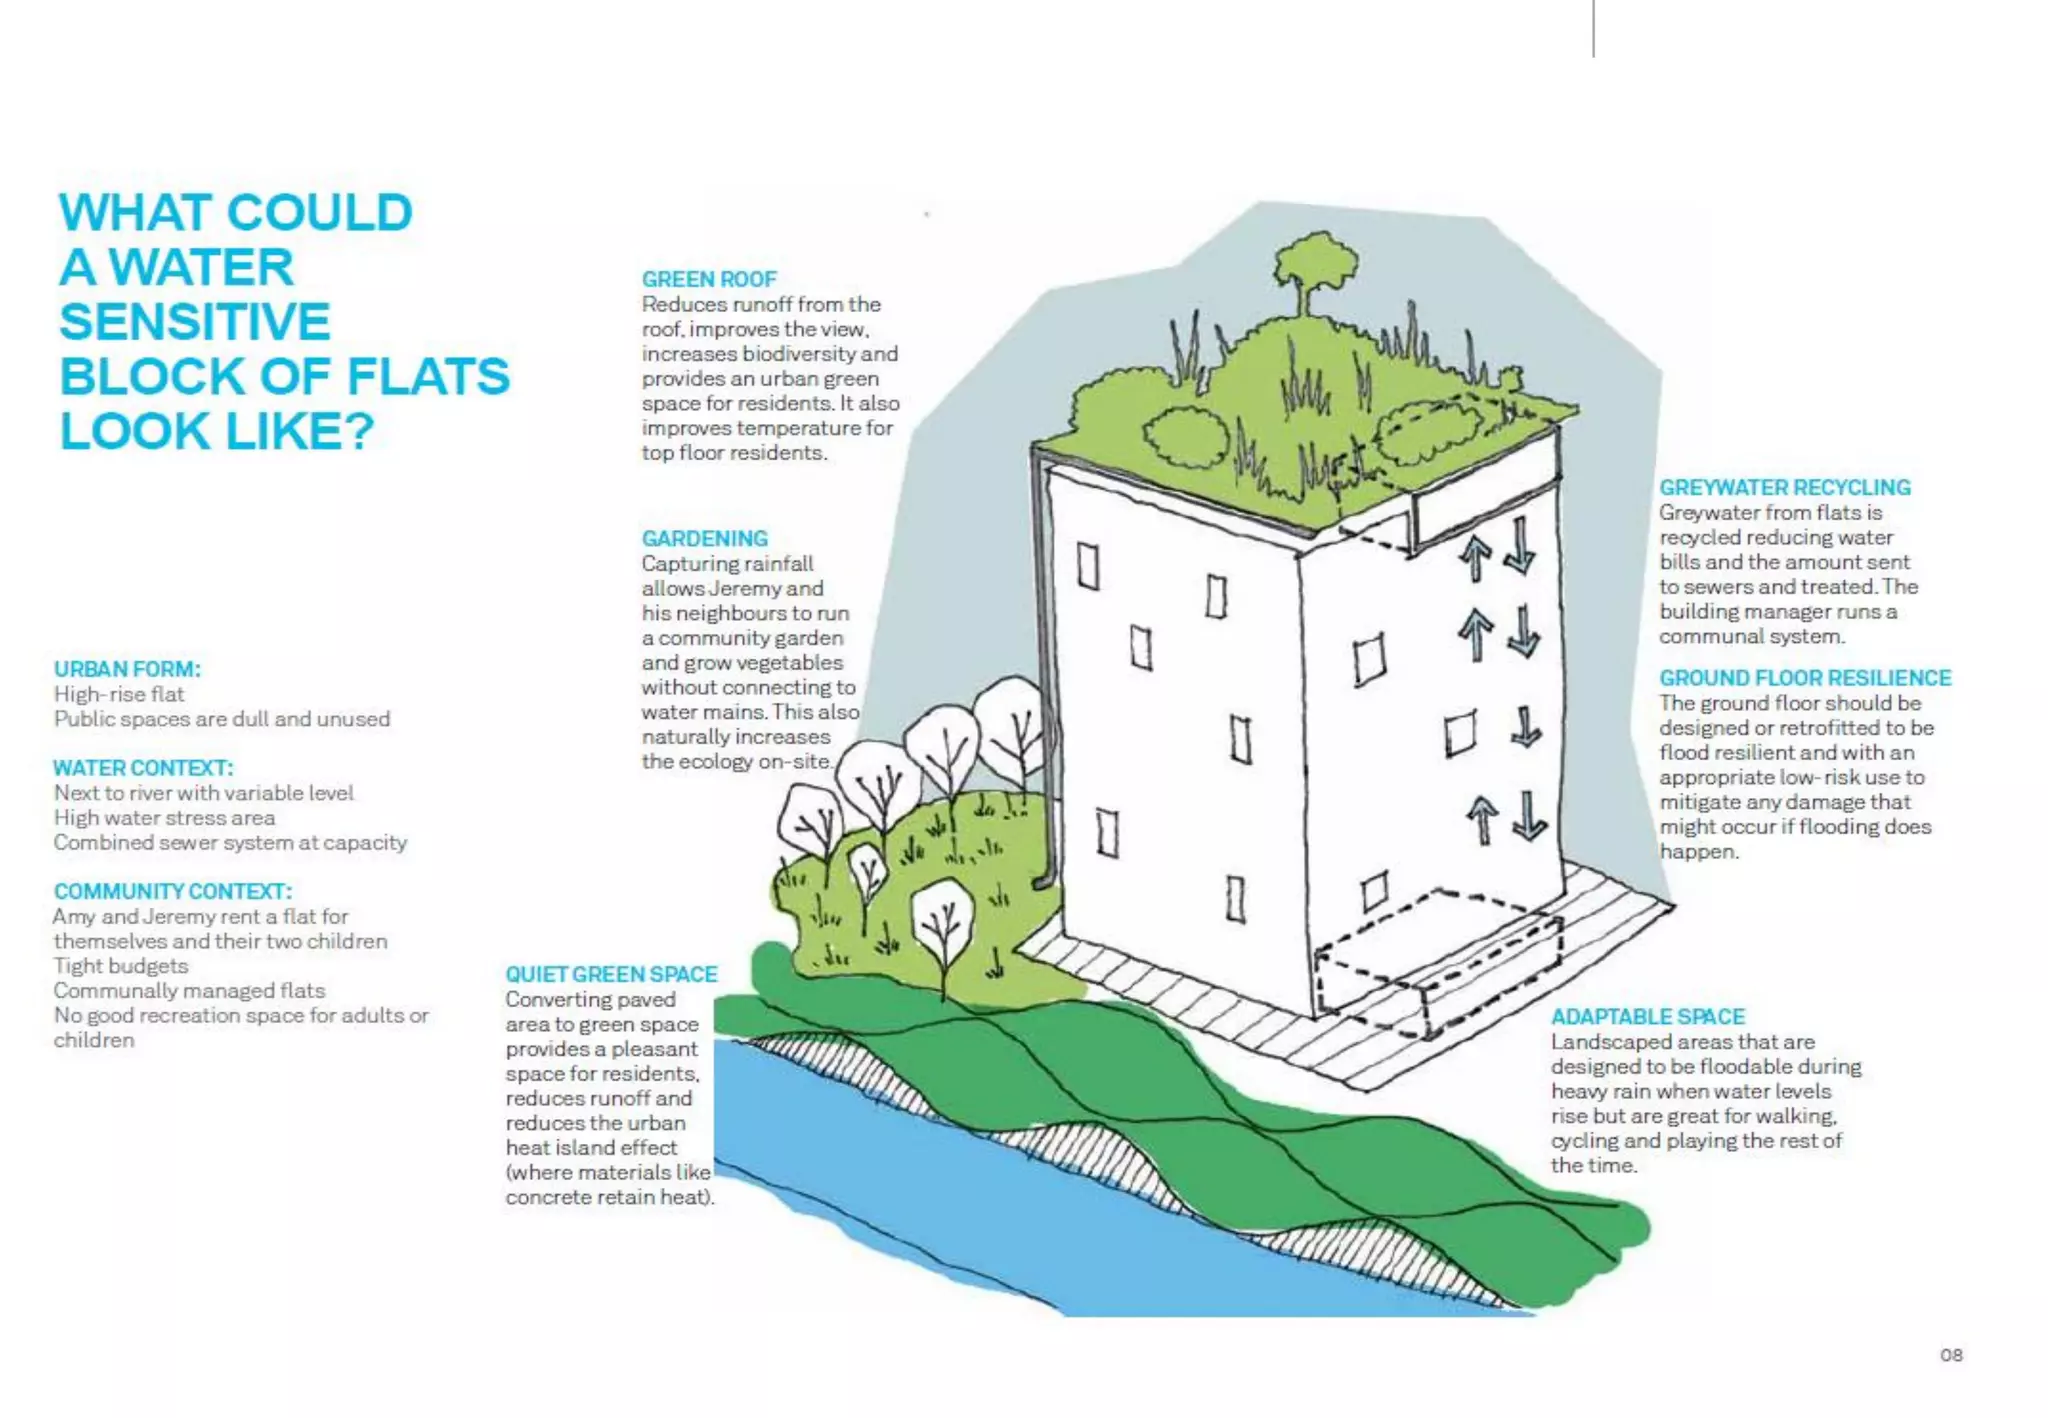
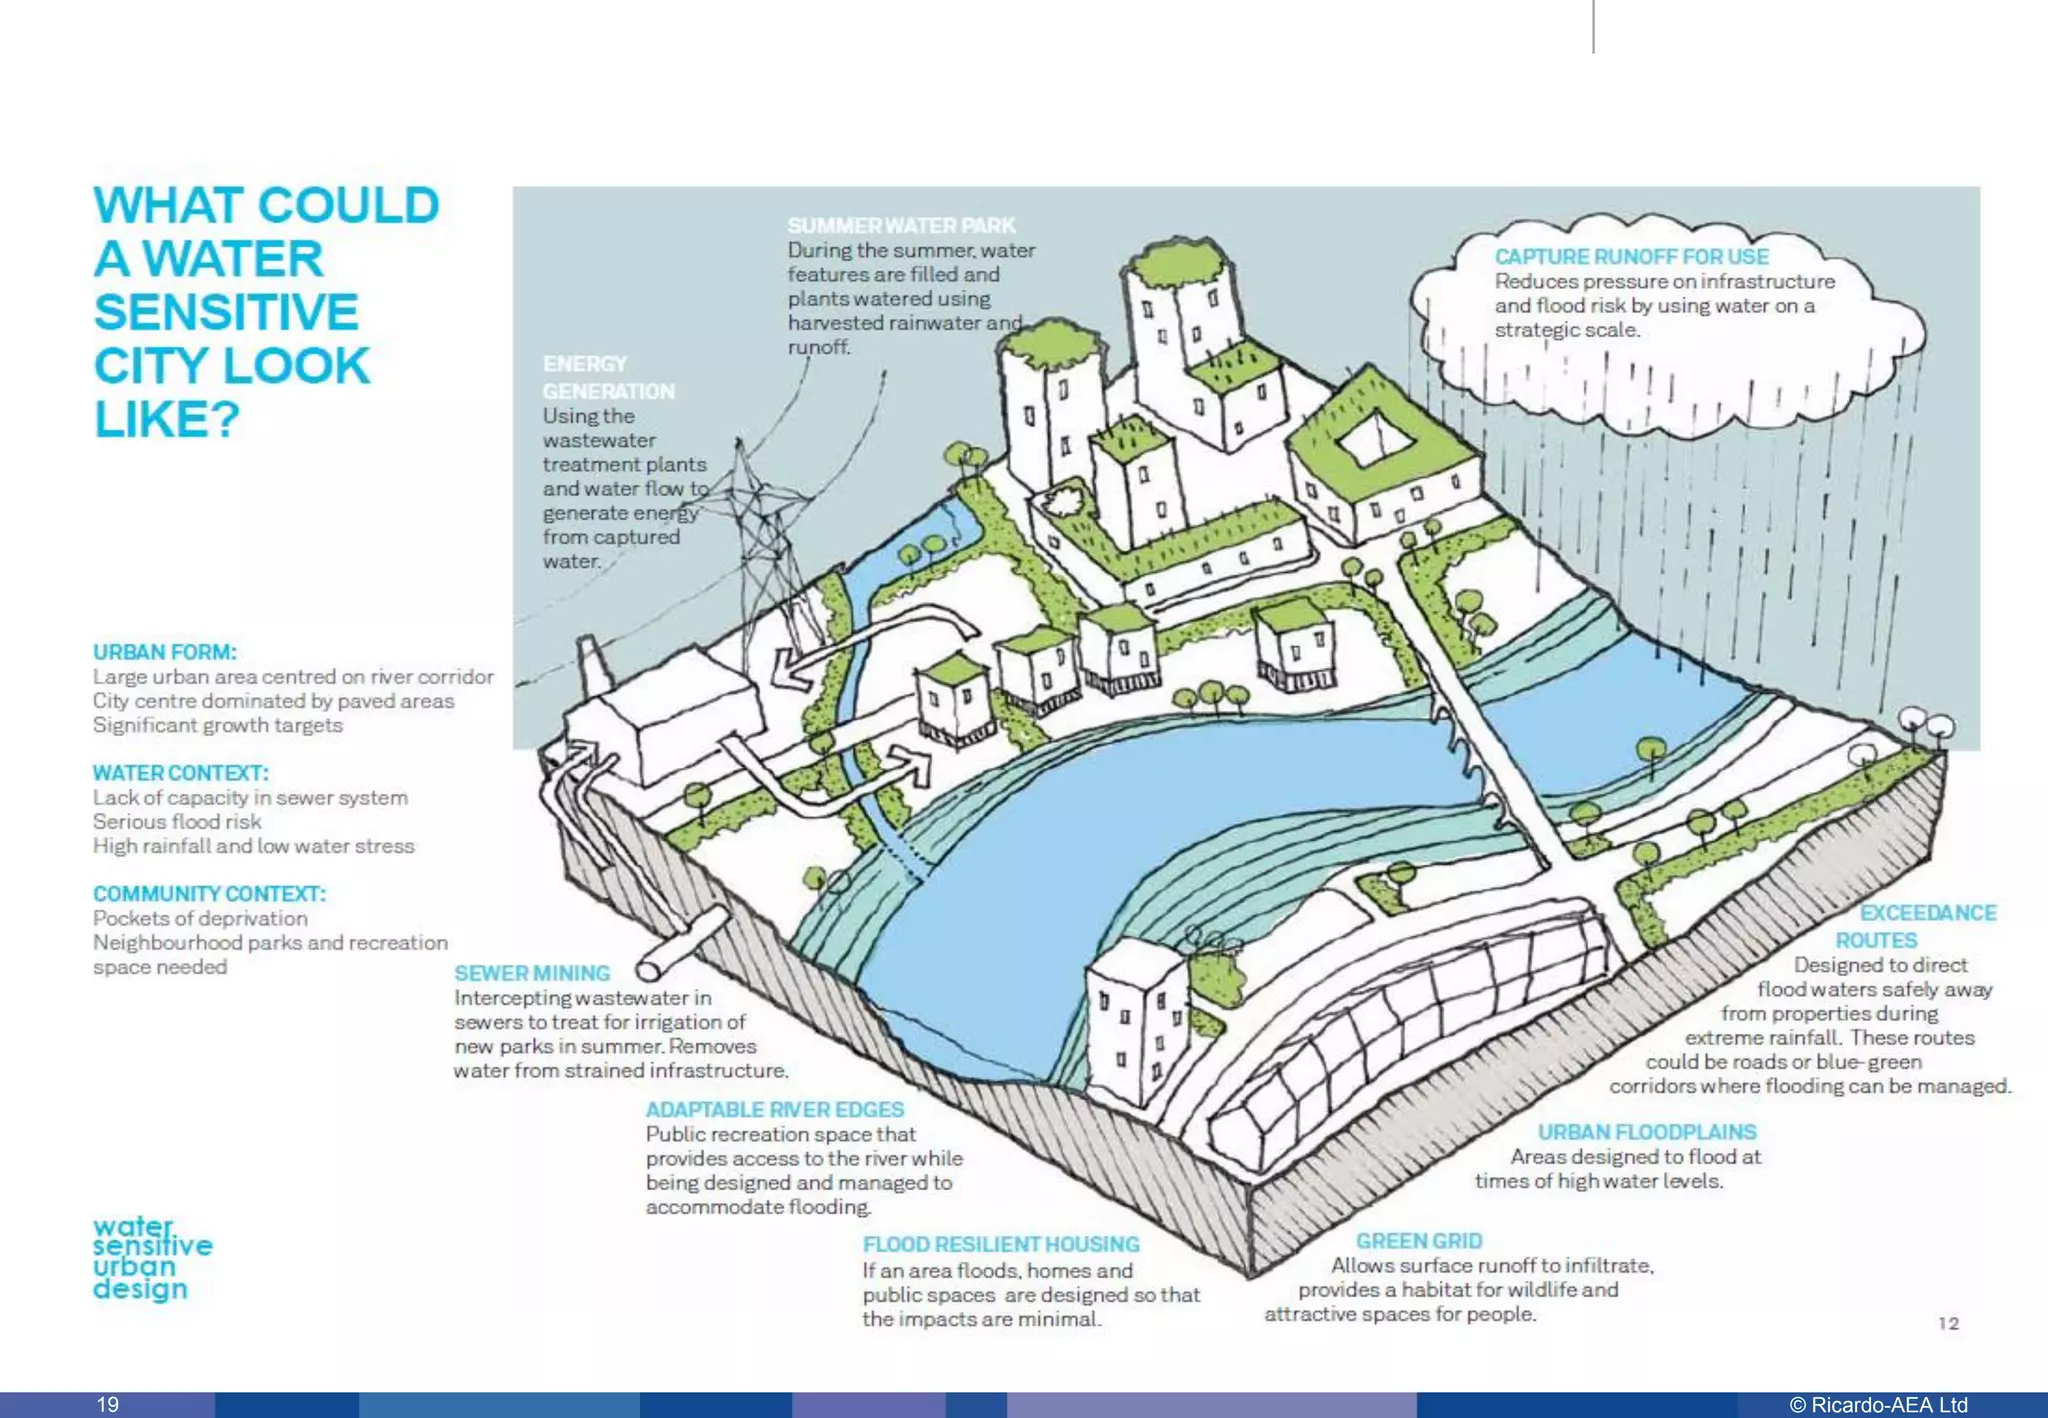
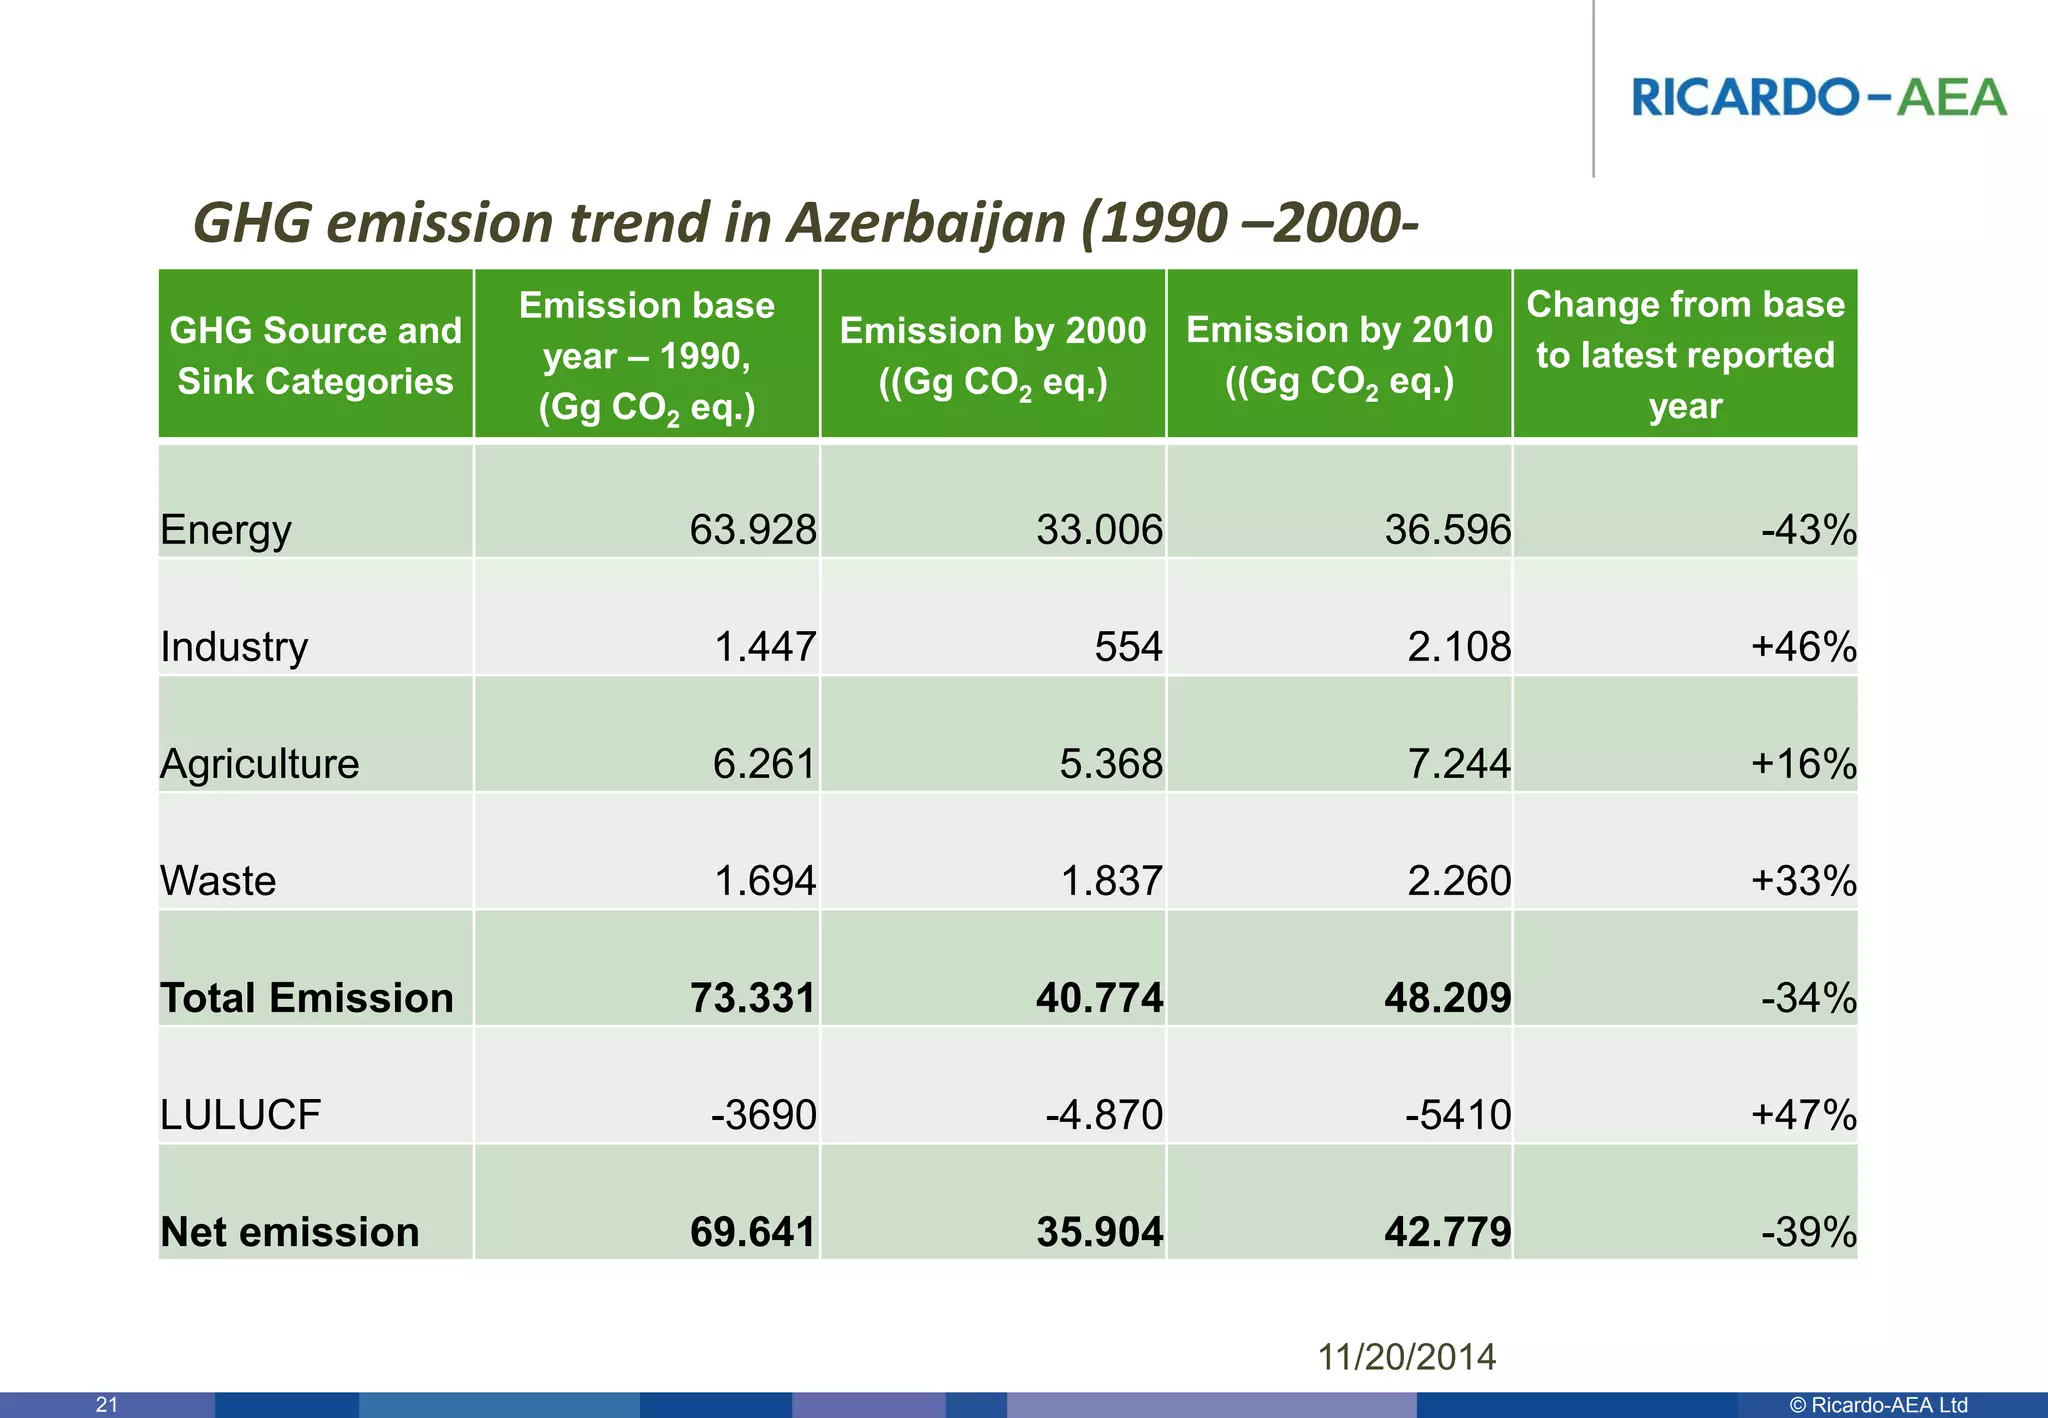
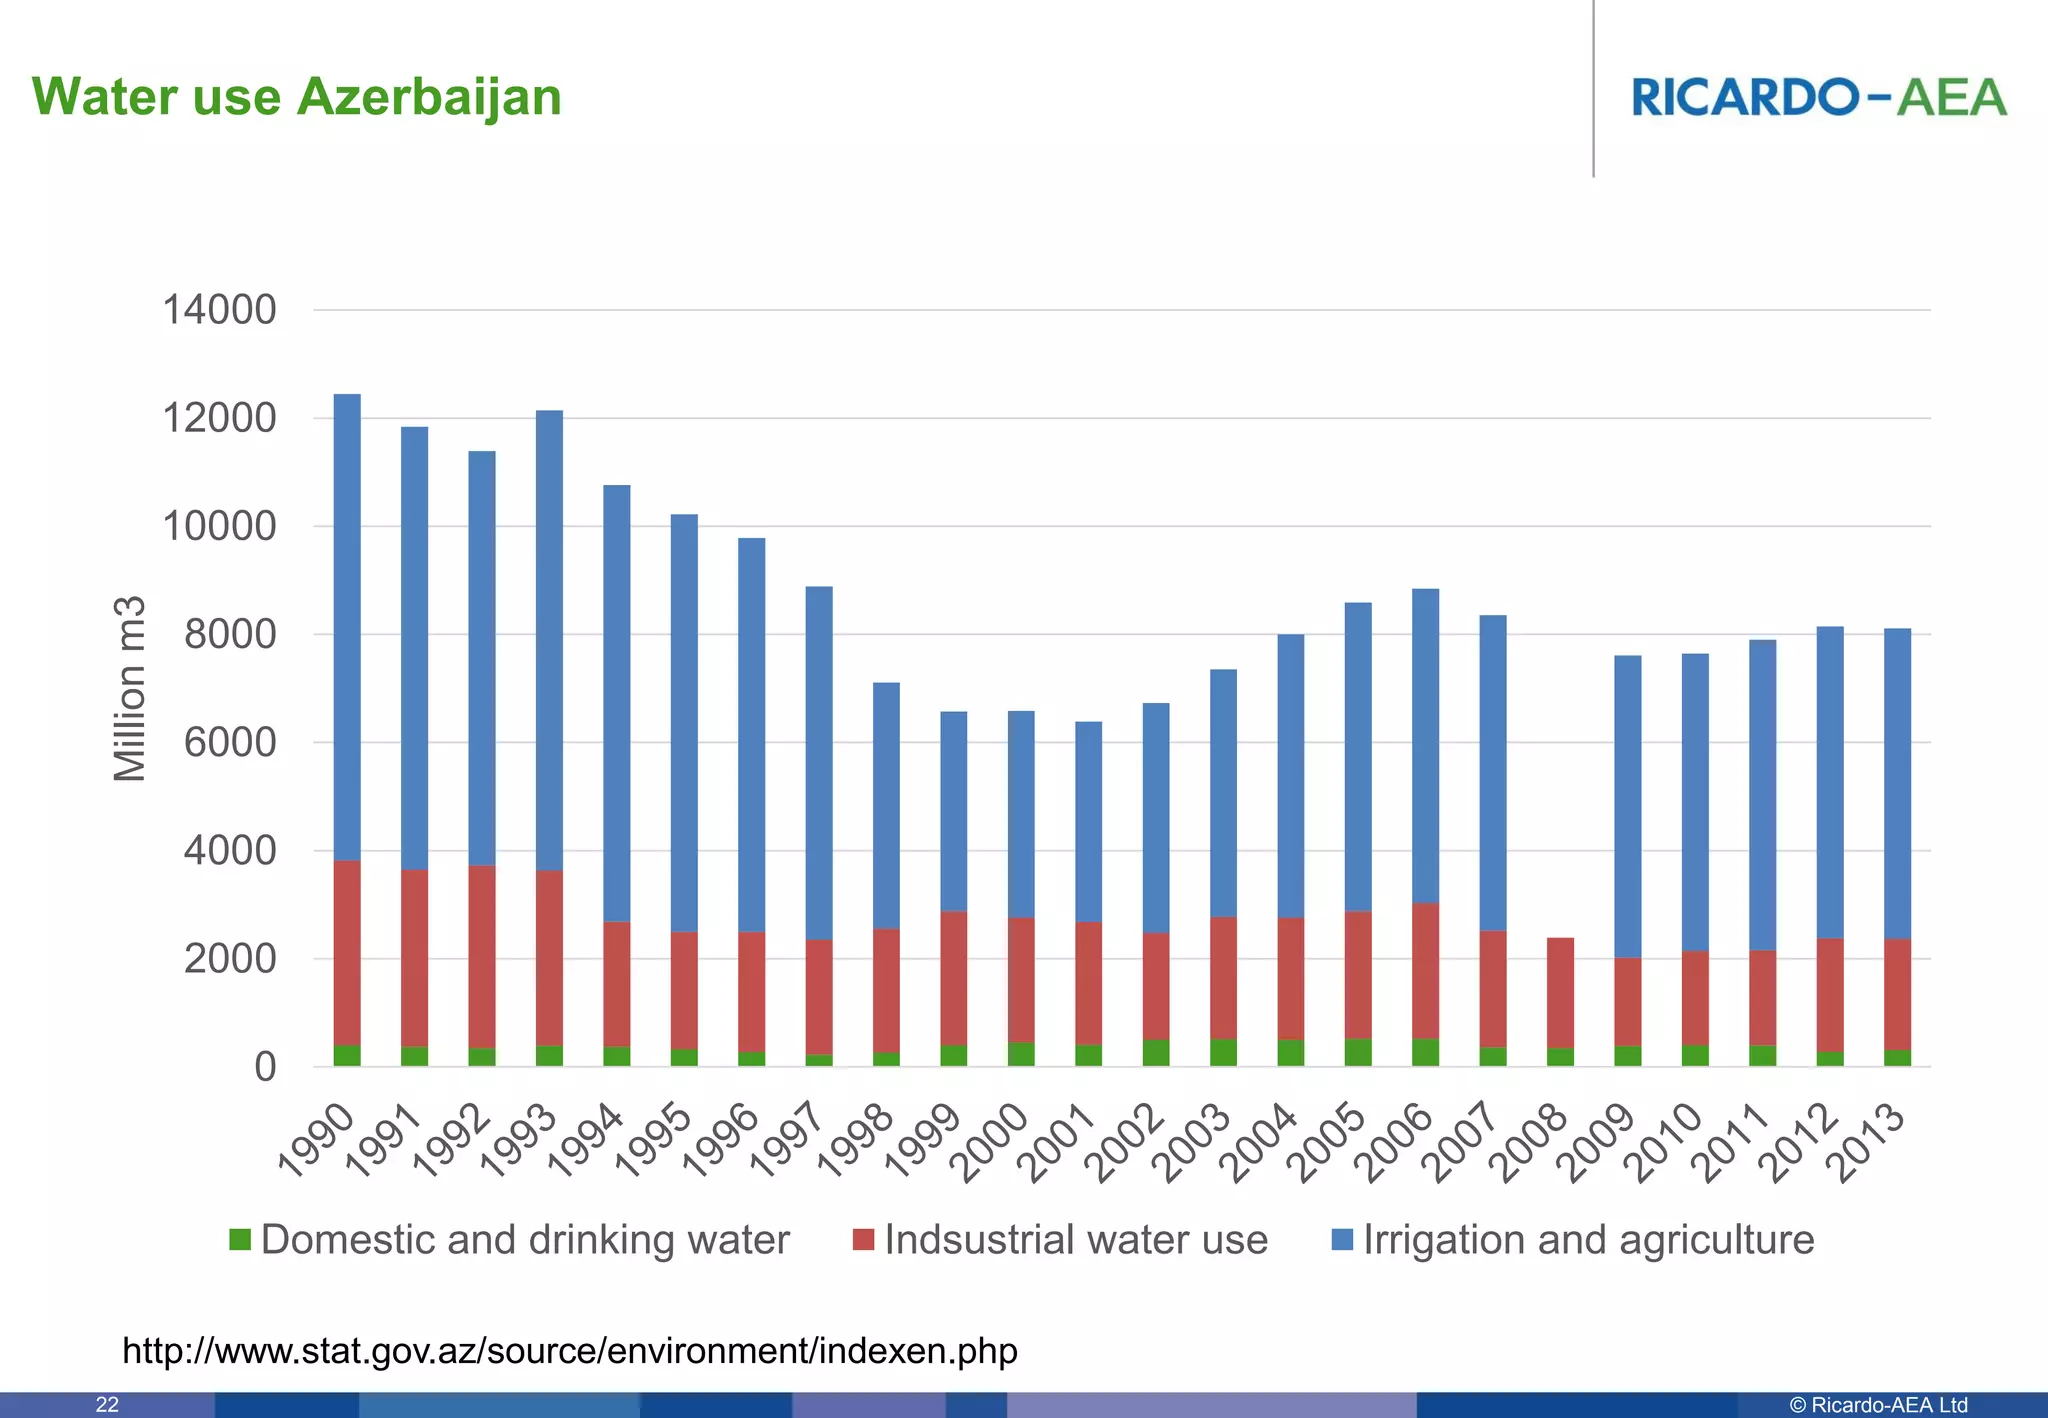
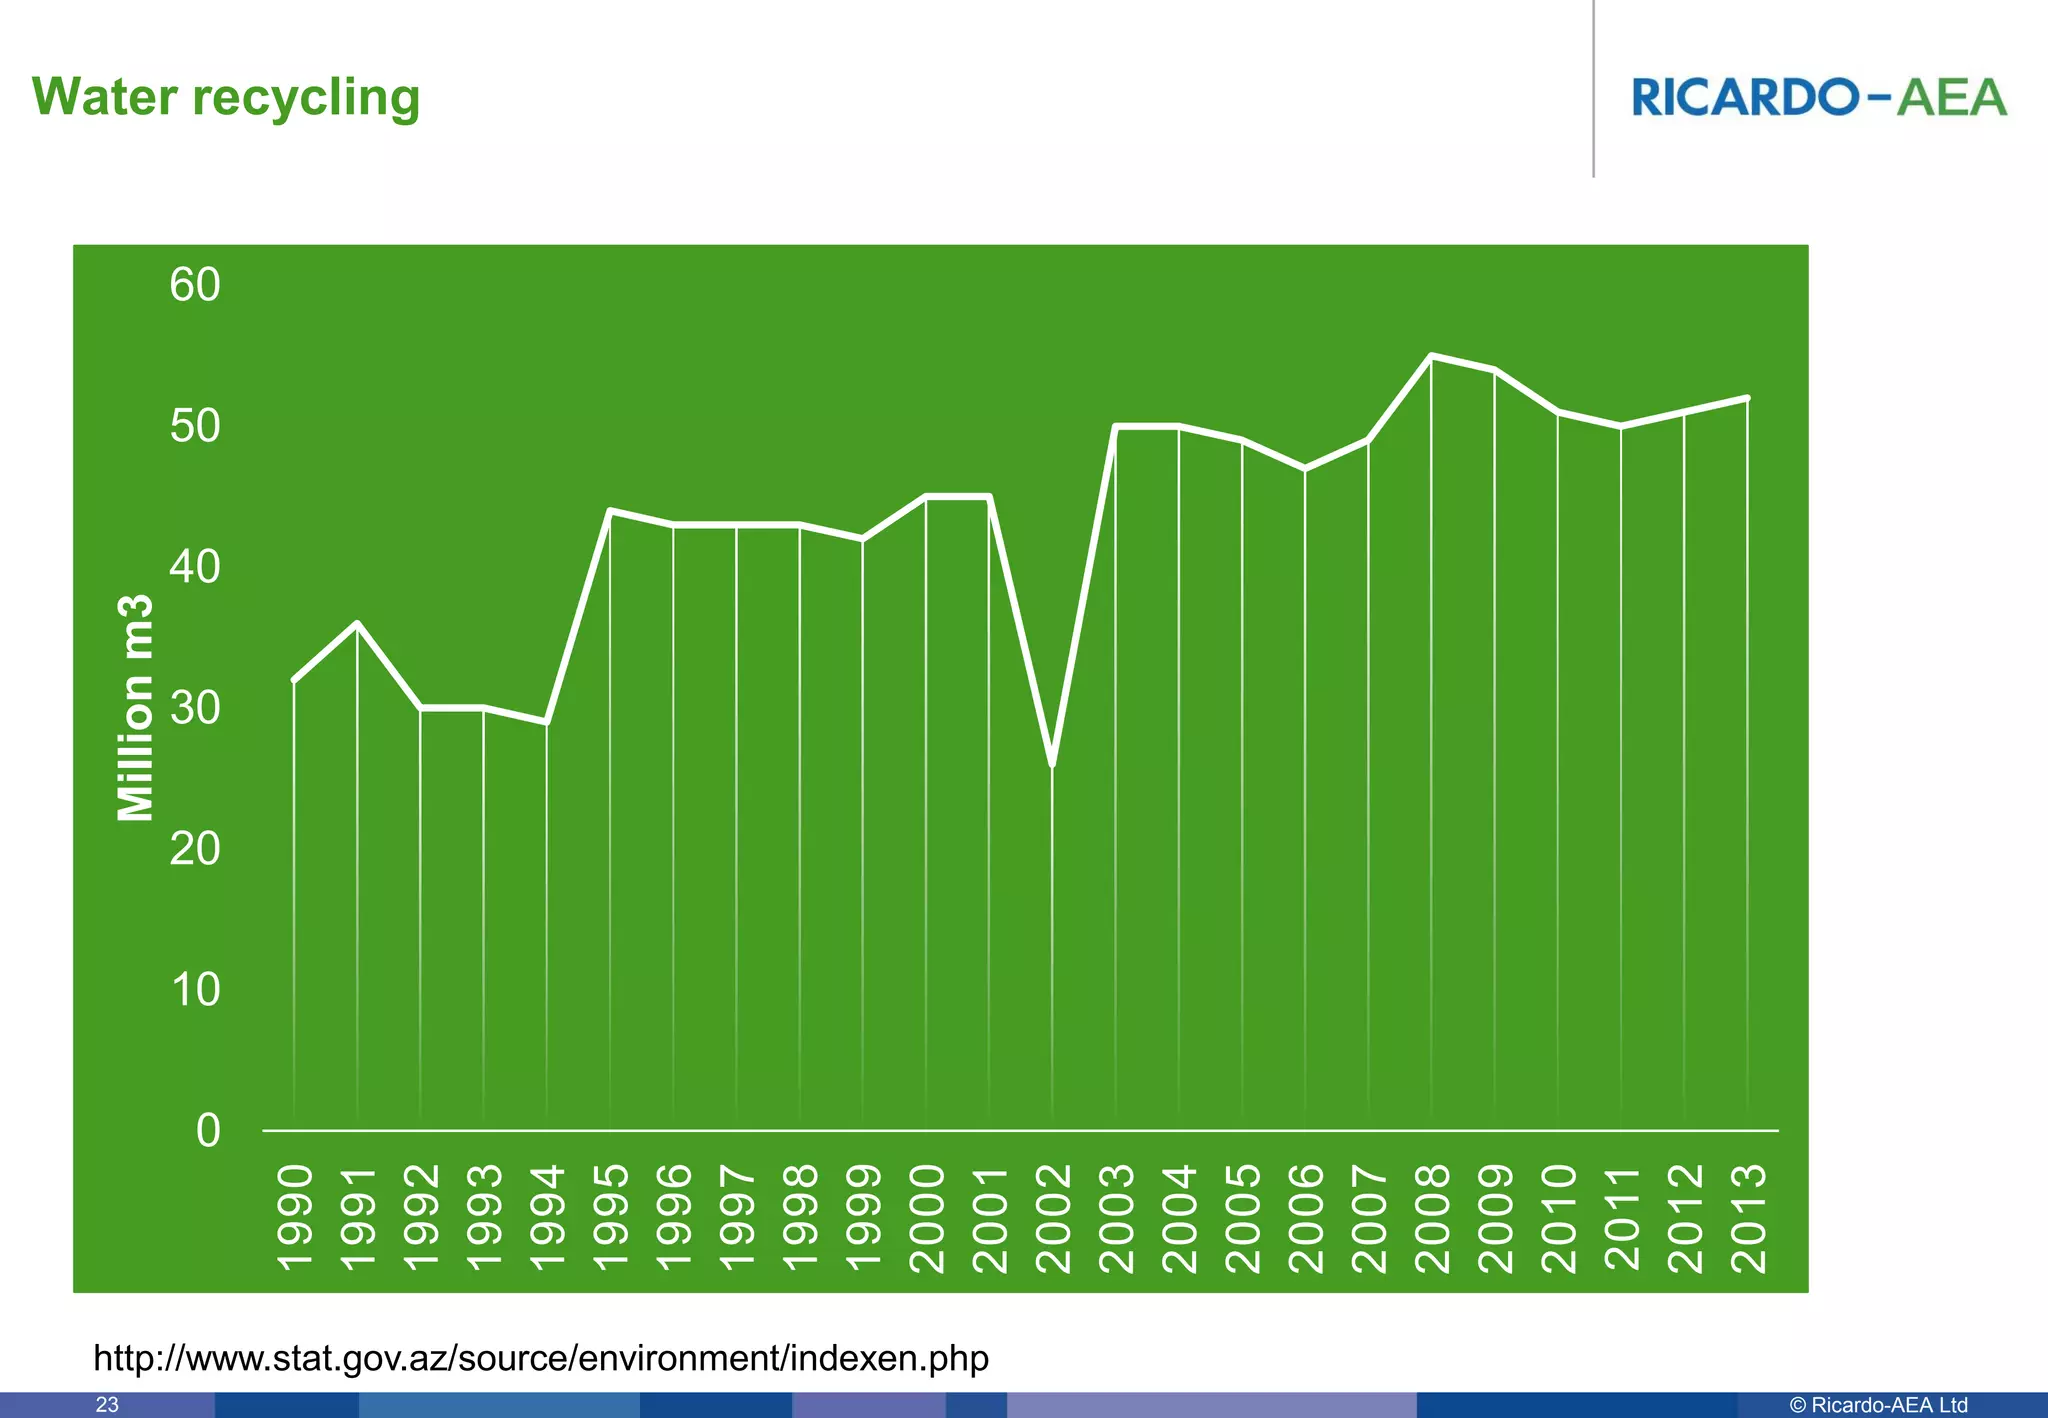
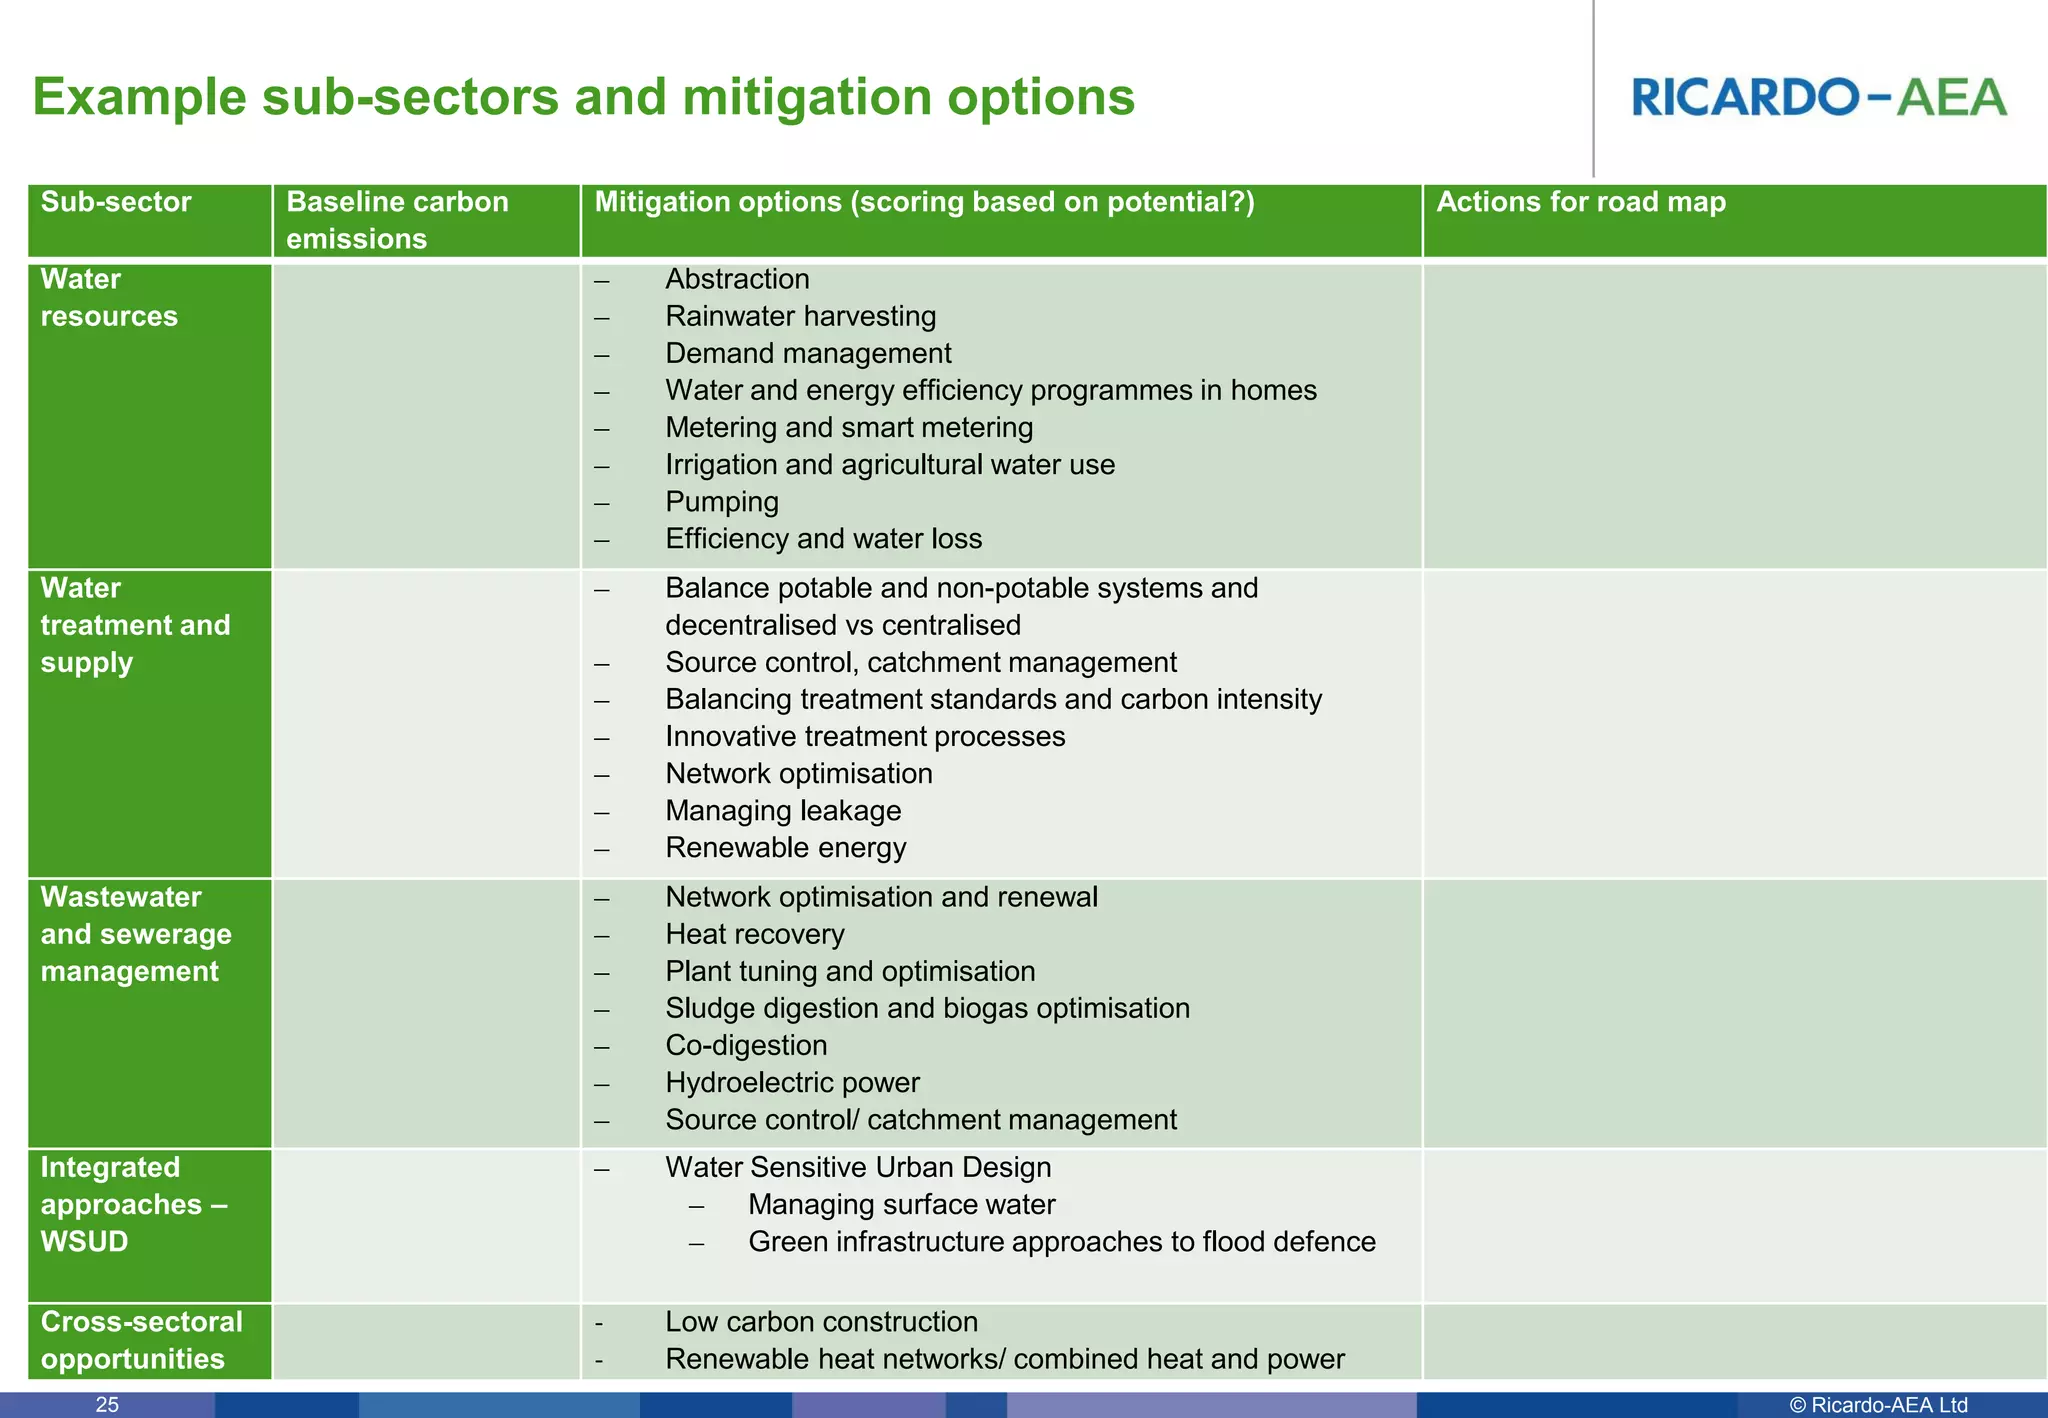

The document discusses climate change mitigation and adaptation actions for the water sector, highlighting carbon emissions and energy use. It presents case studies and examples from Azerbaijan and other regions, detailing various strategies for carbon reduction and efficient water management. Key mitigation options include rainwater harvesting, energy efficiency programs, and innovative treatment processes within the water sector.


![World Engineers Summit Conf, Singapore July 2015 [Compatibility Mode]](https://cdn.slidesharecdn.com/ss_thumbnails/835472e3-5c33-47b8-a6fc-8a83d67e9eae-151015093255-lva1-app6892-thumbnail.jpg?width=640&height=640&fit=bounds)


