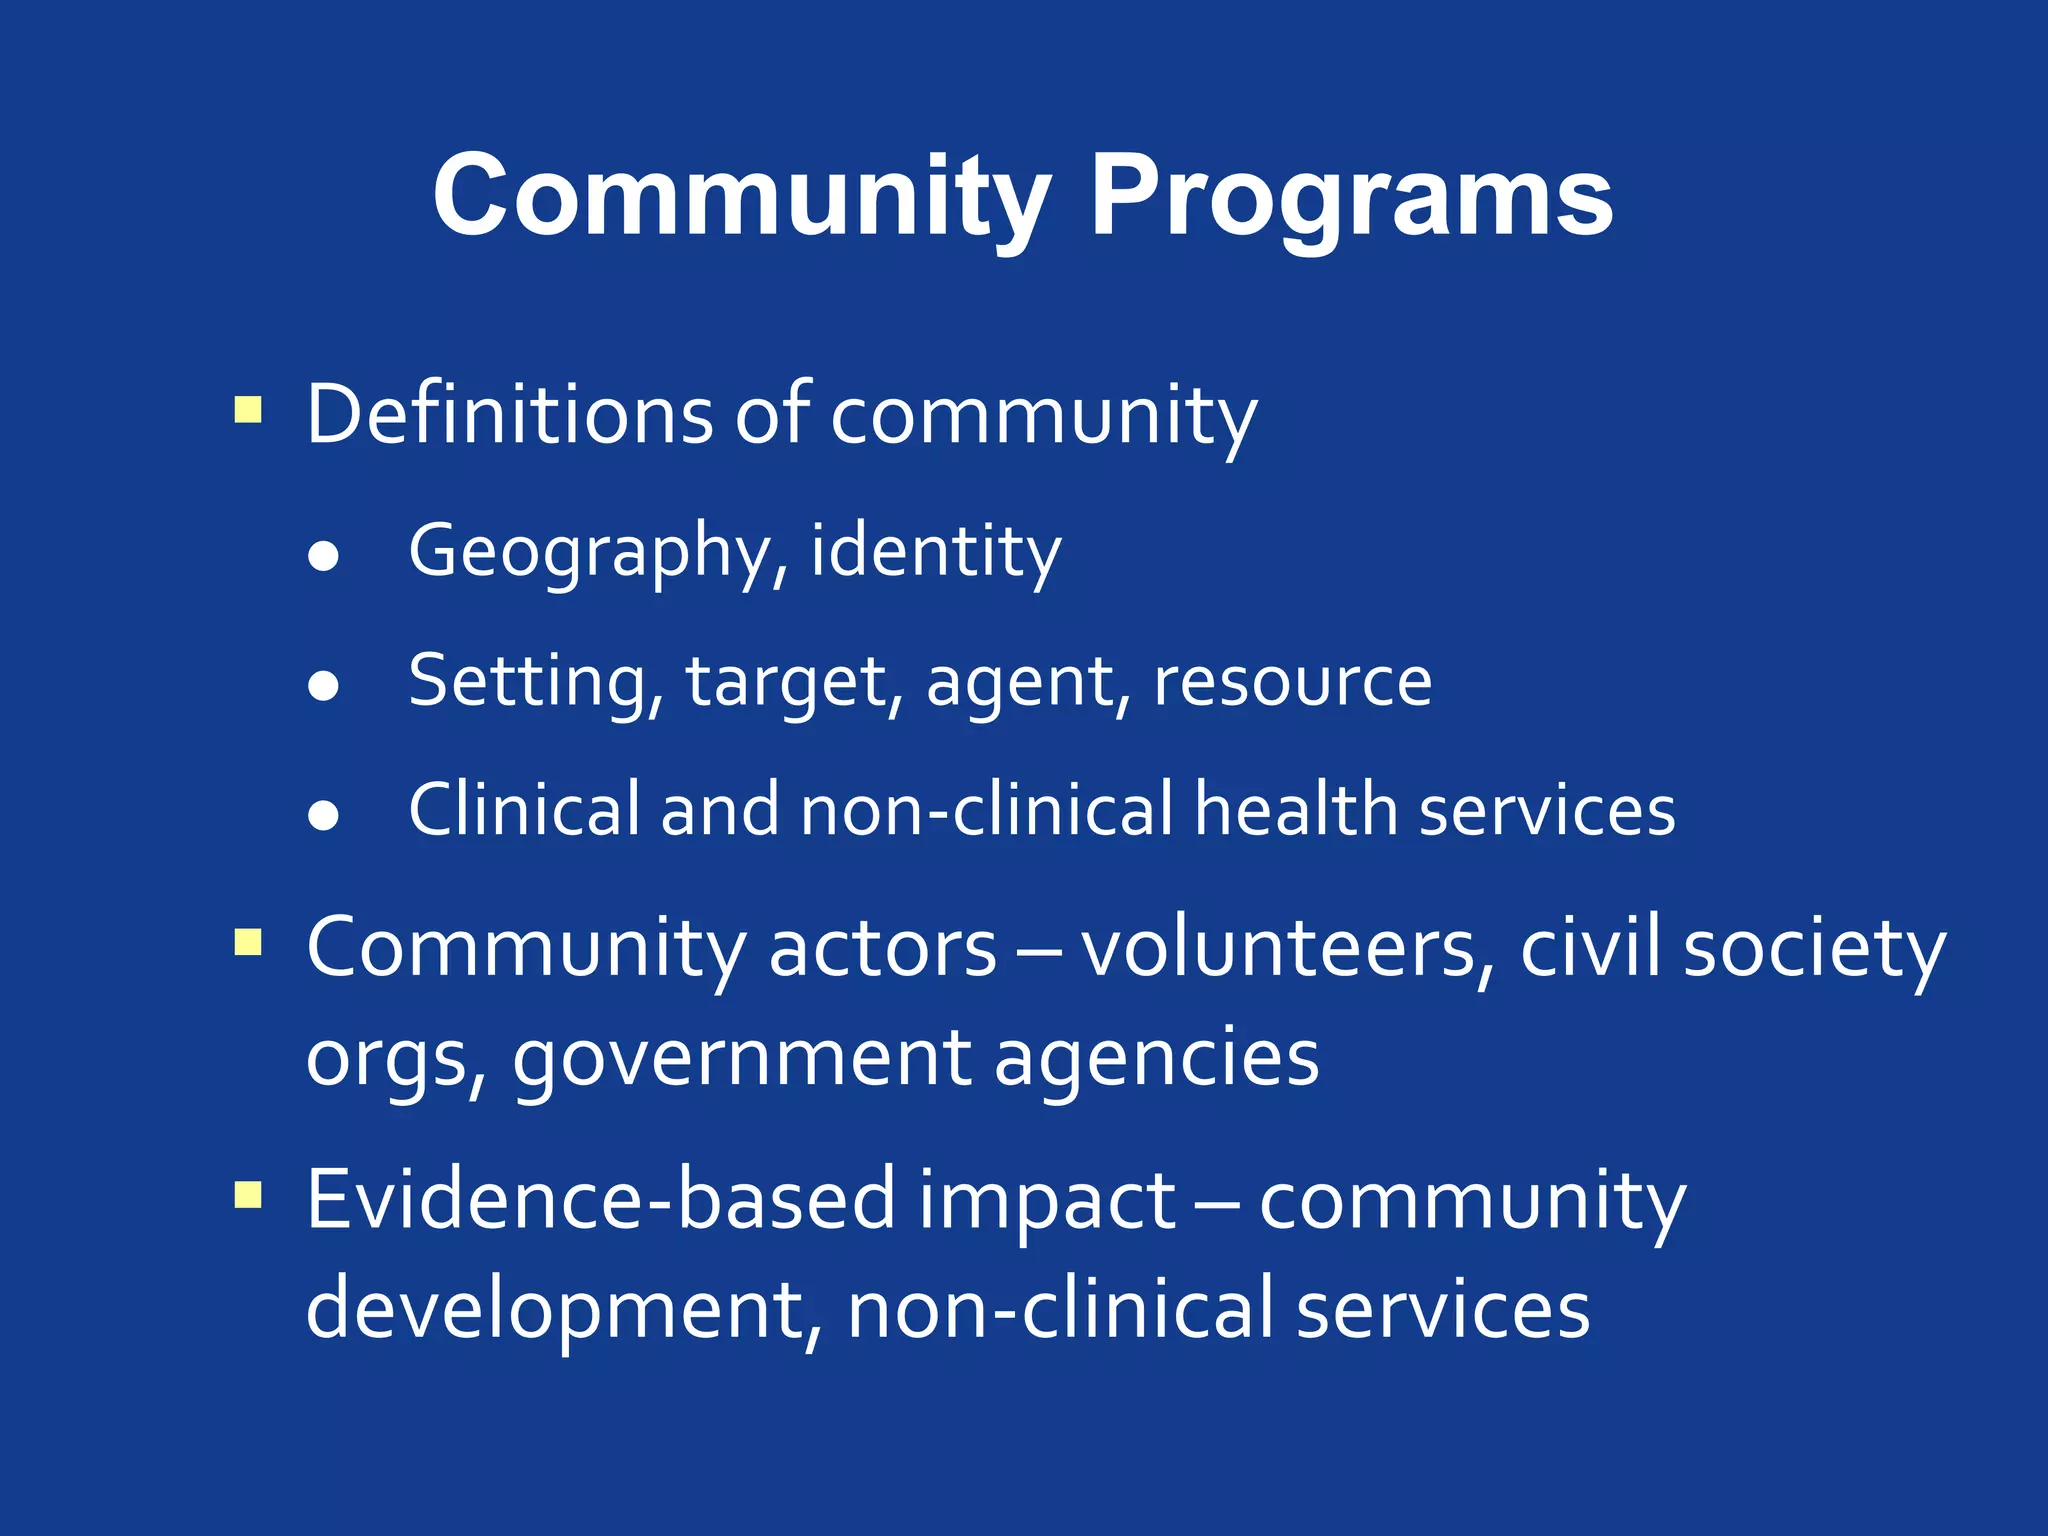
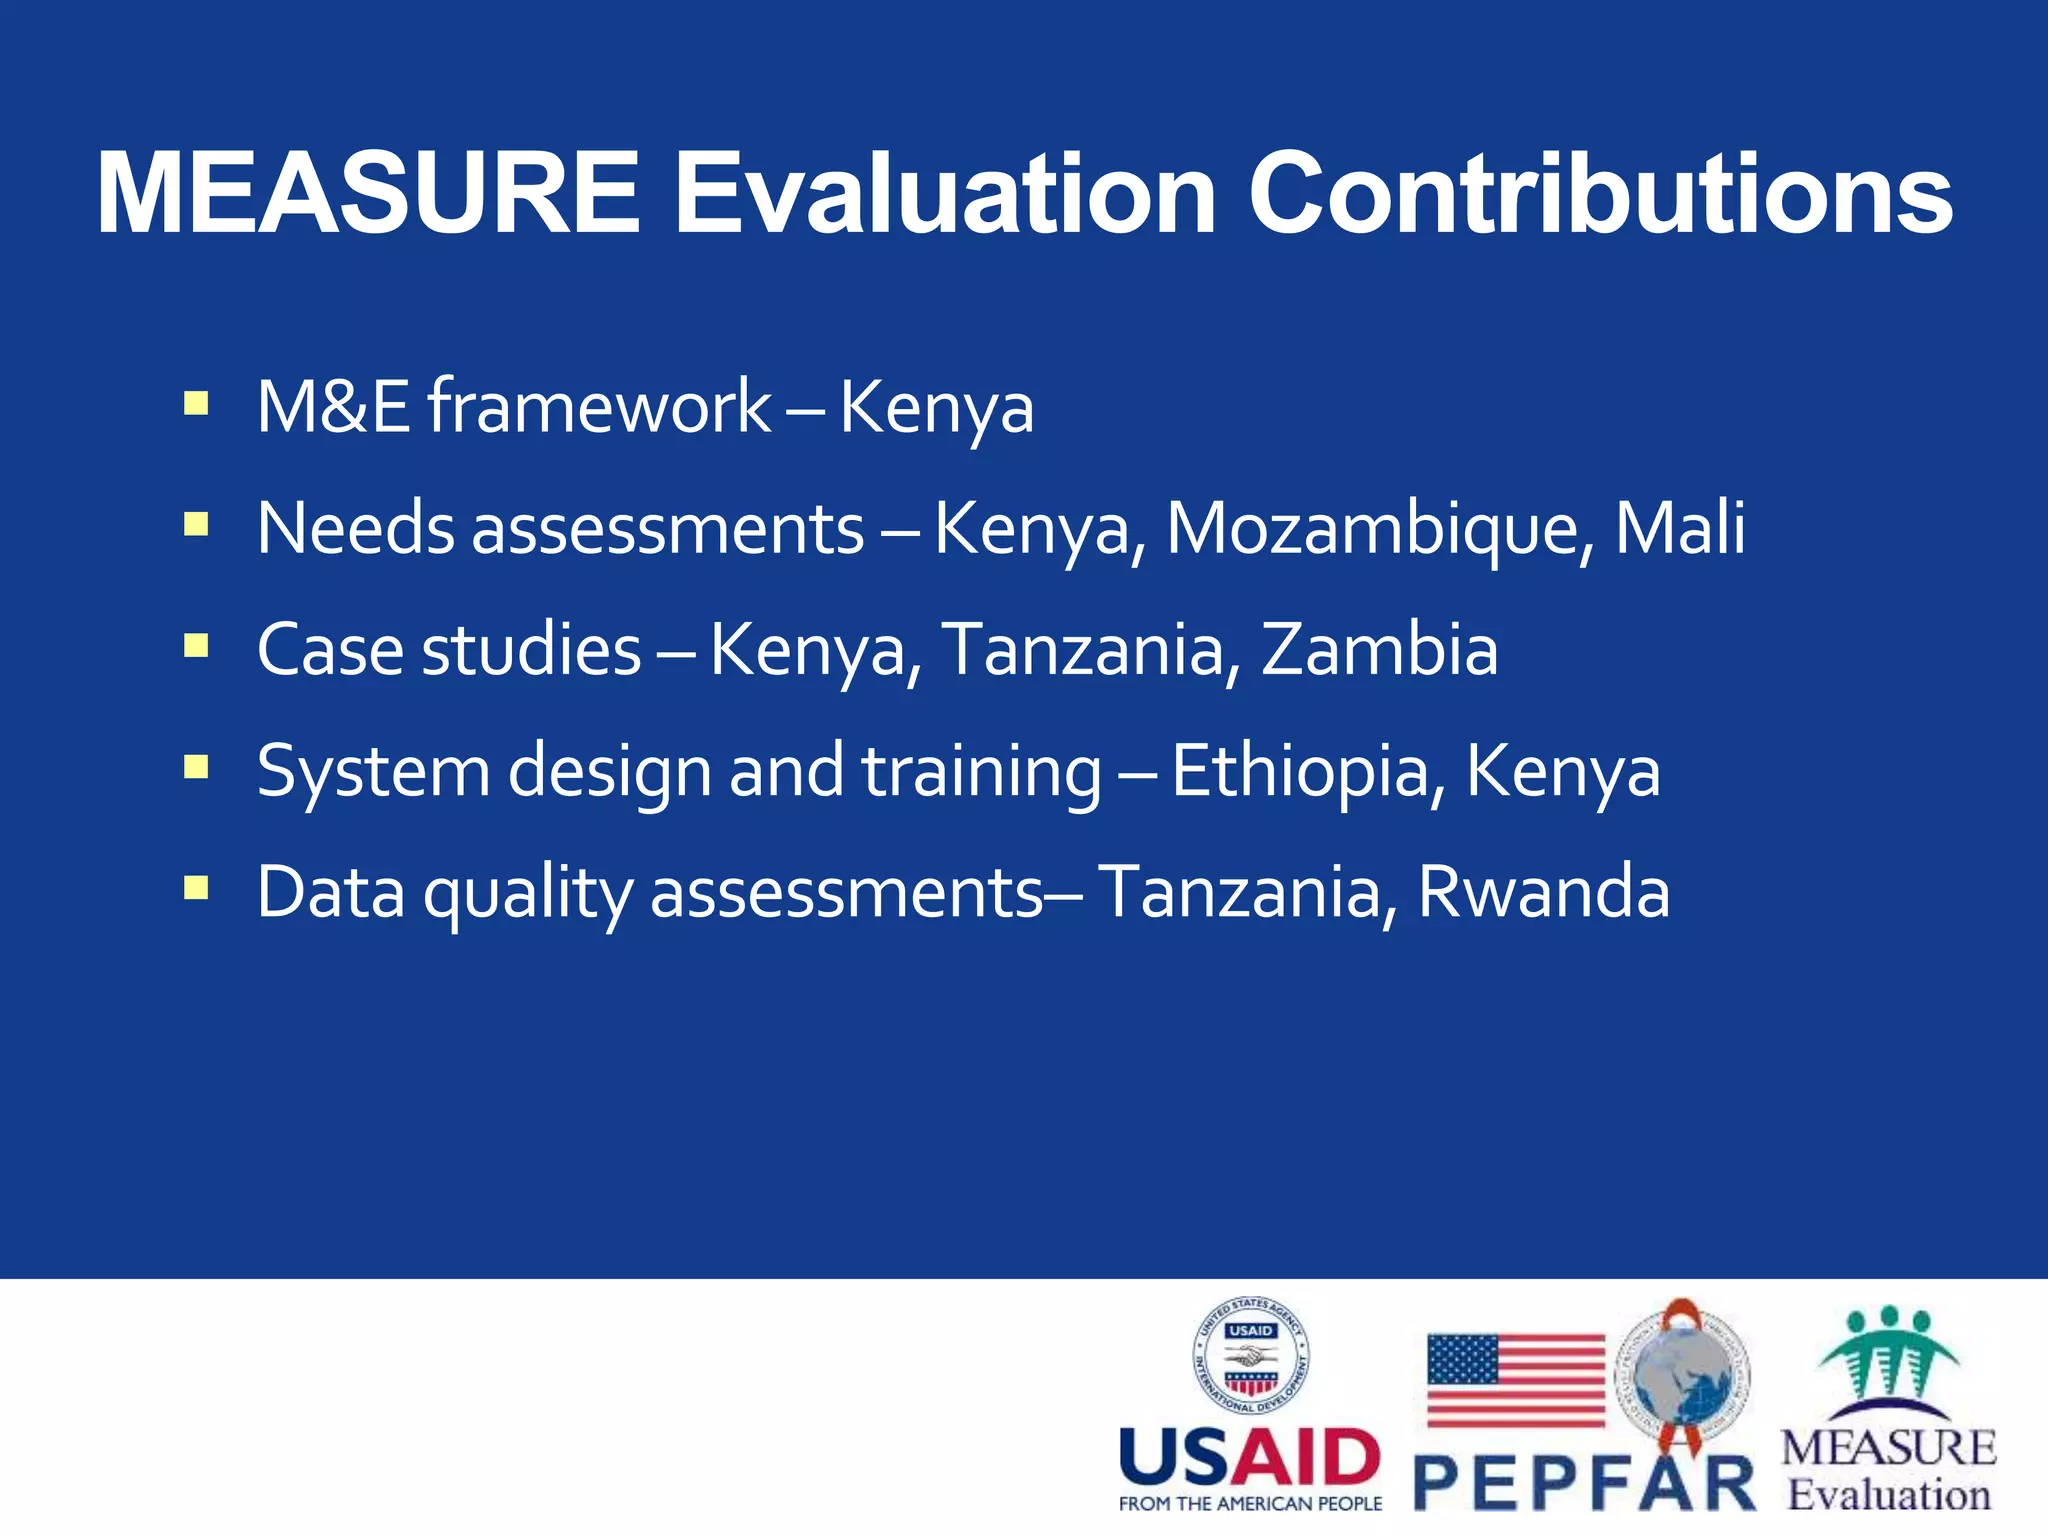
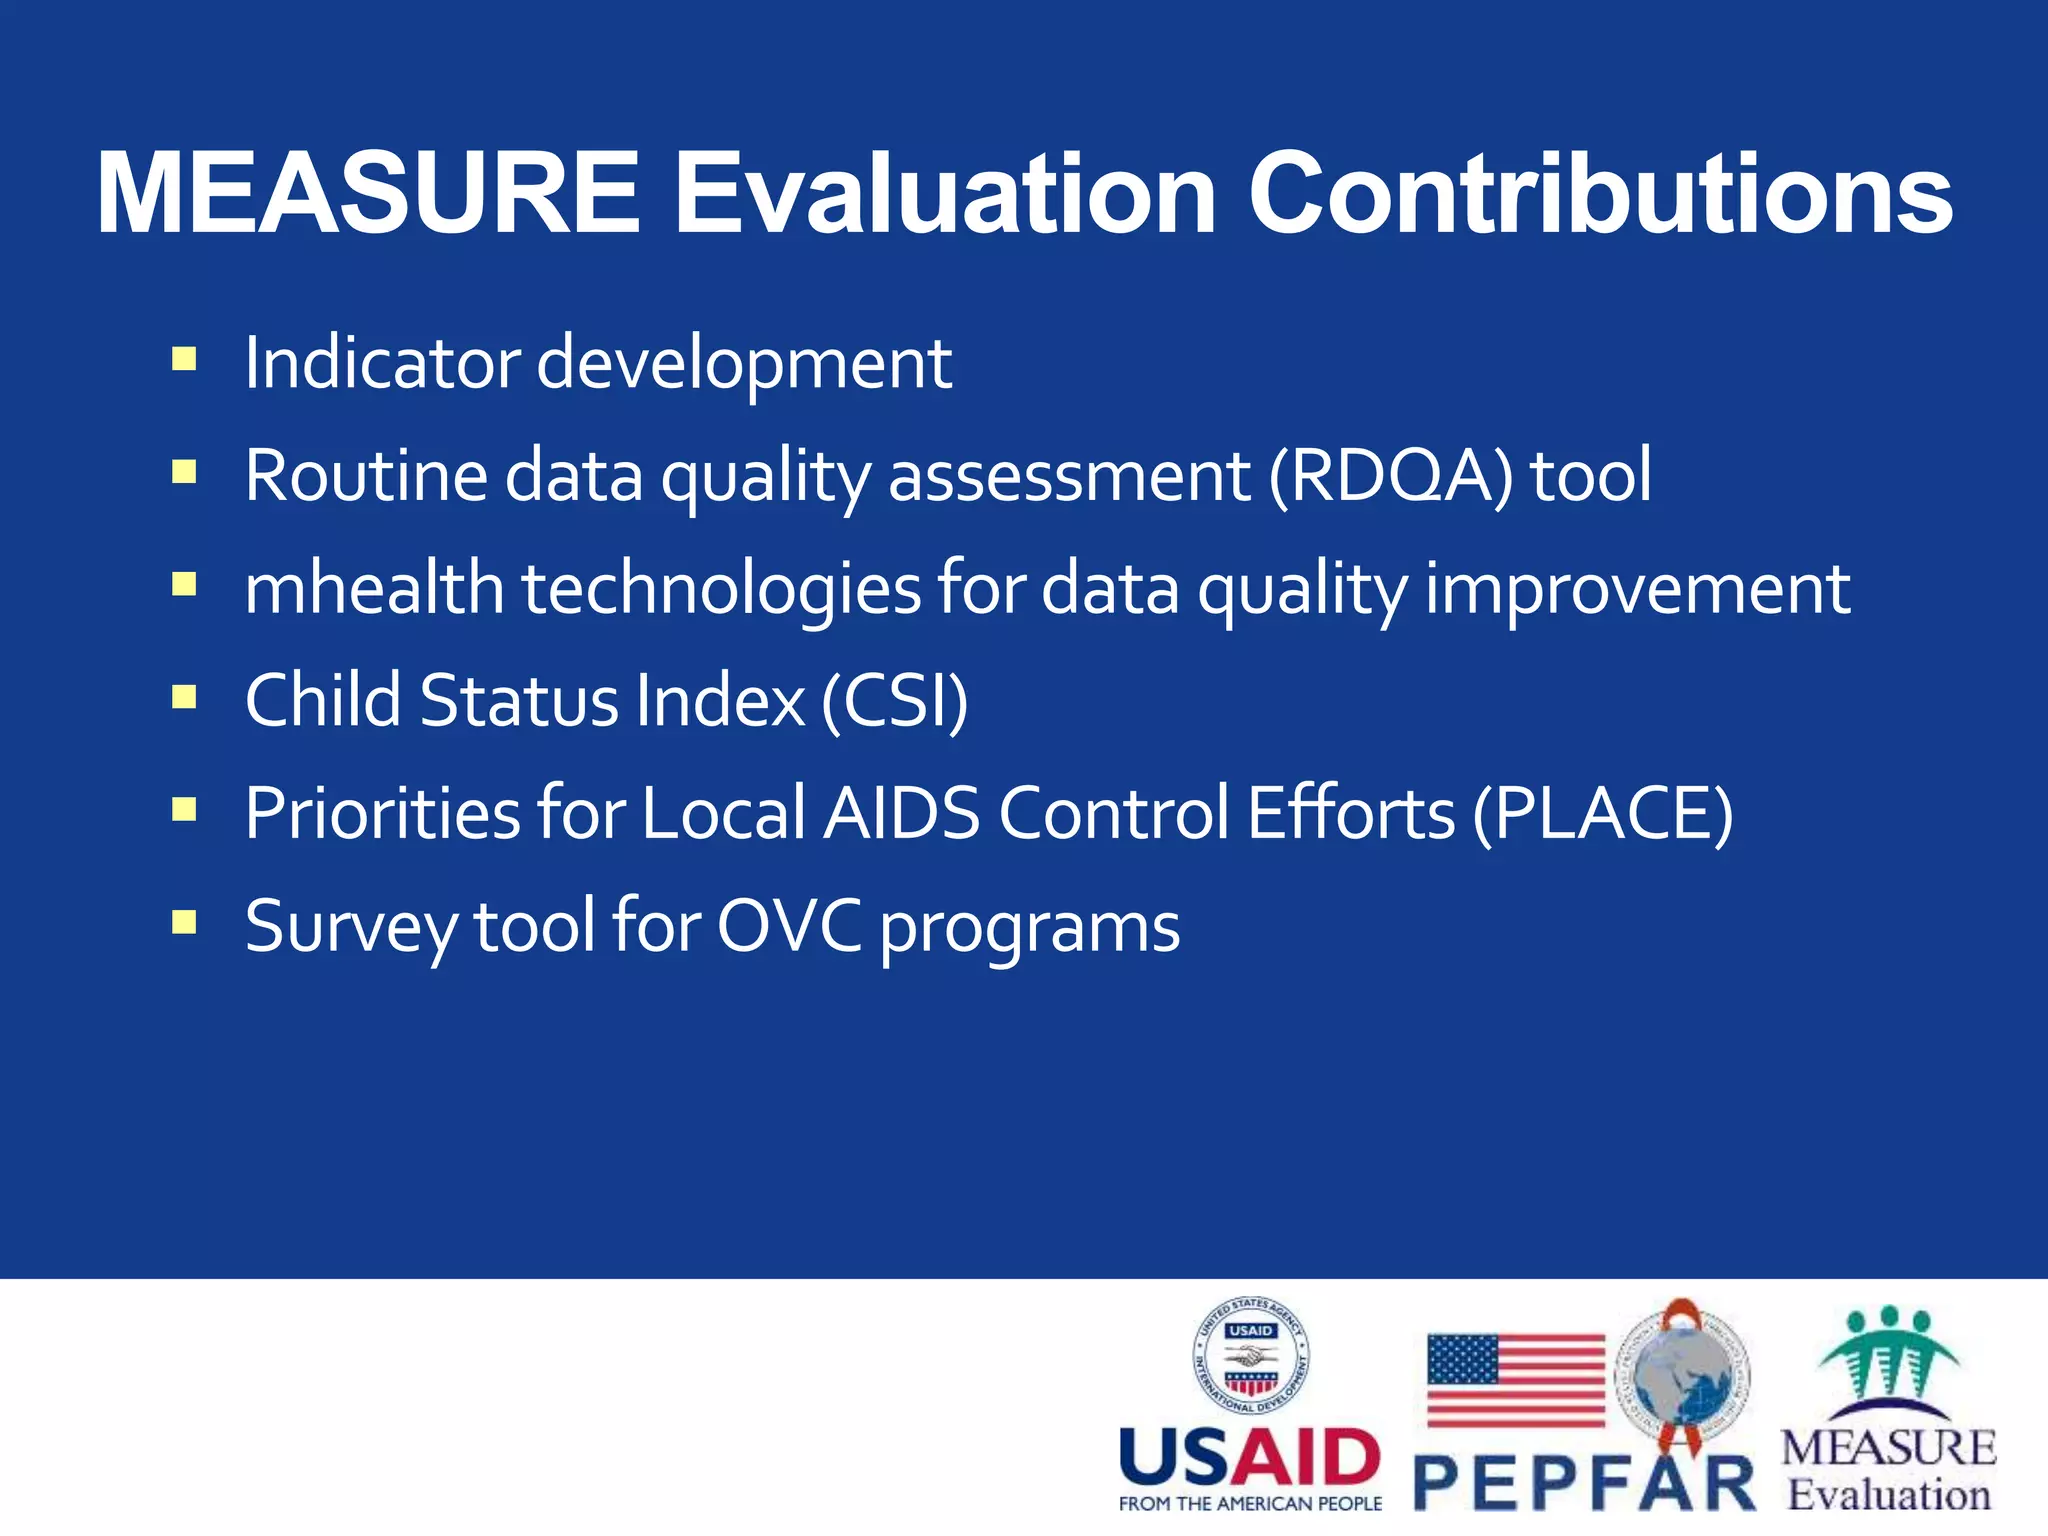
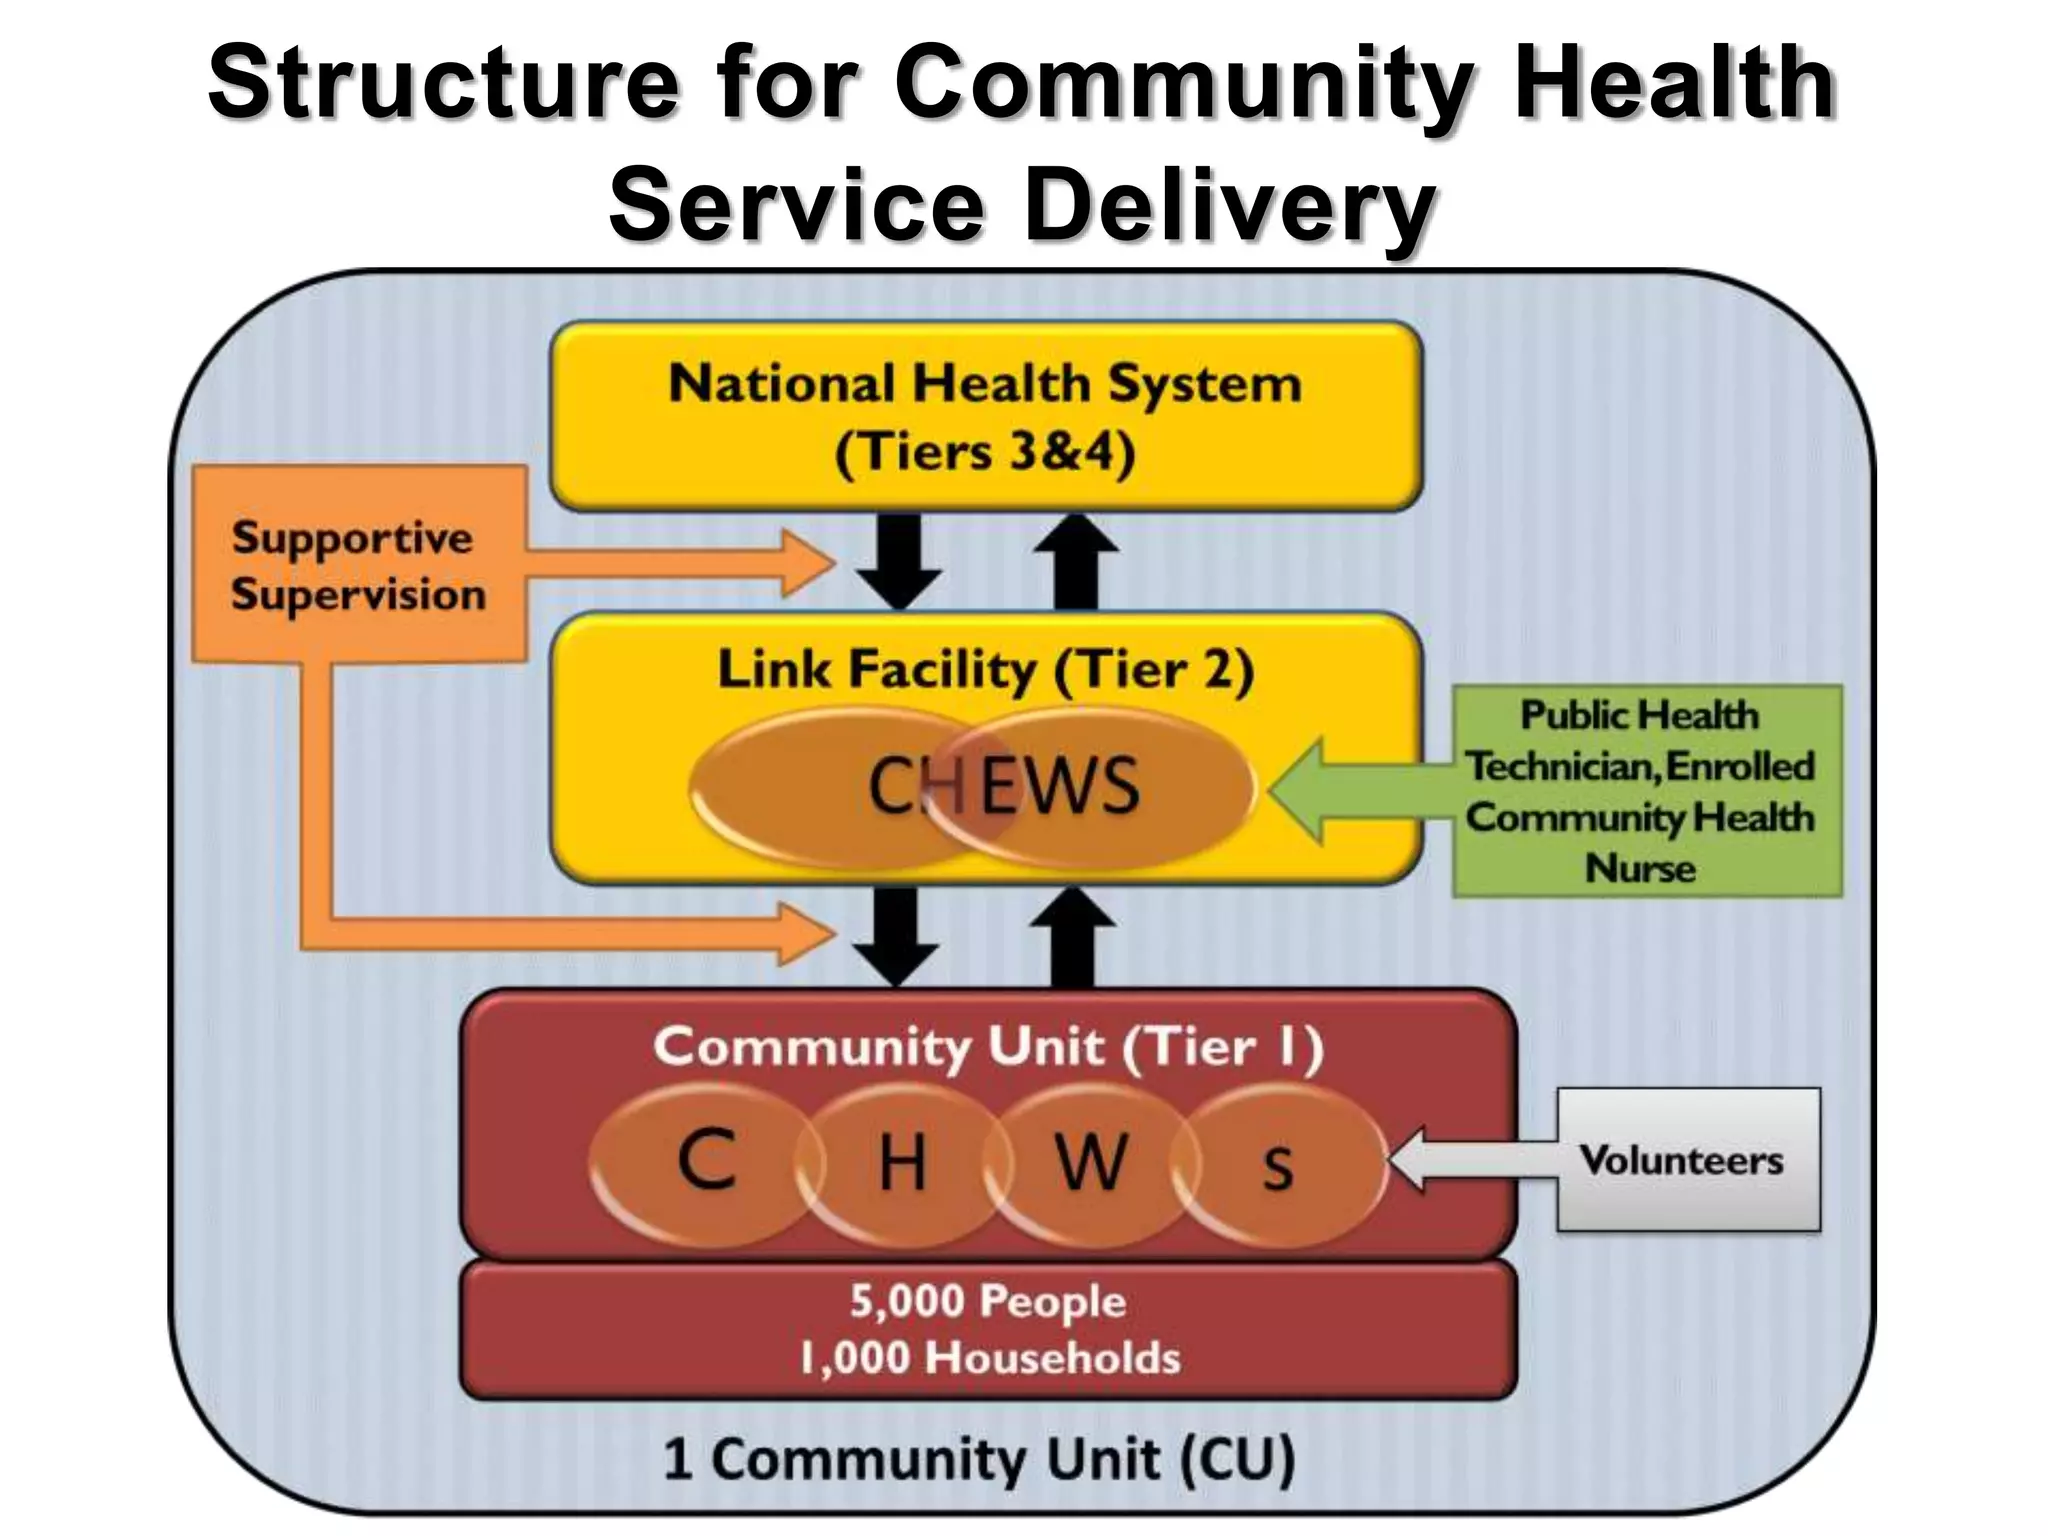
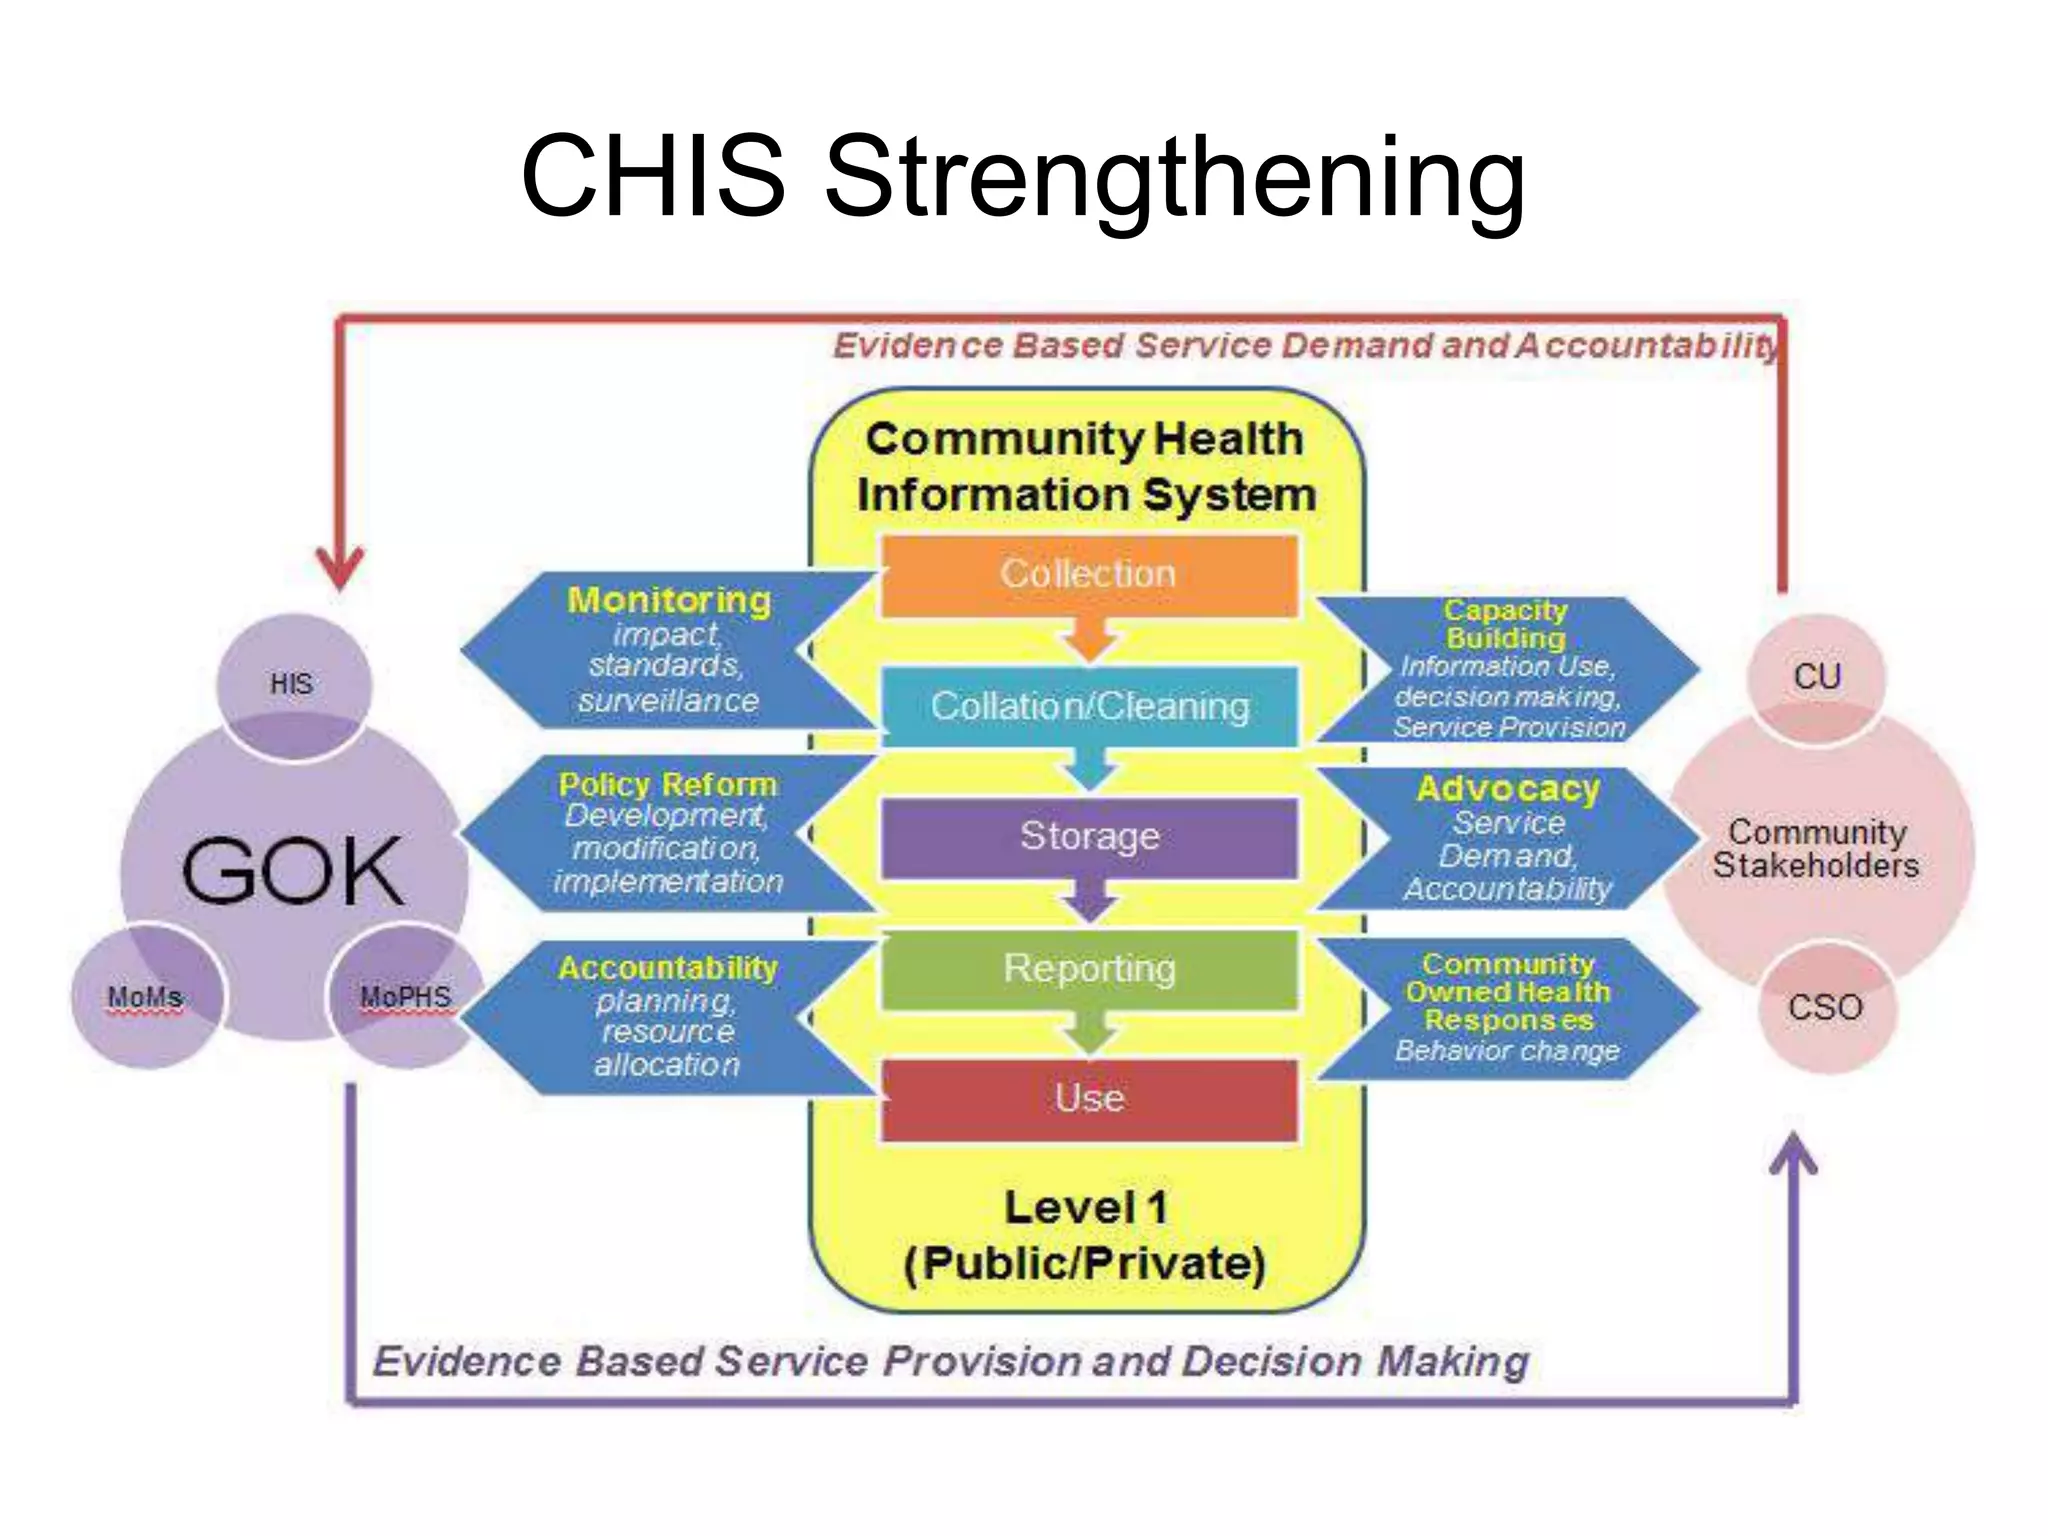
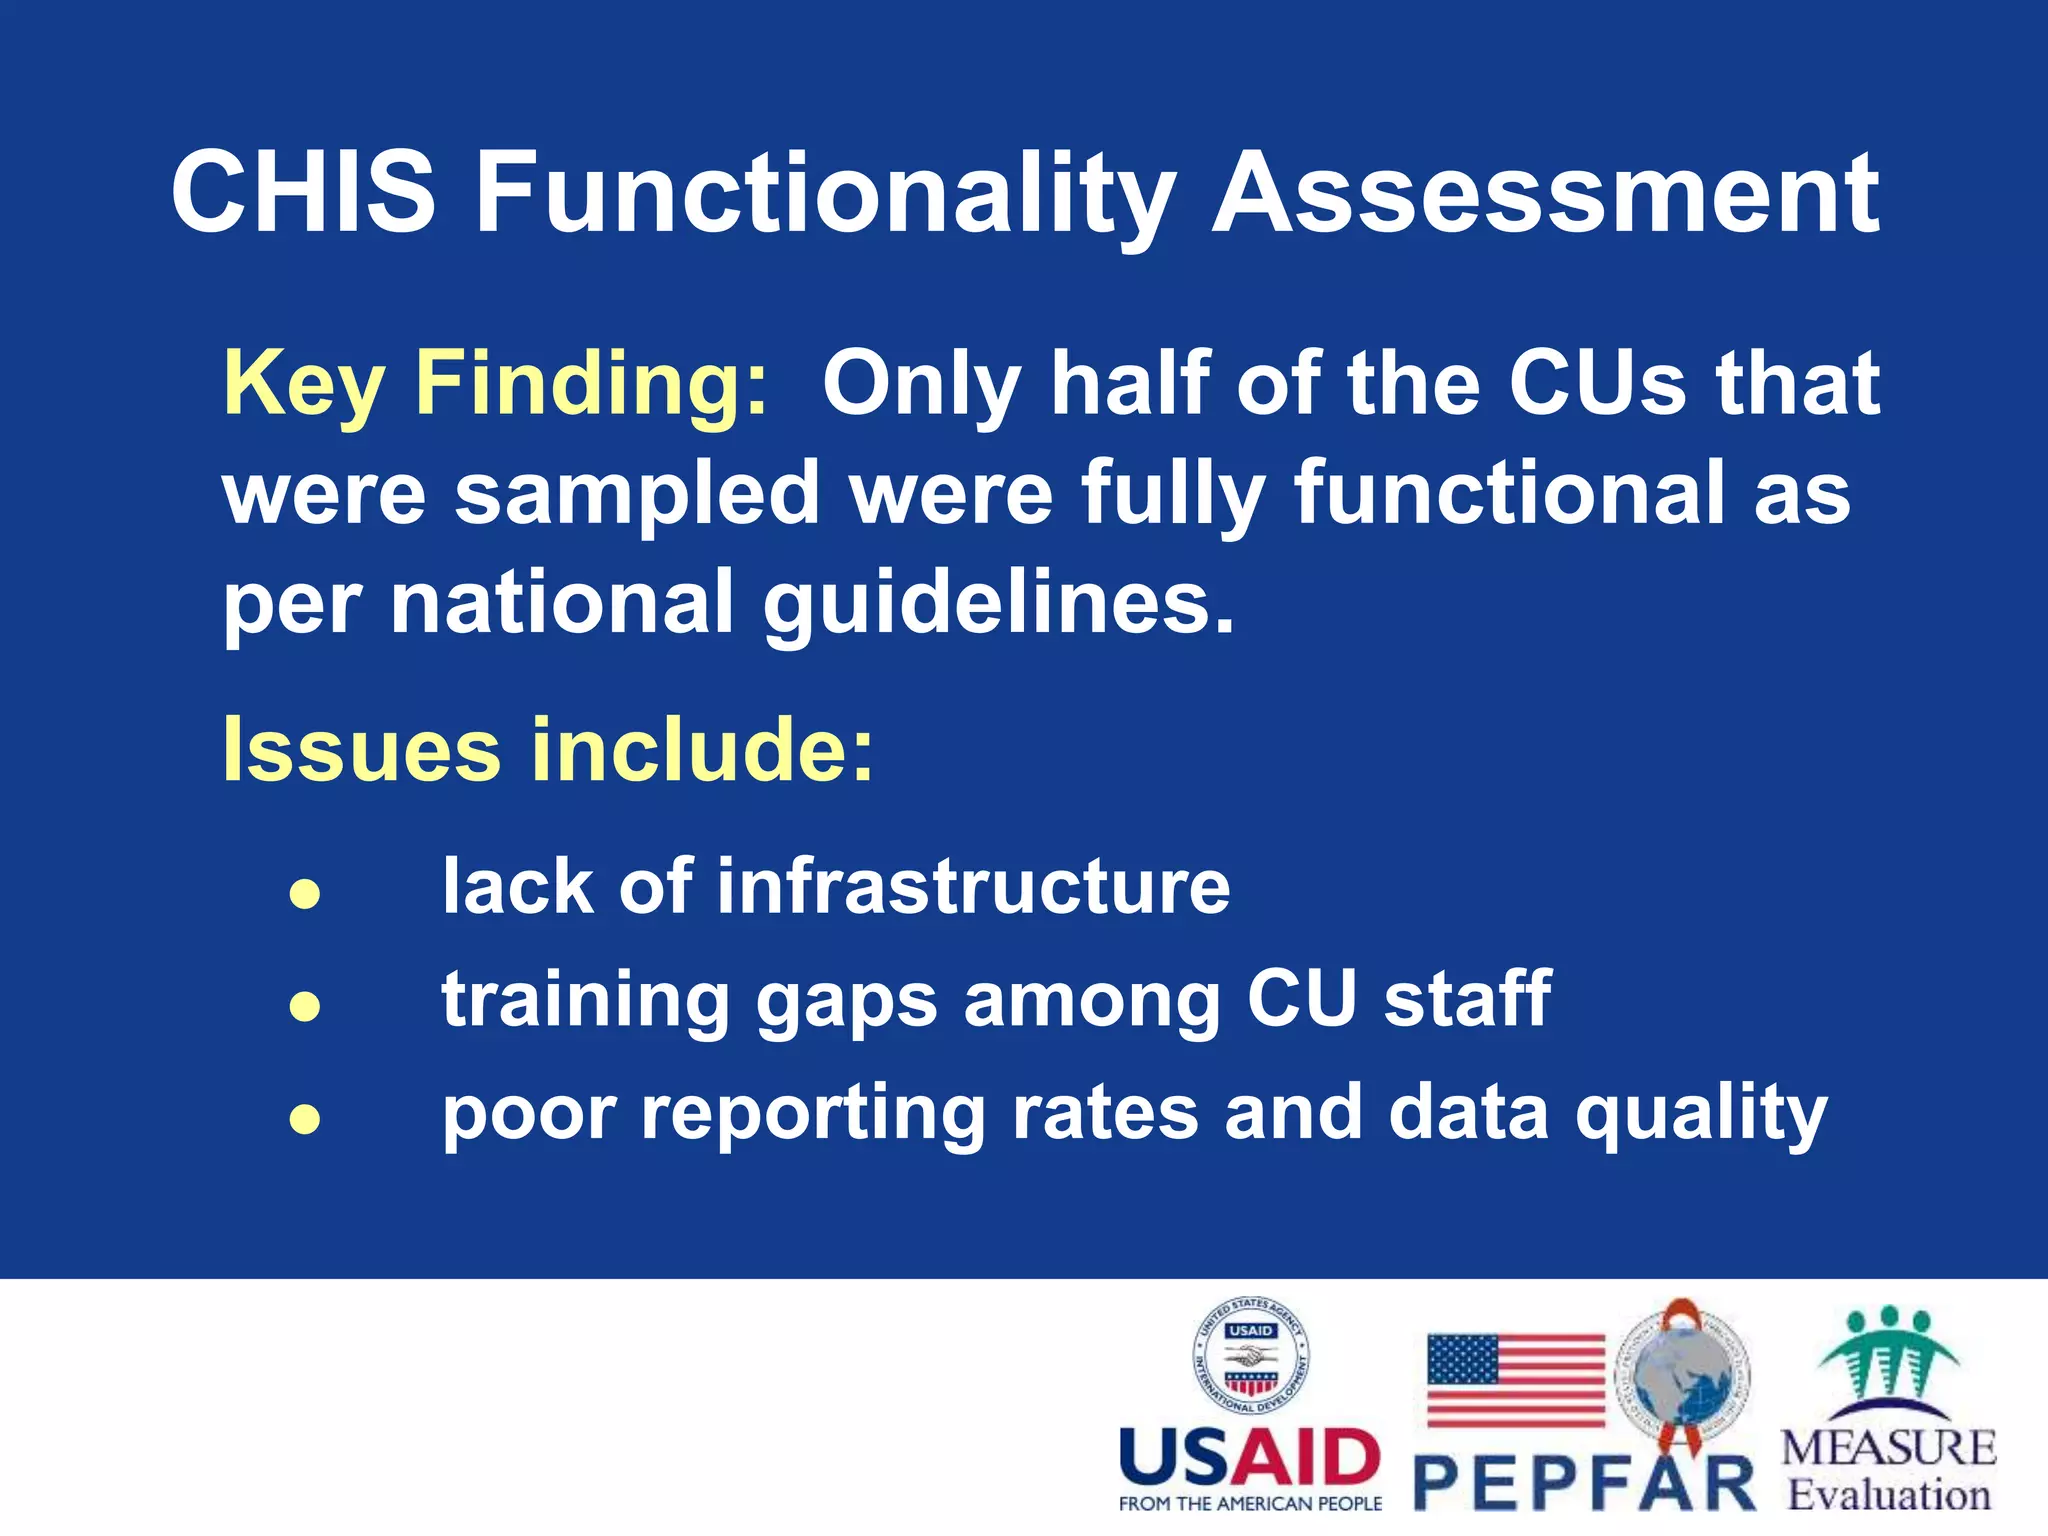
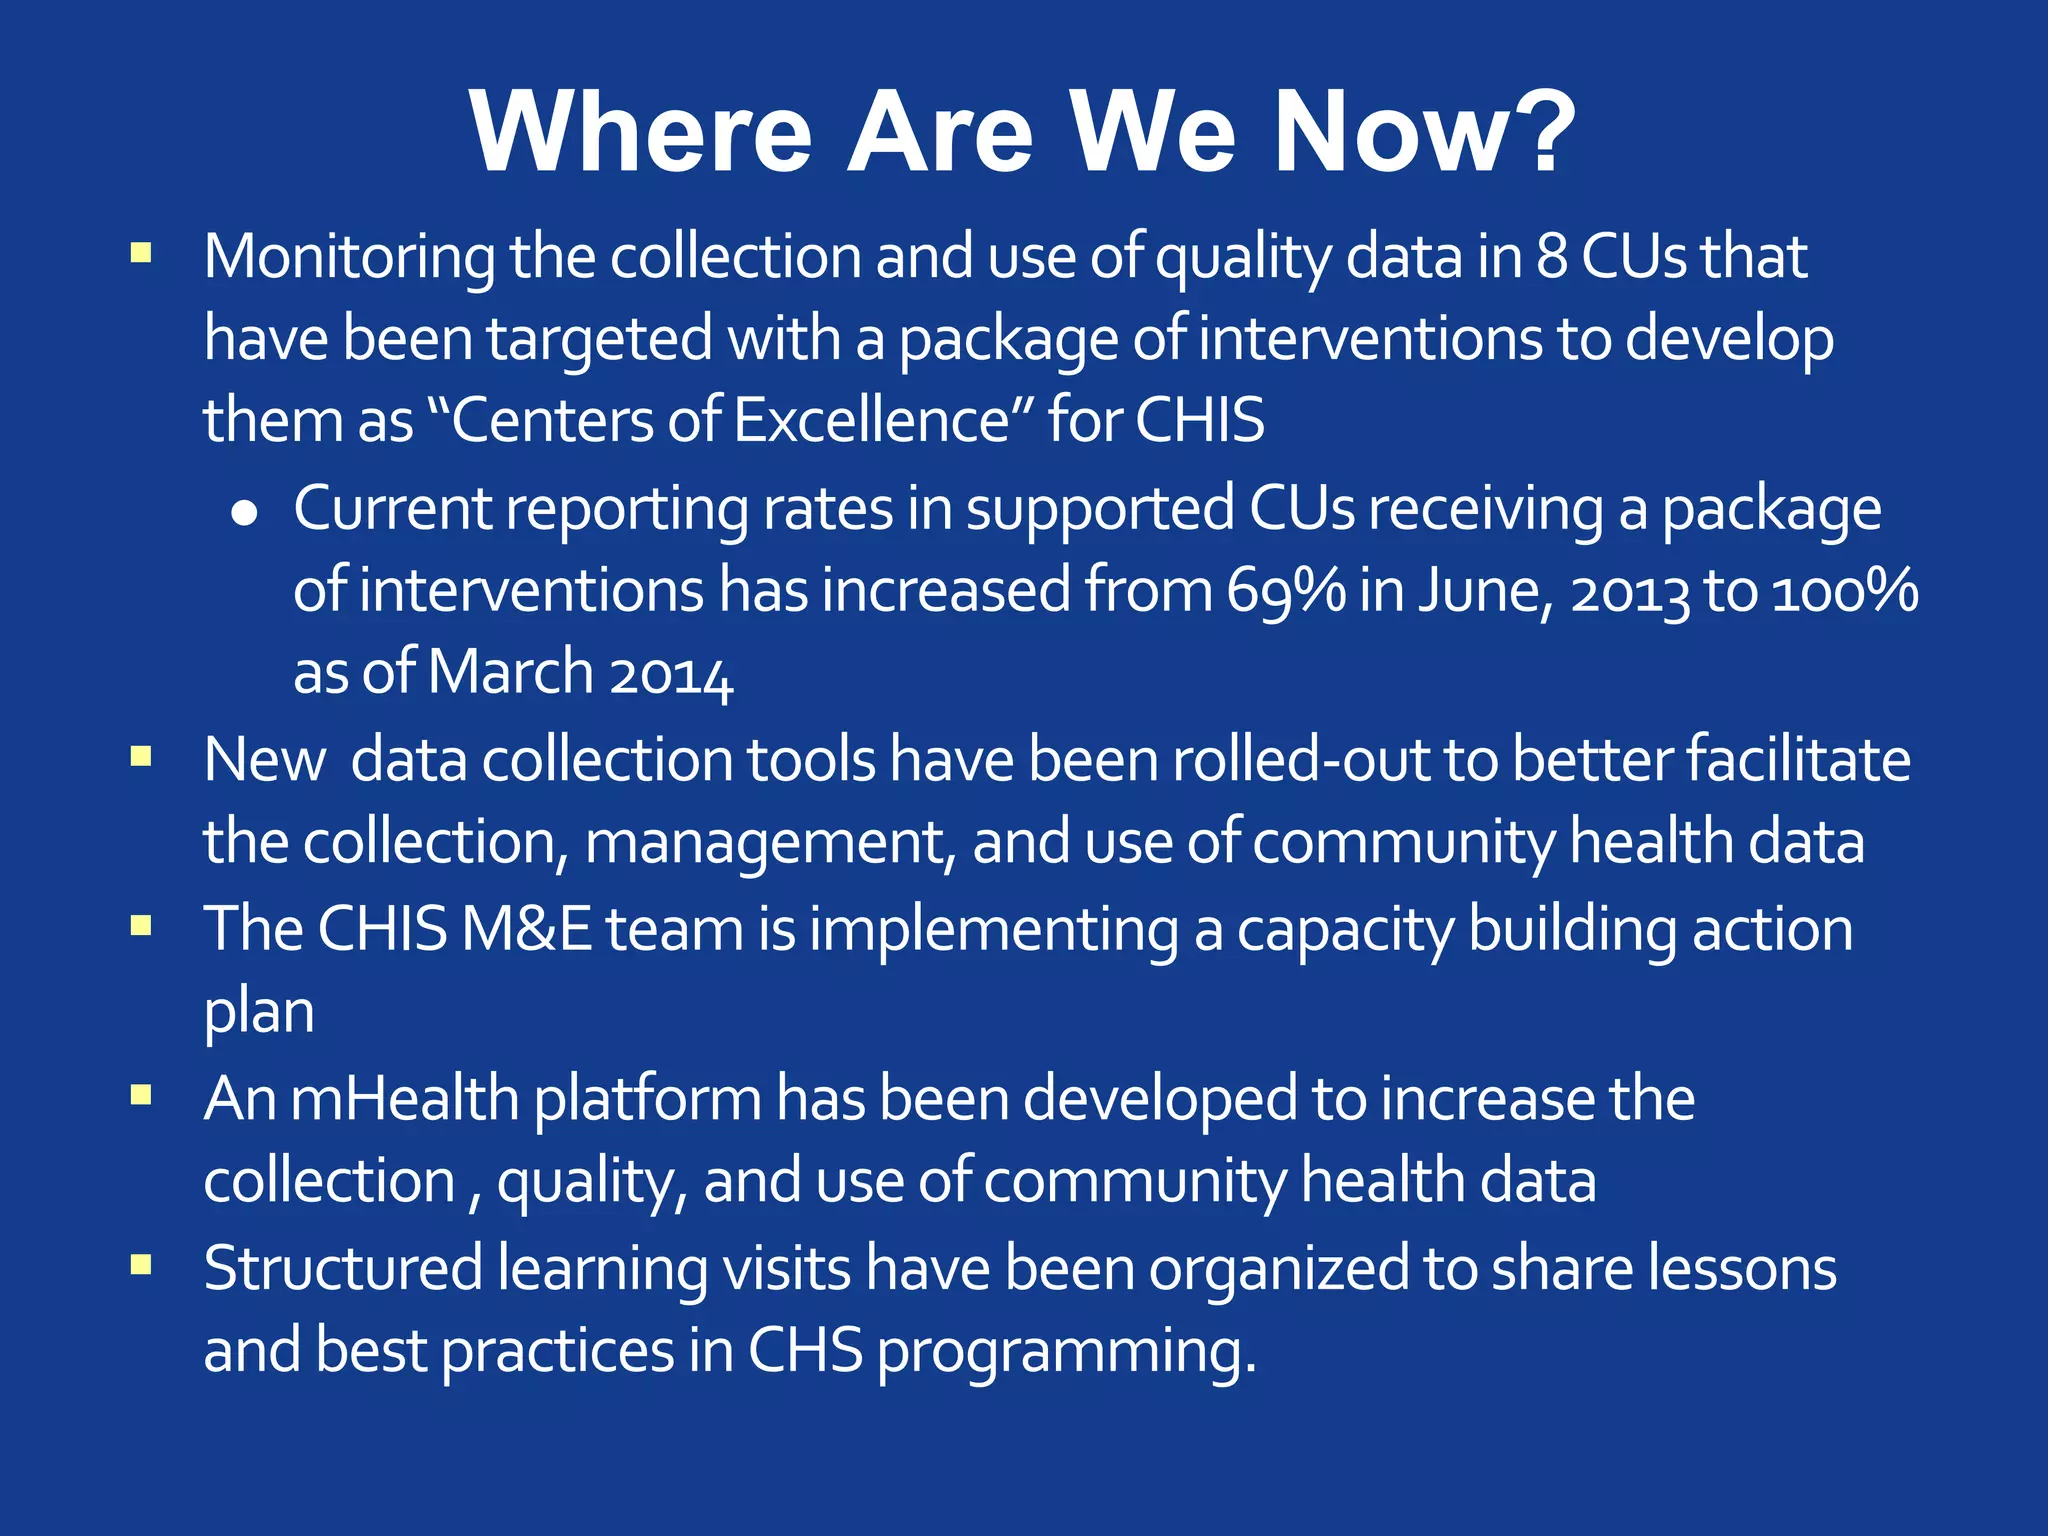
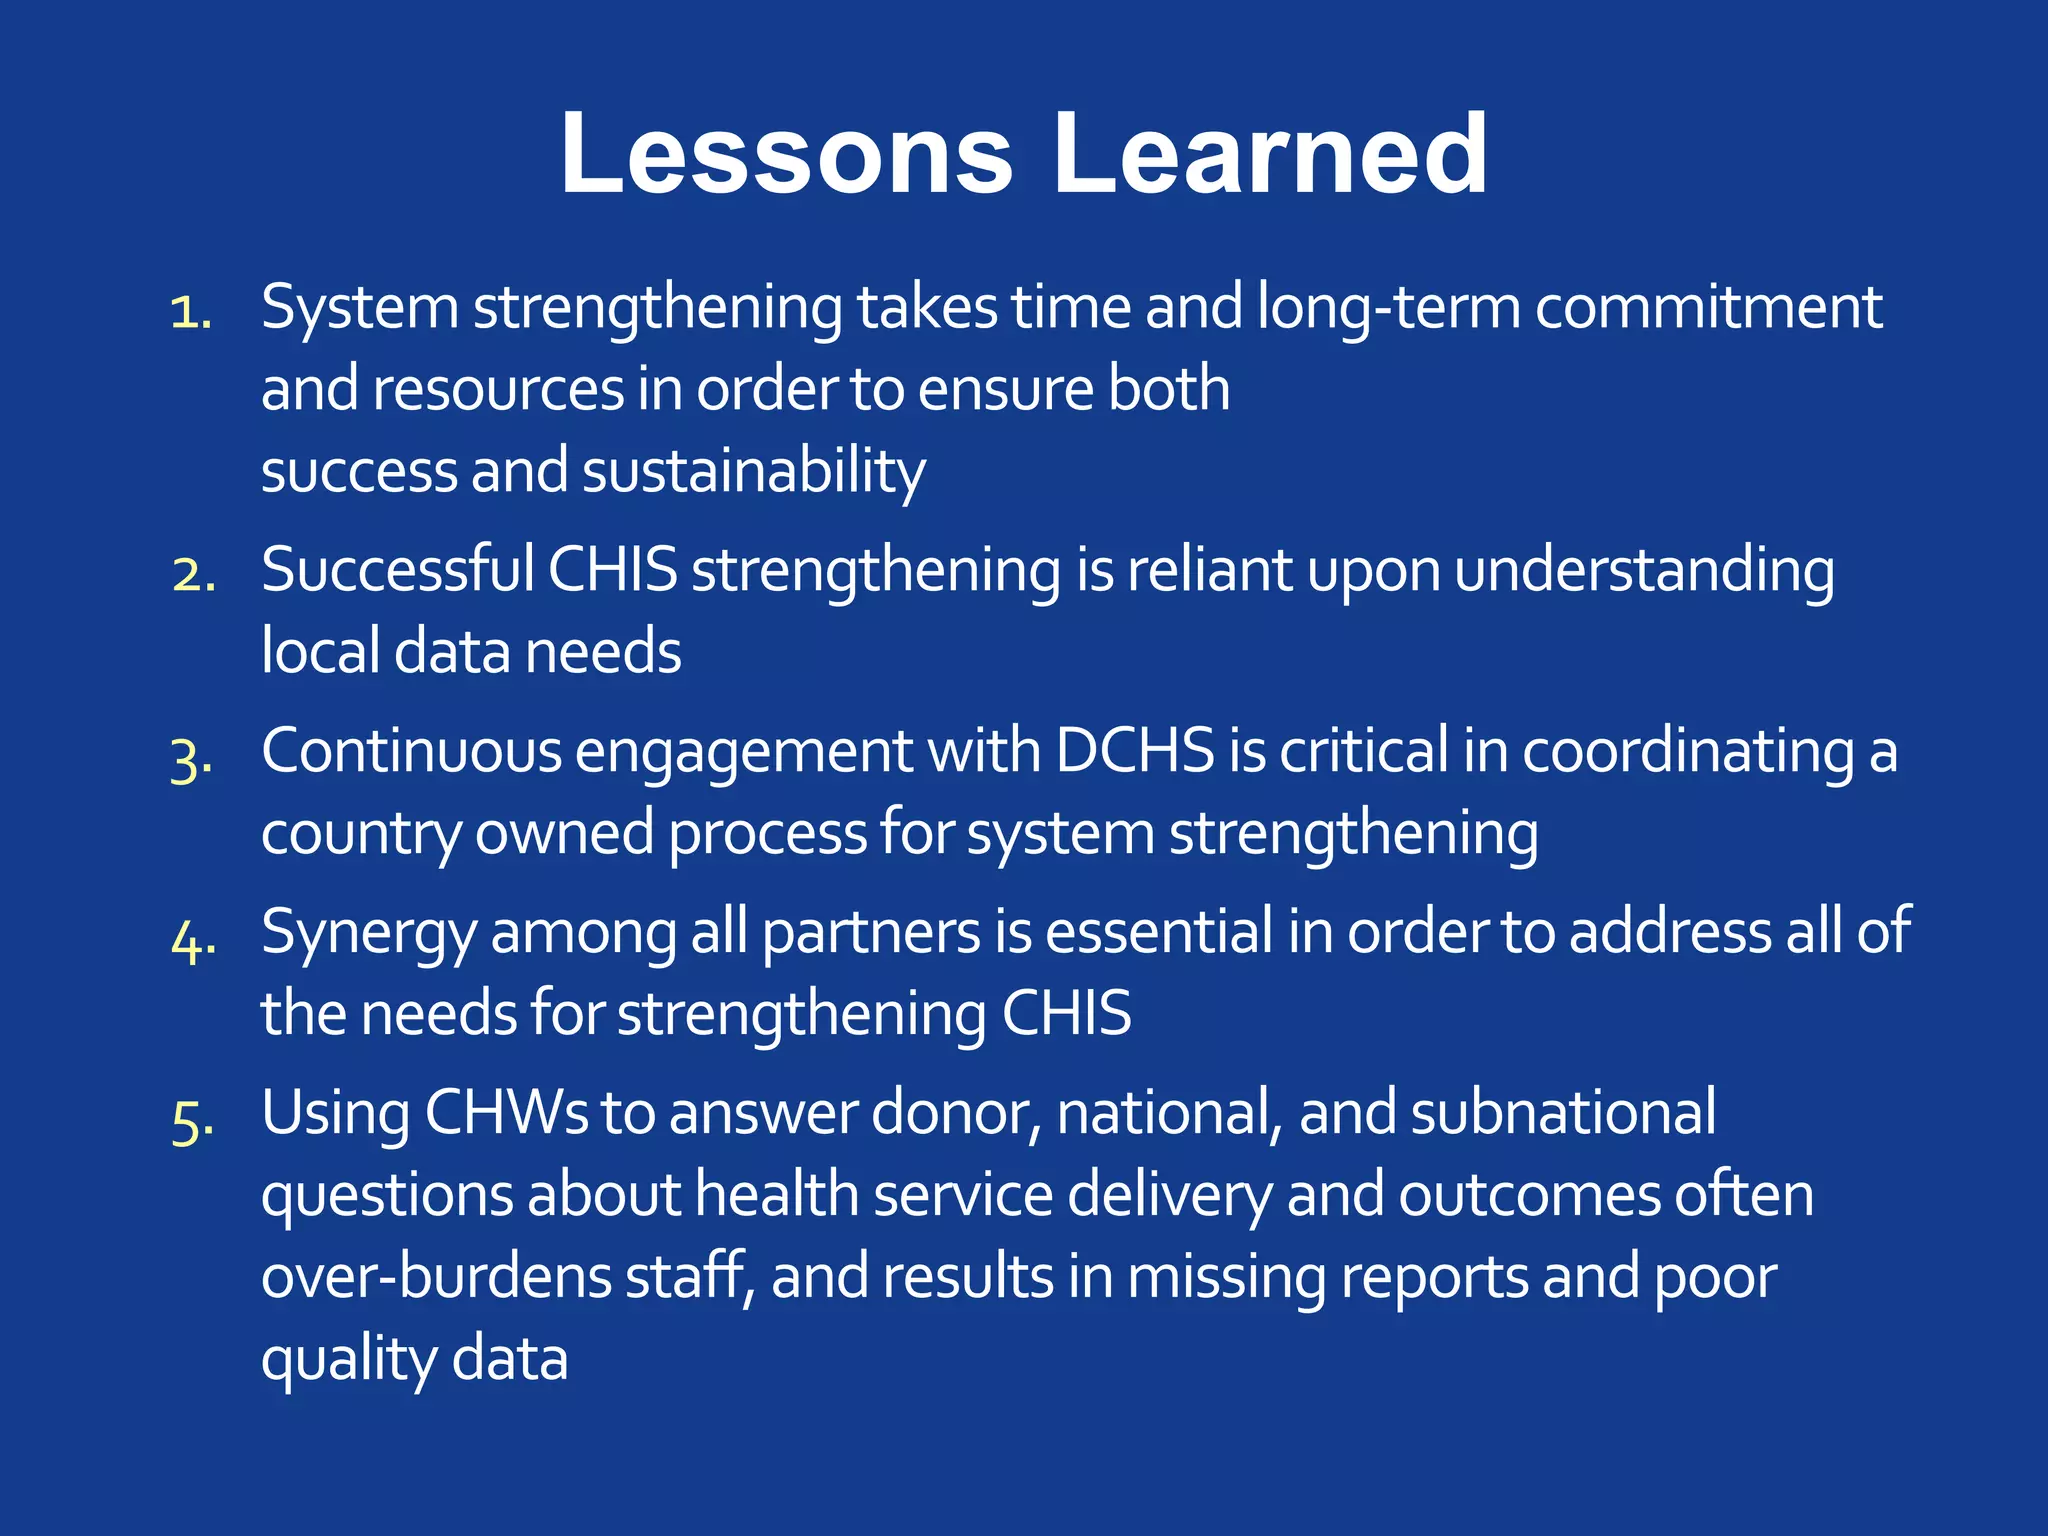
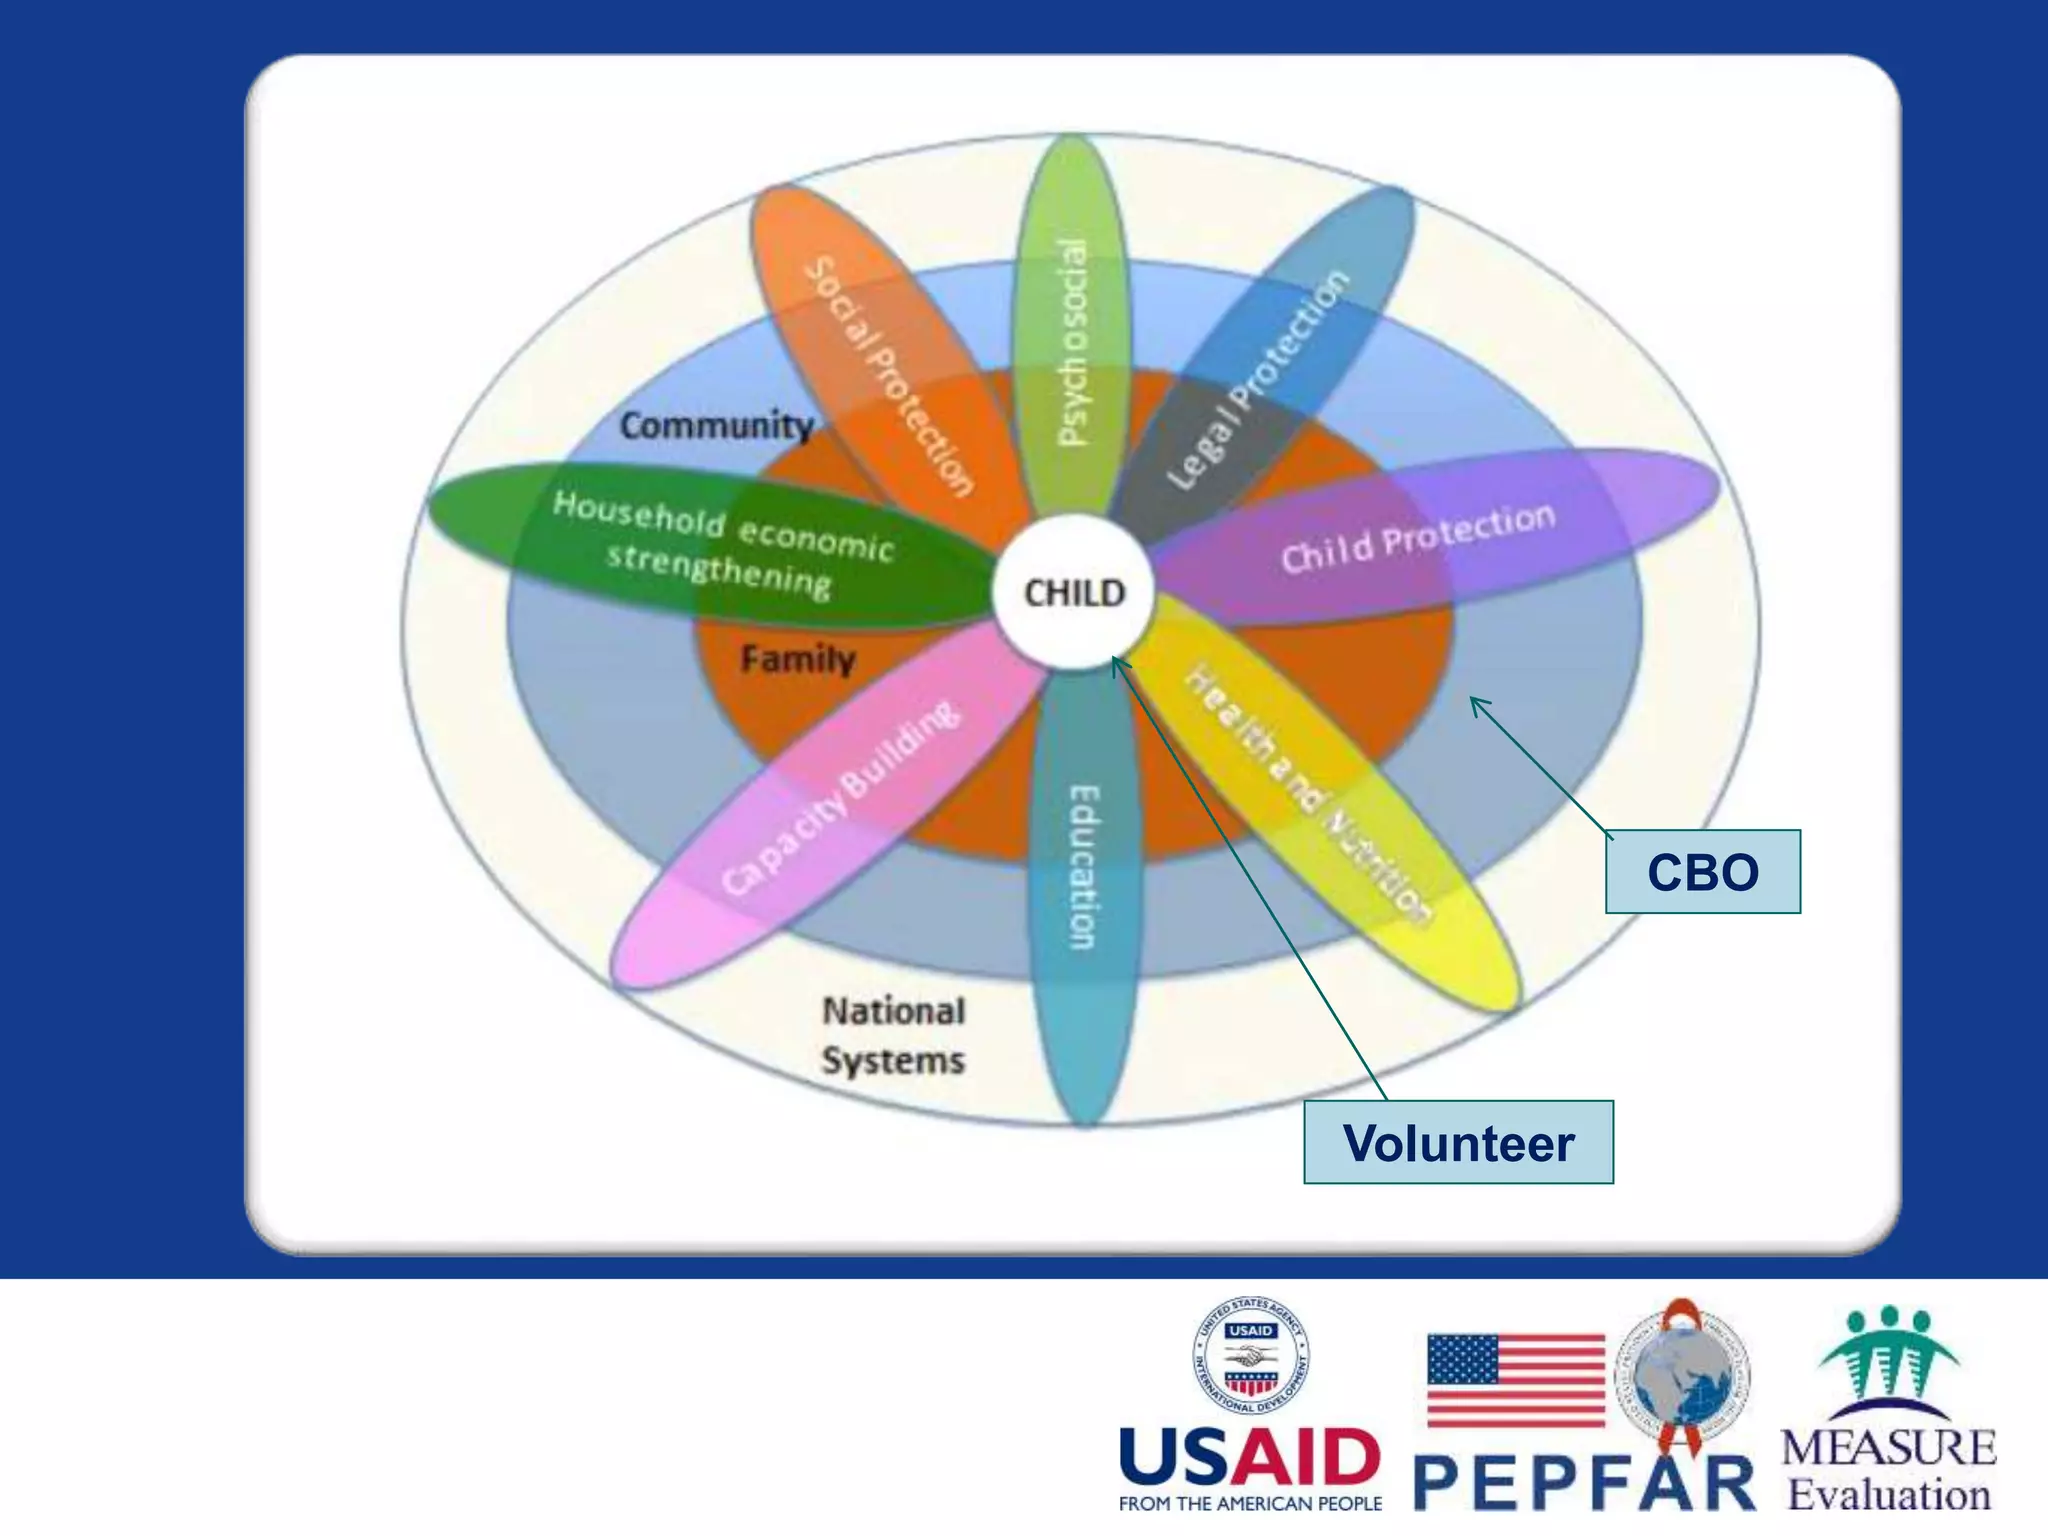
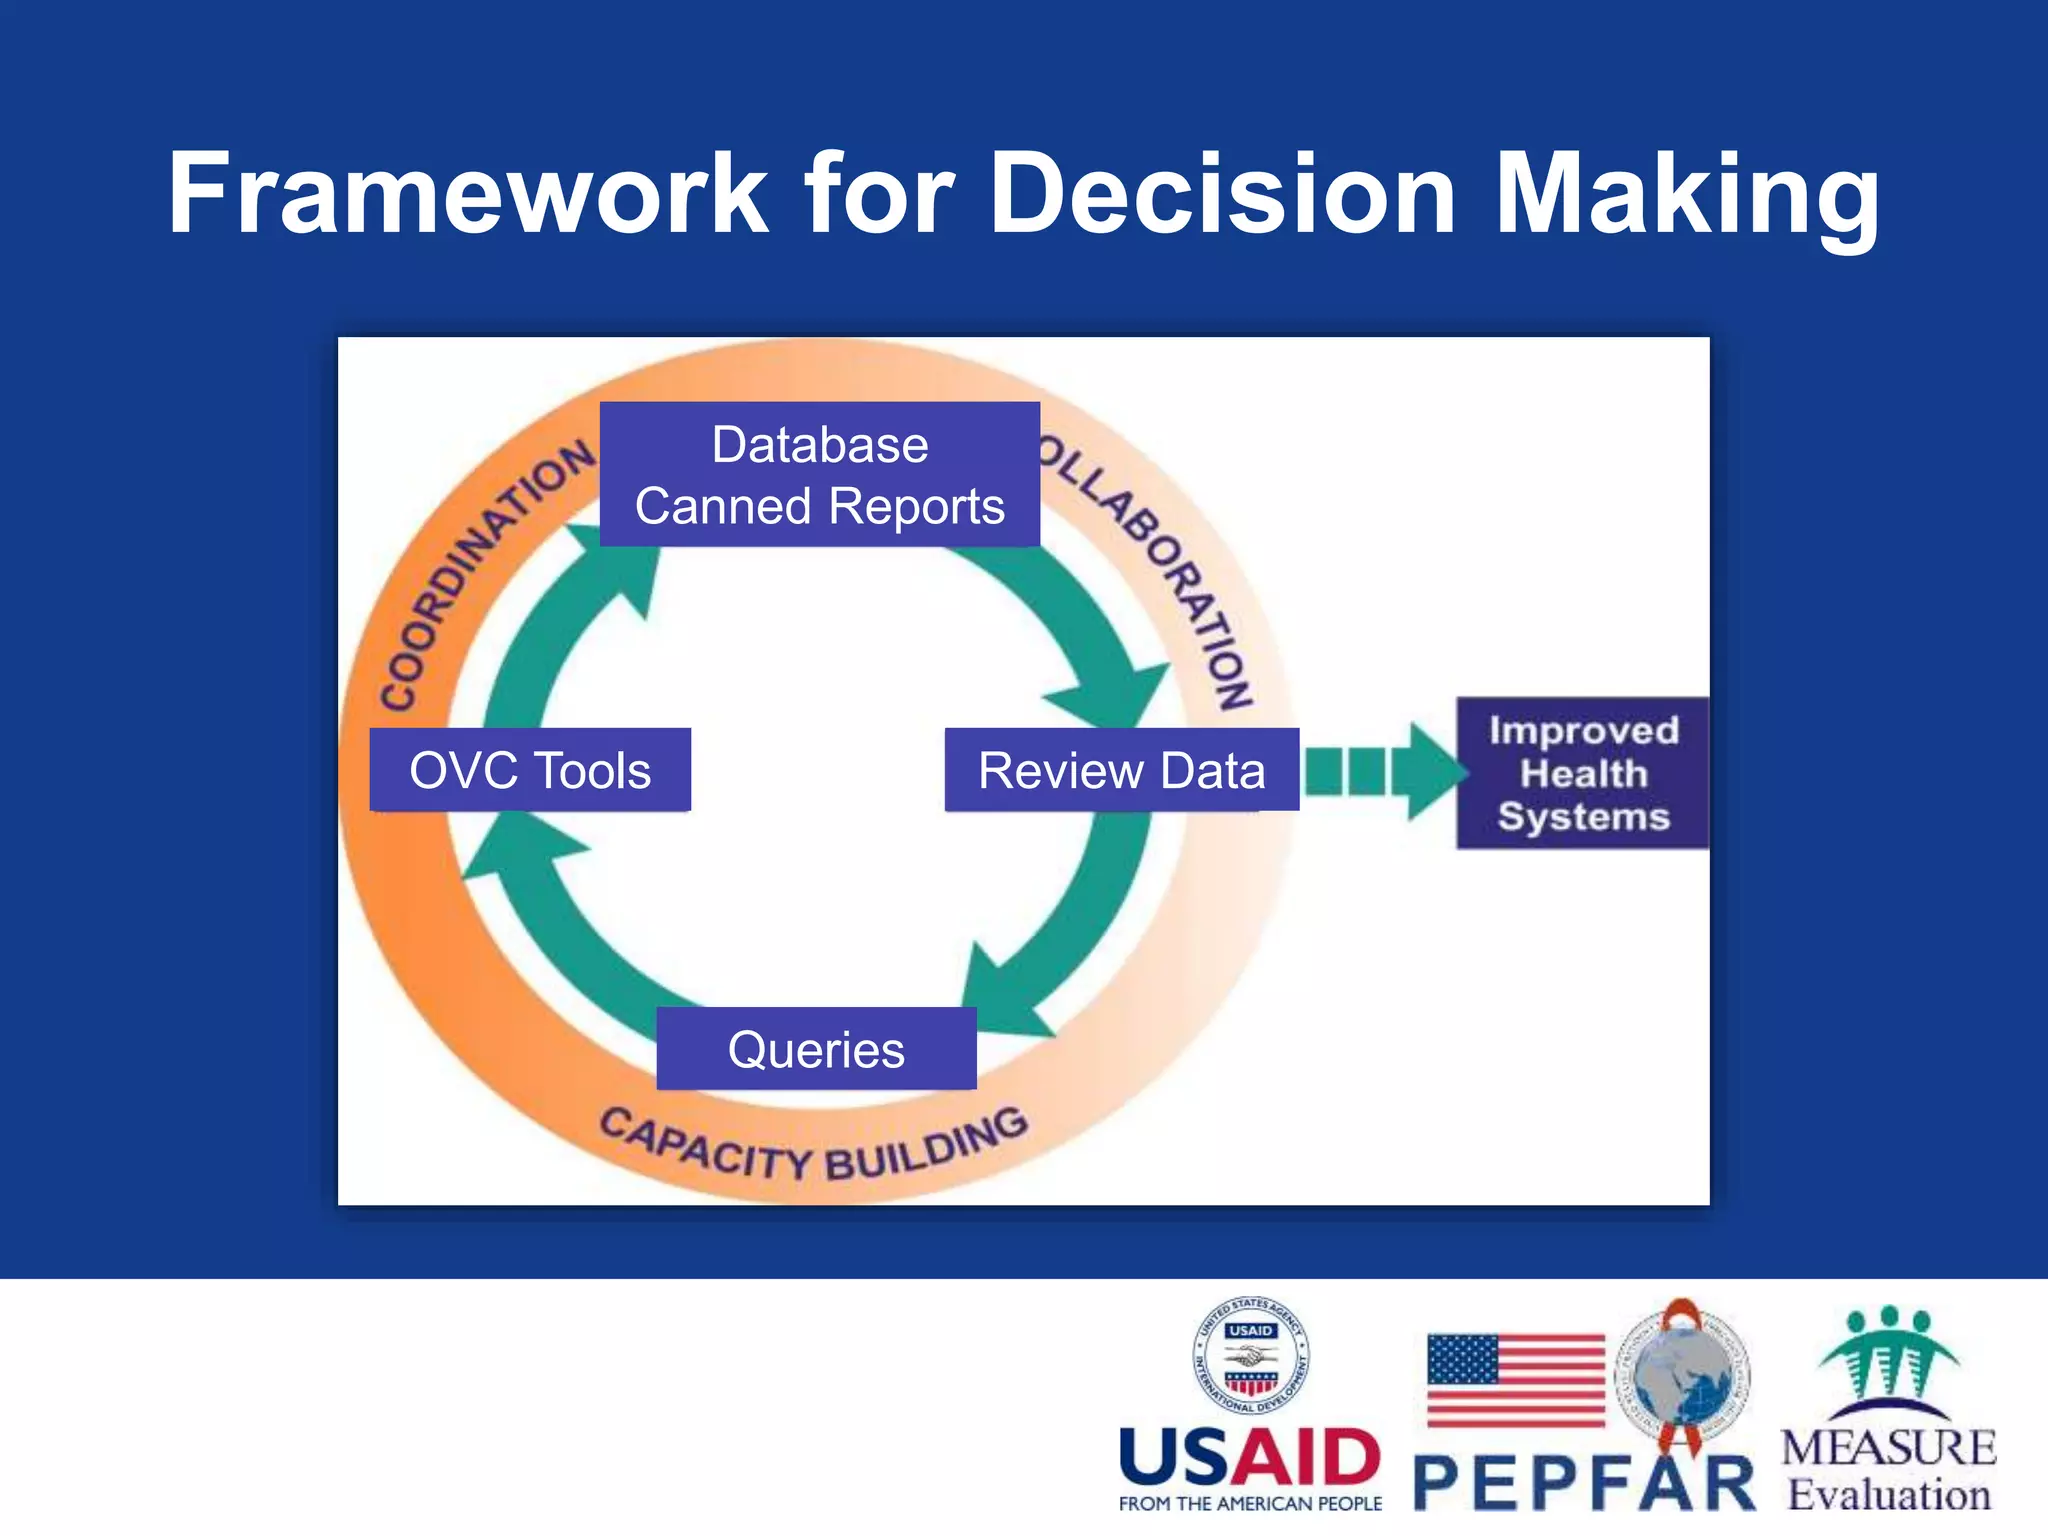
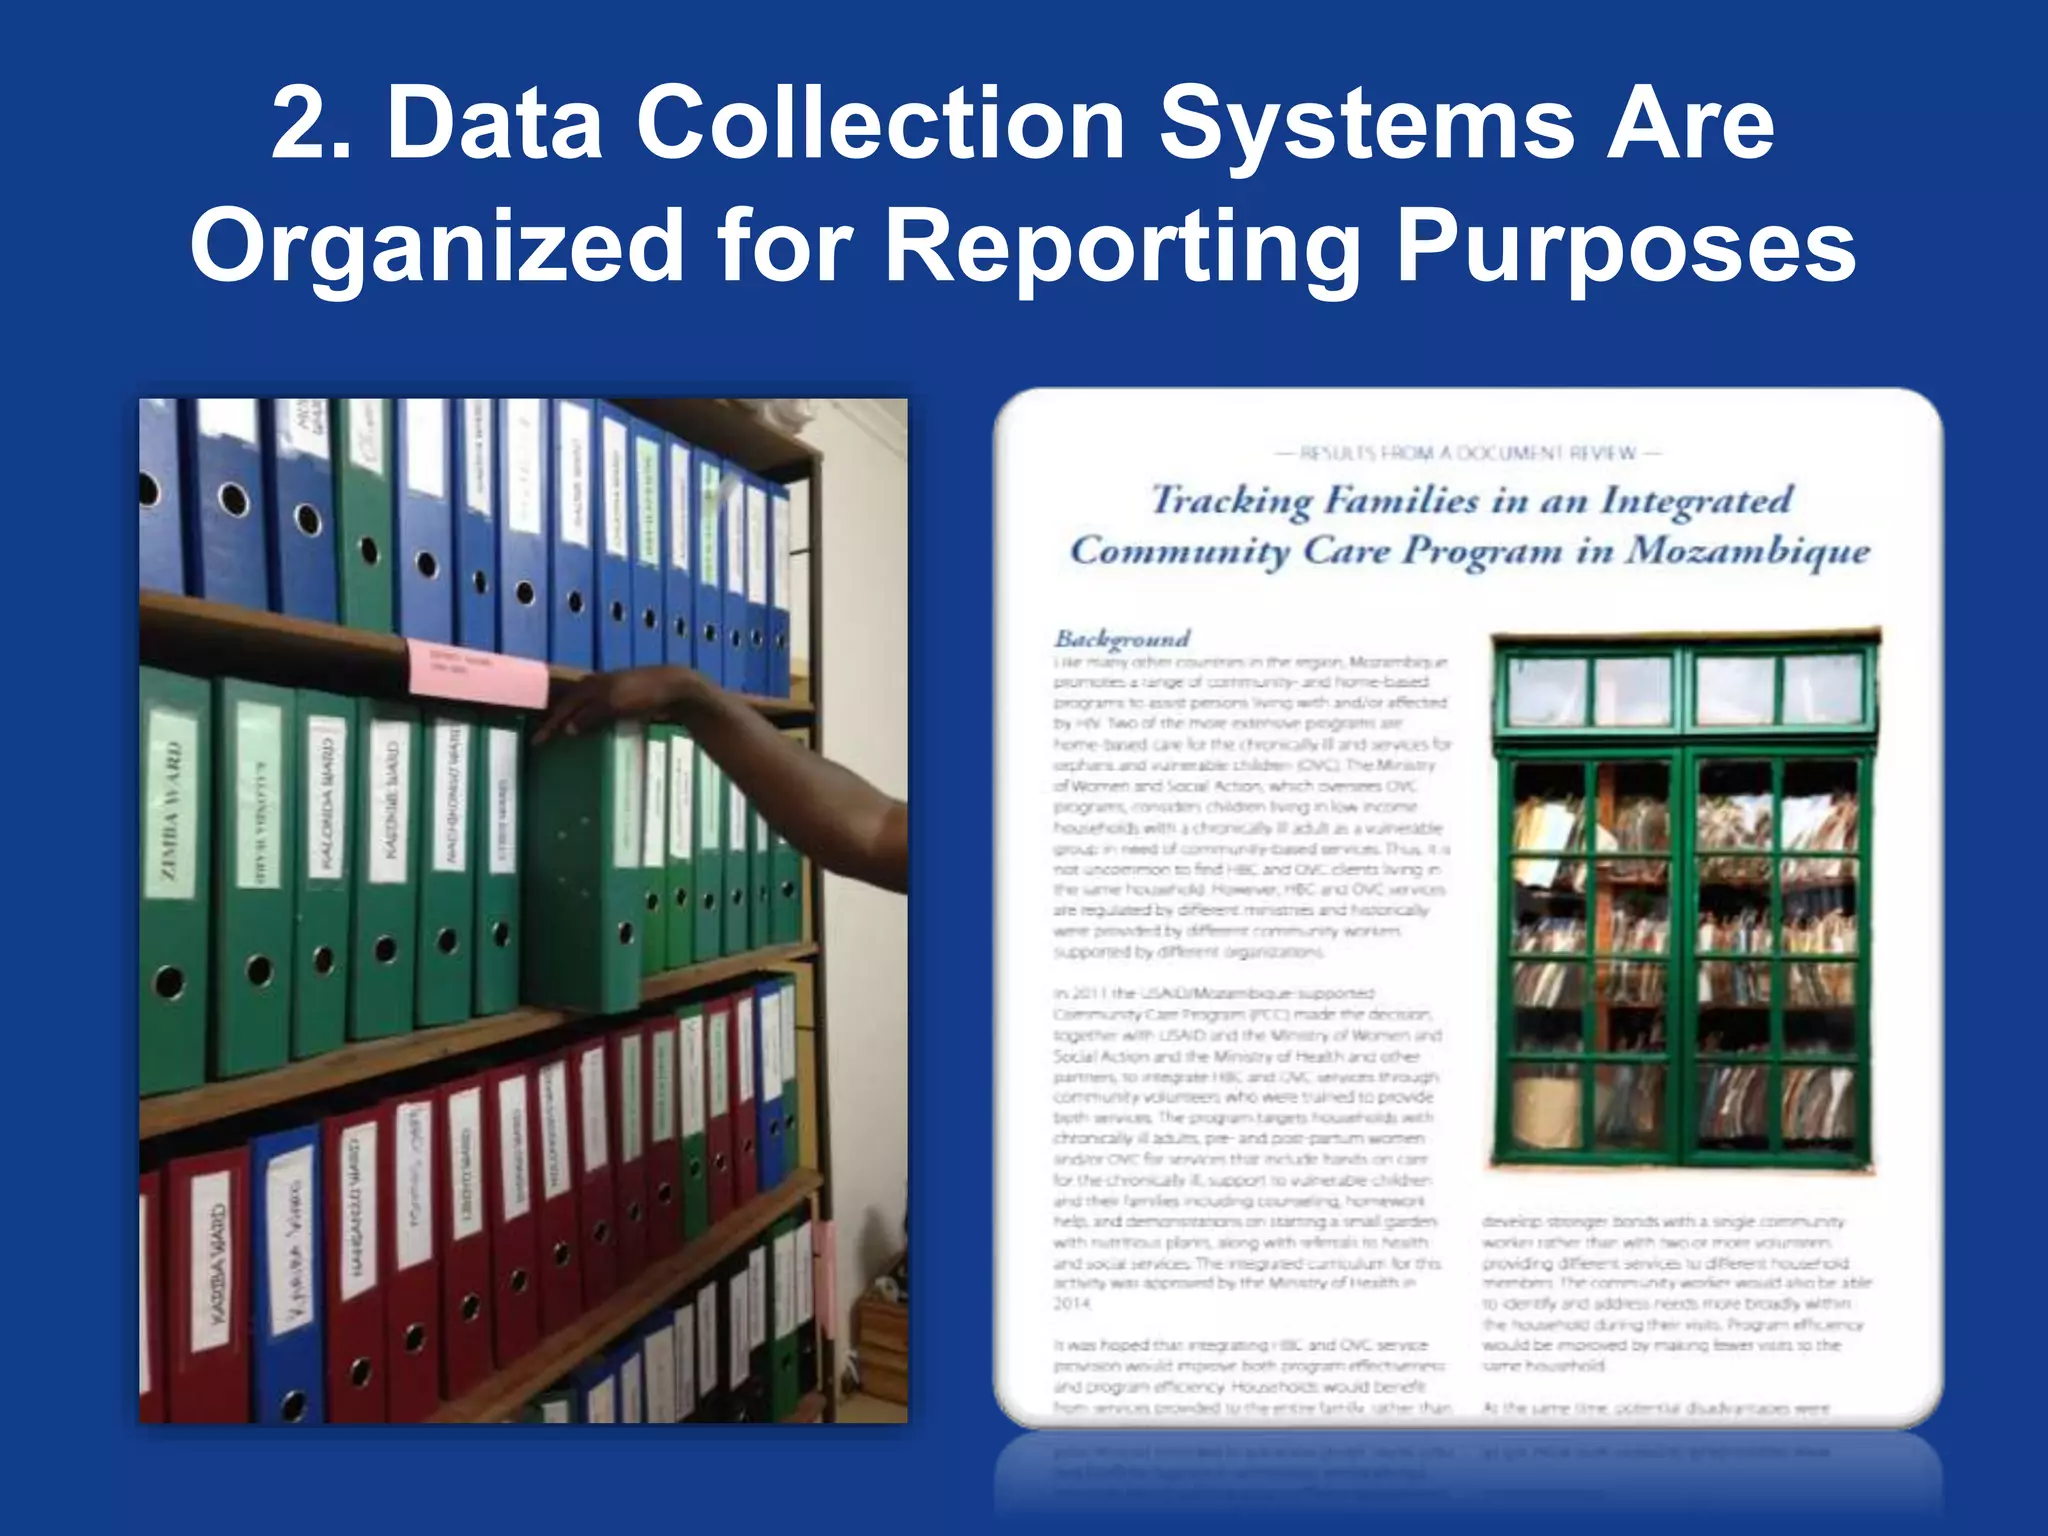
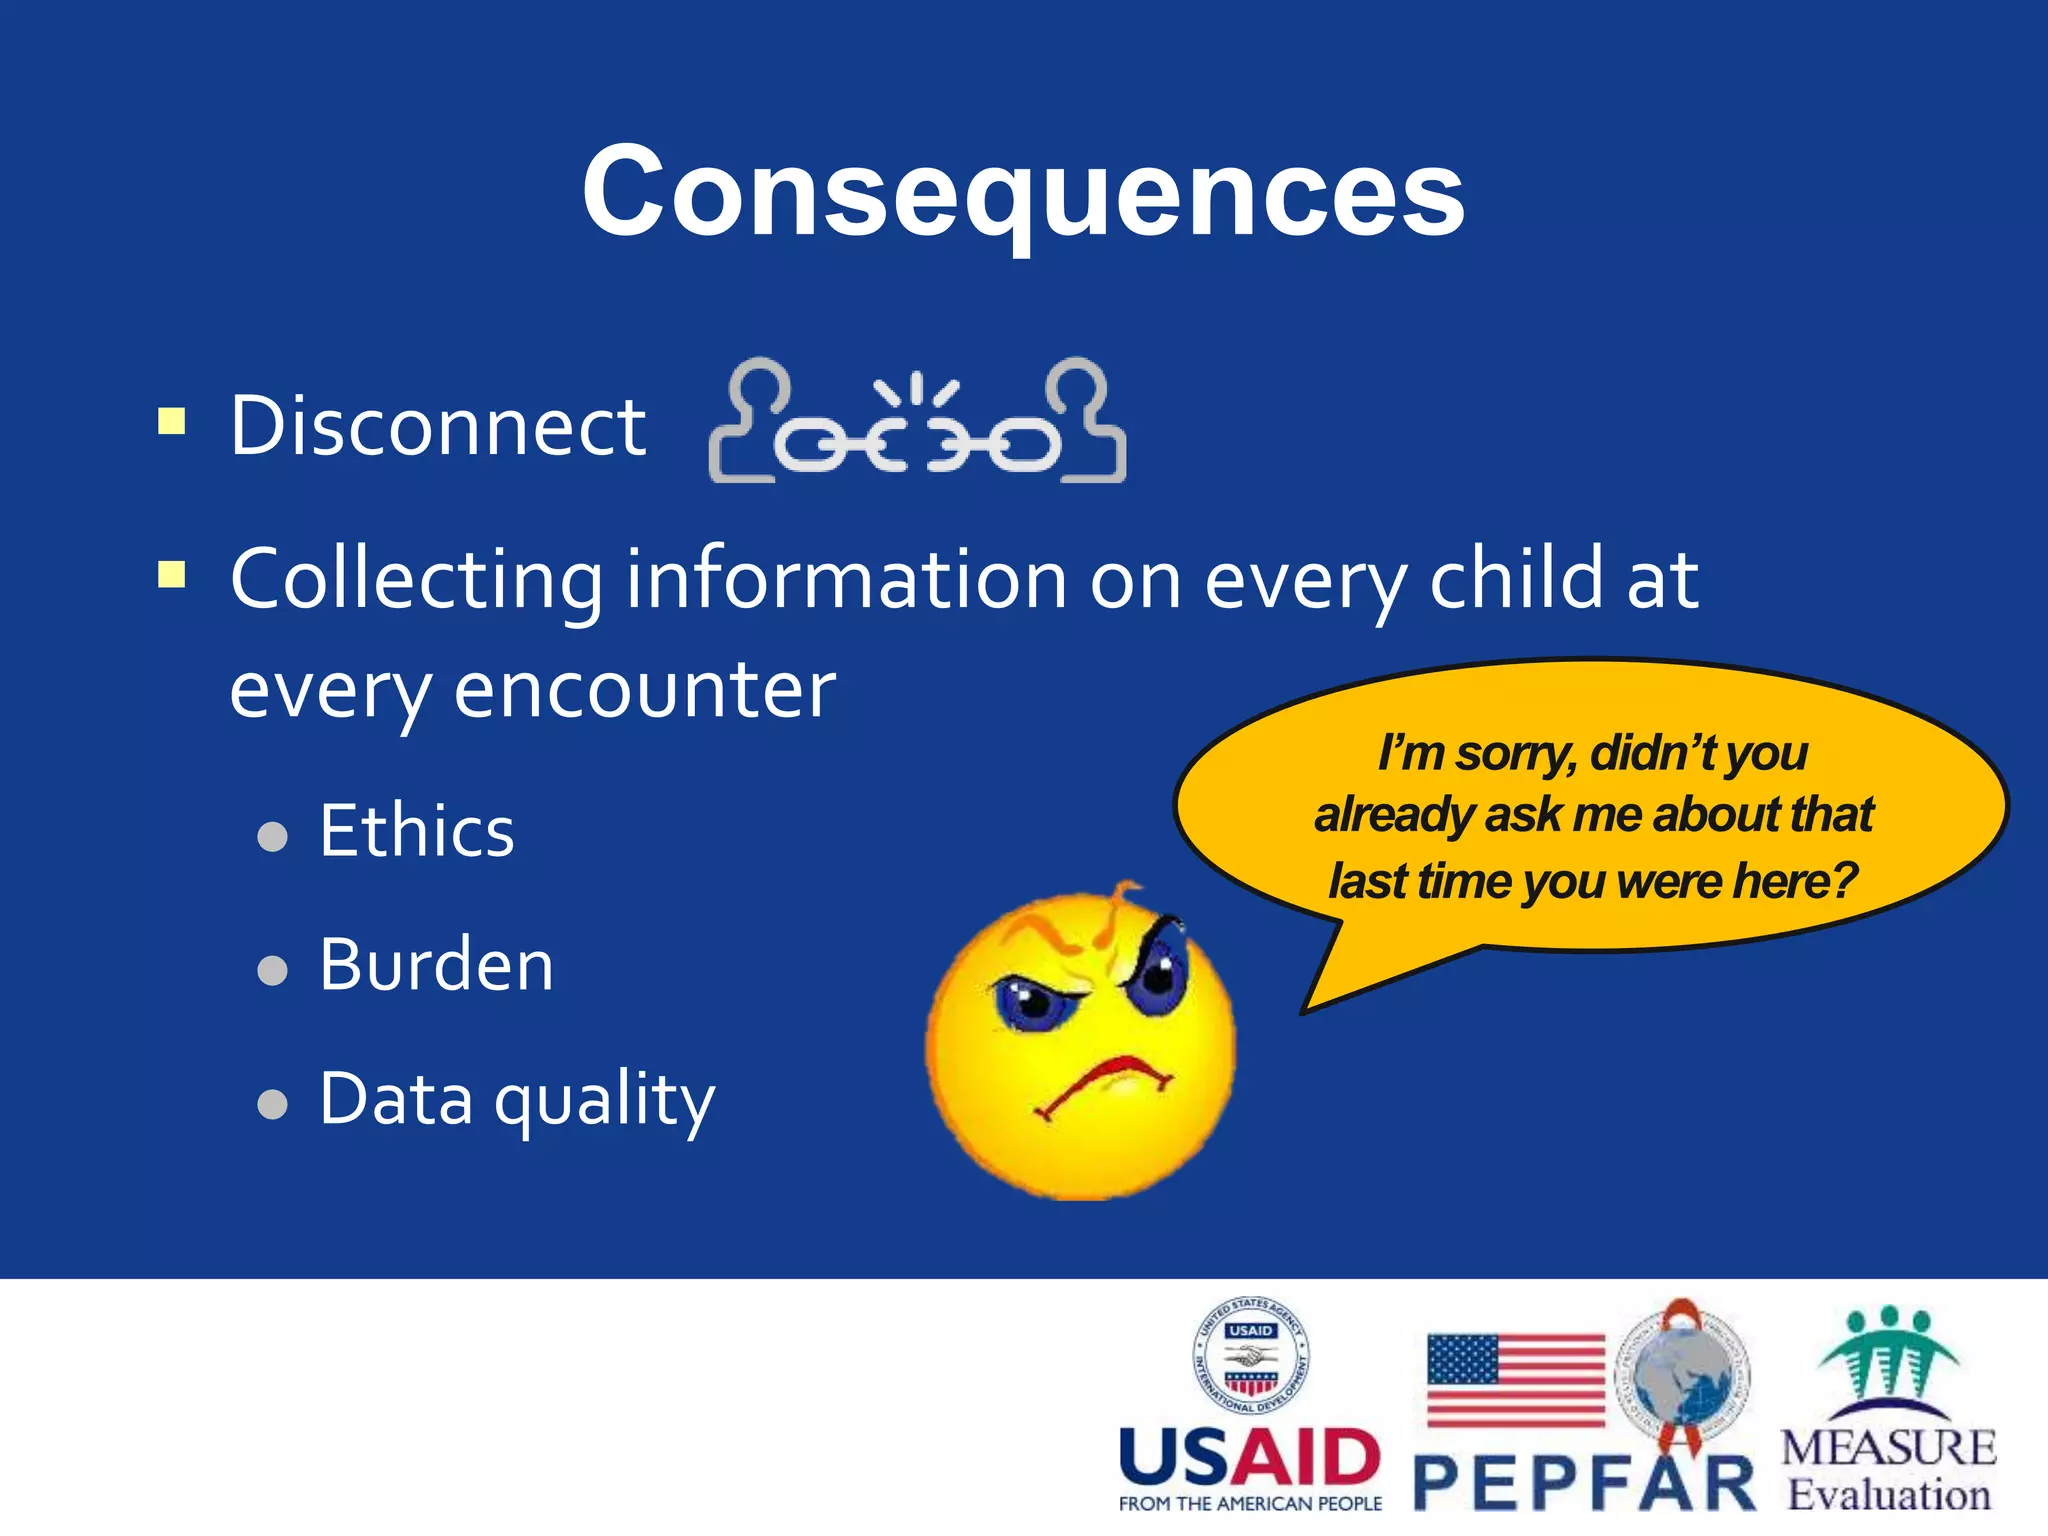
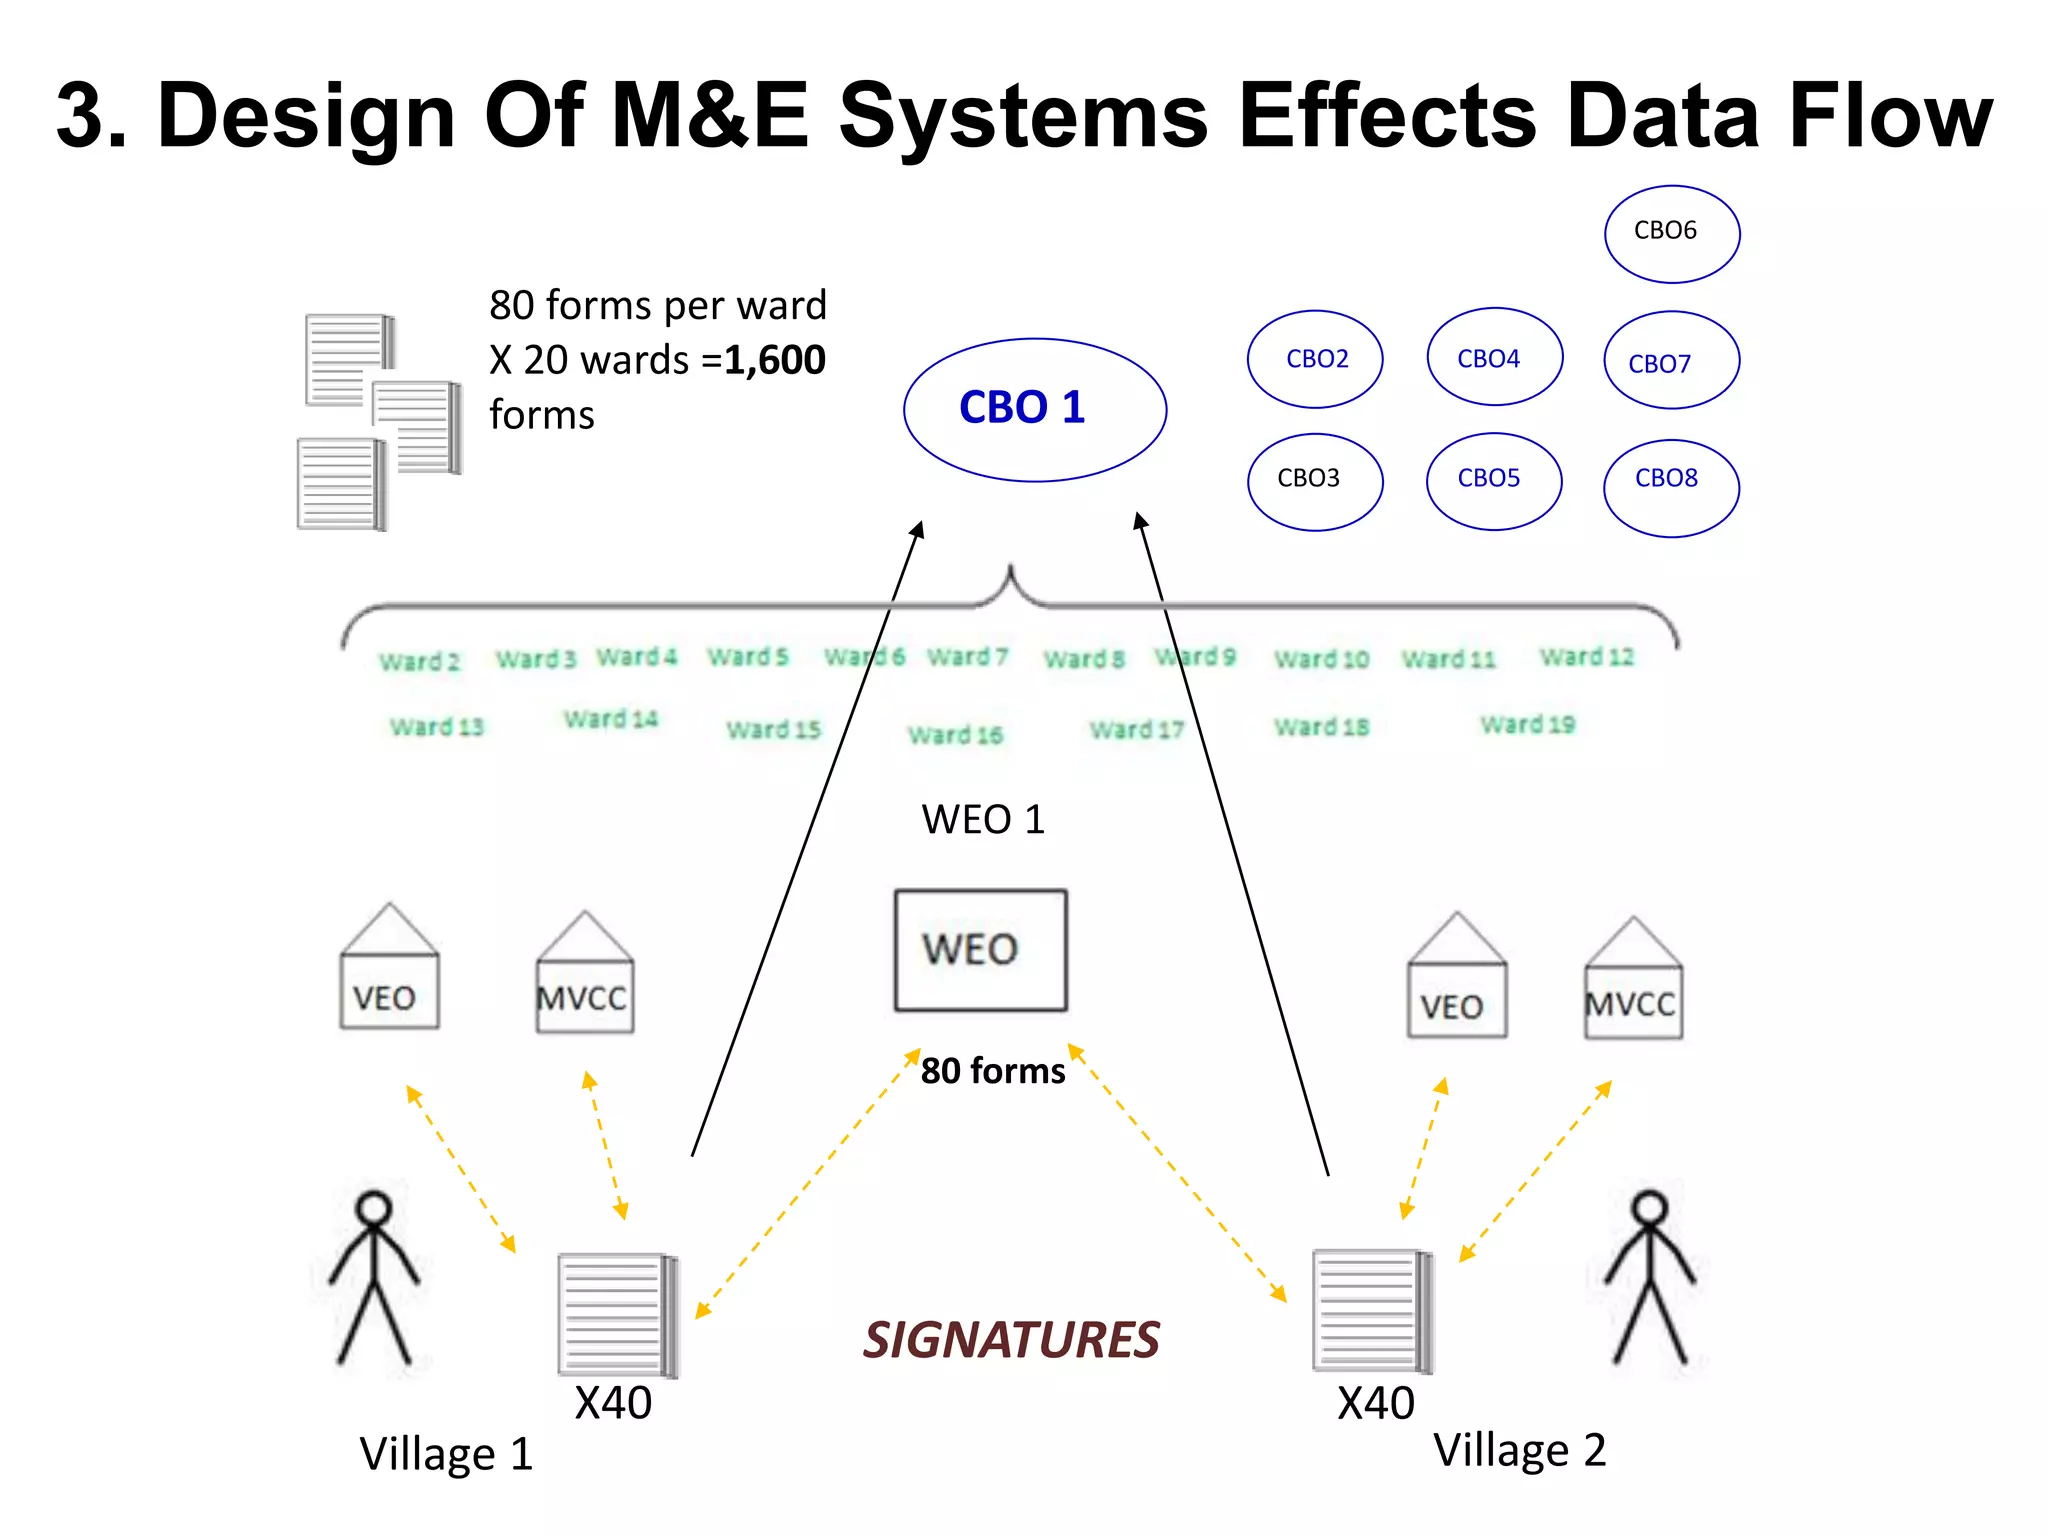
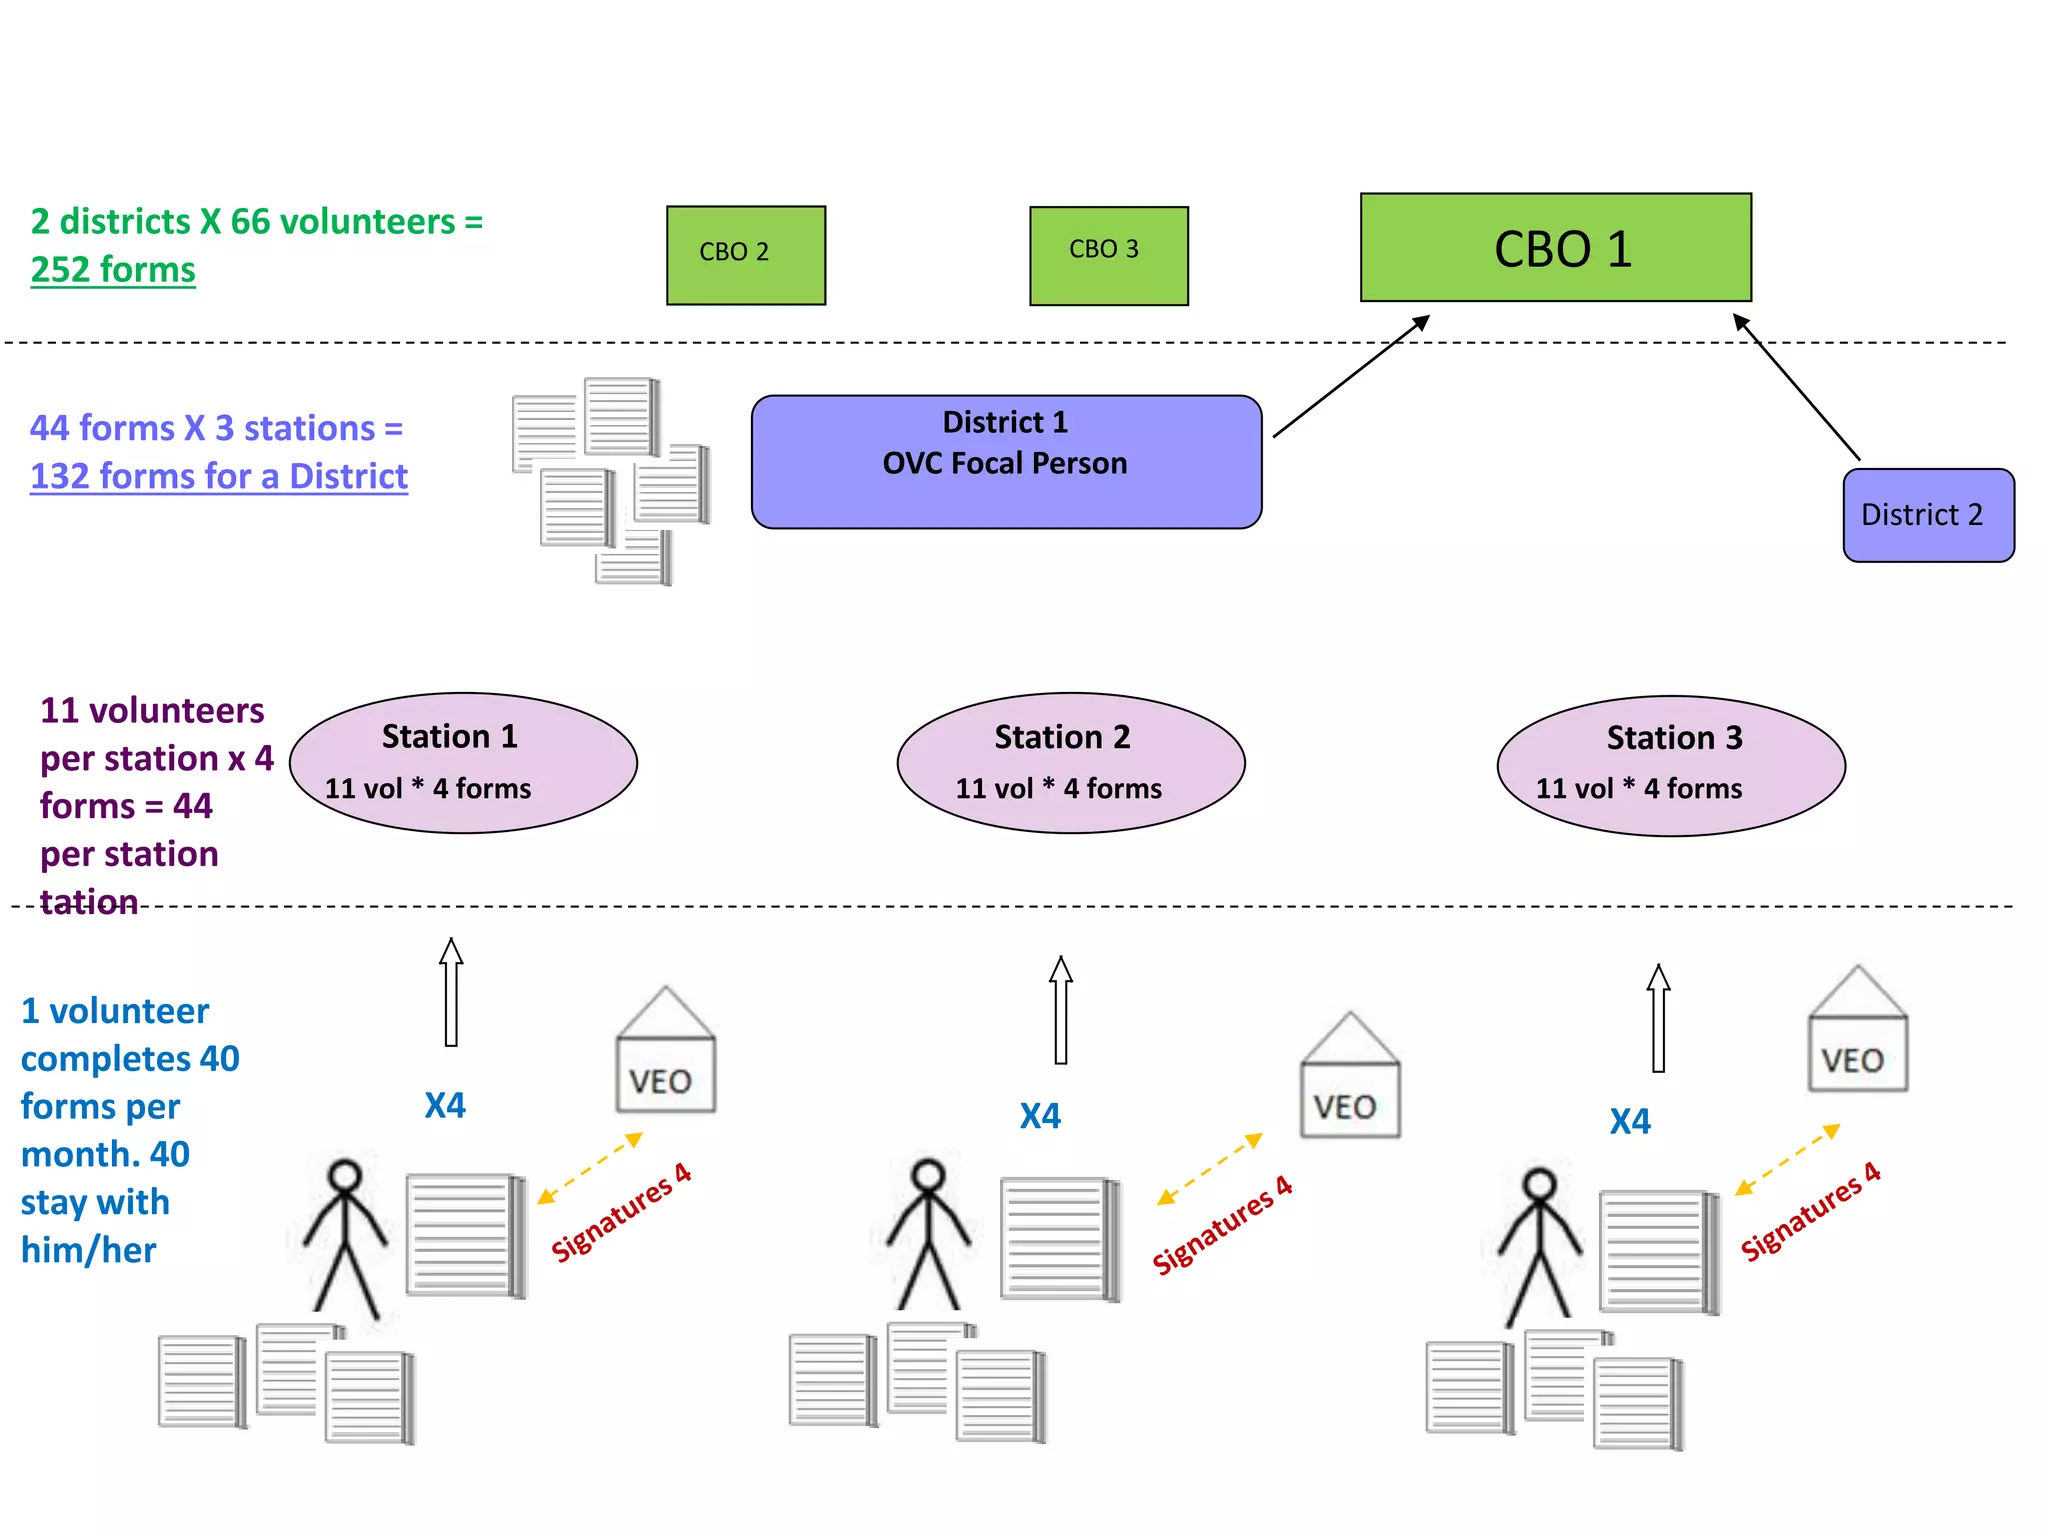
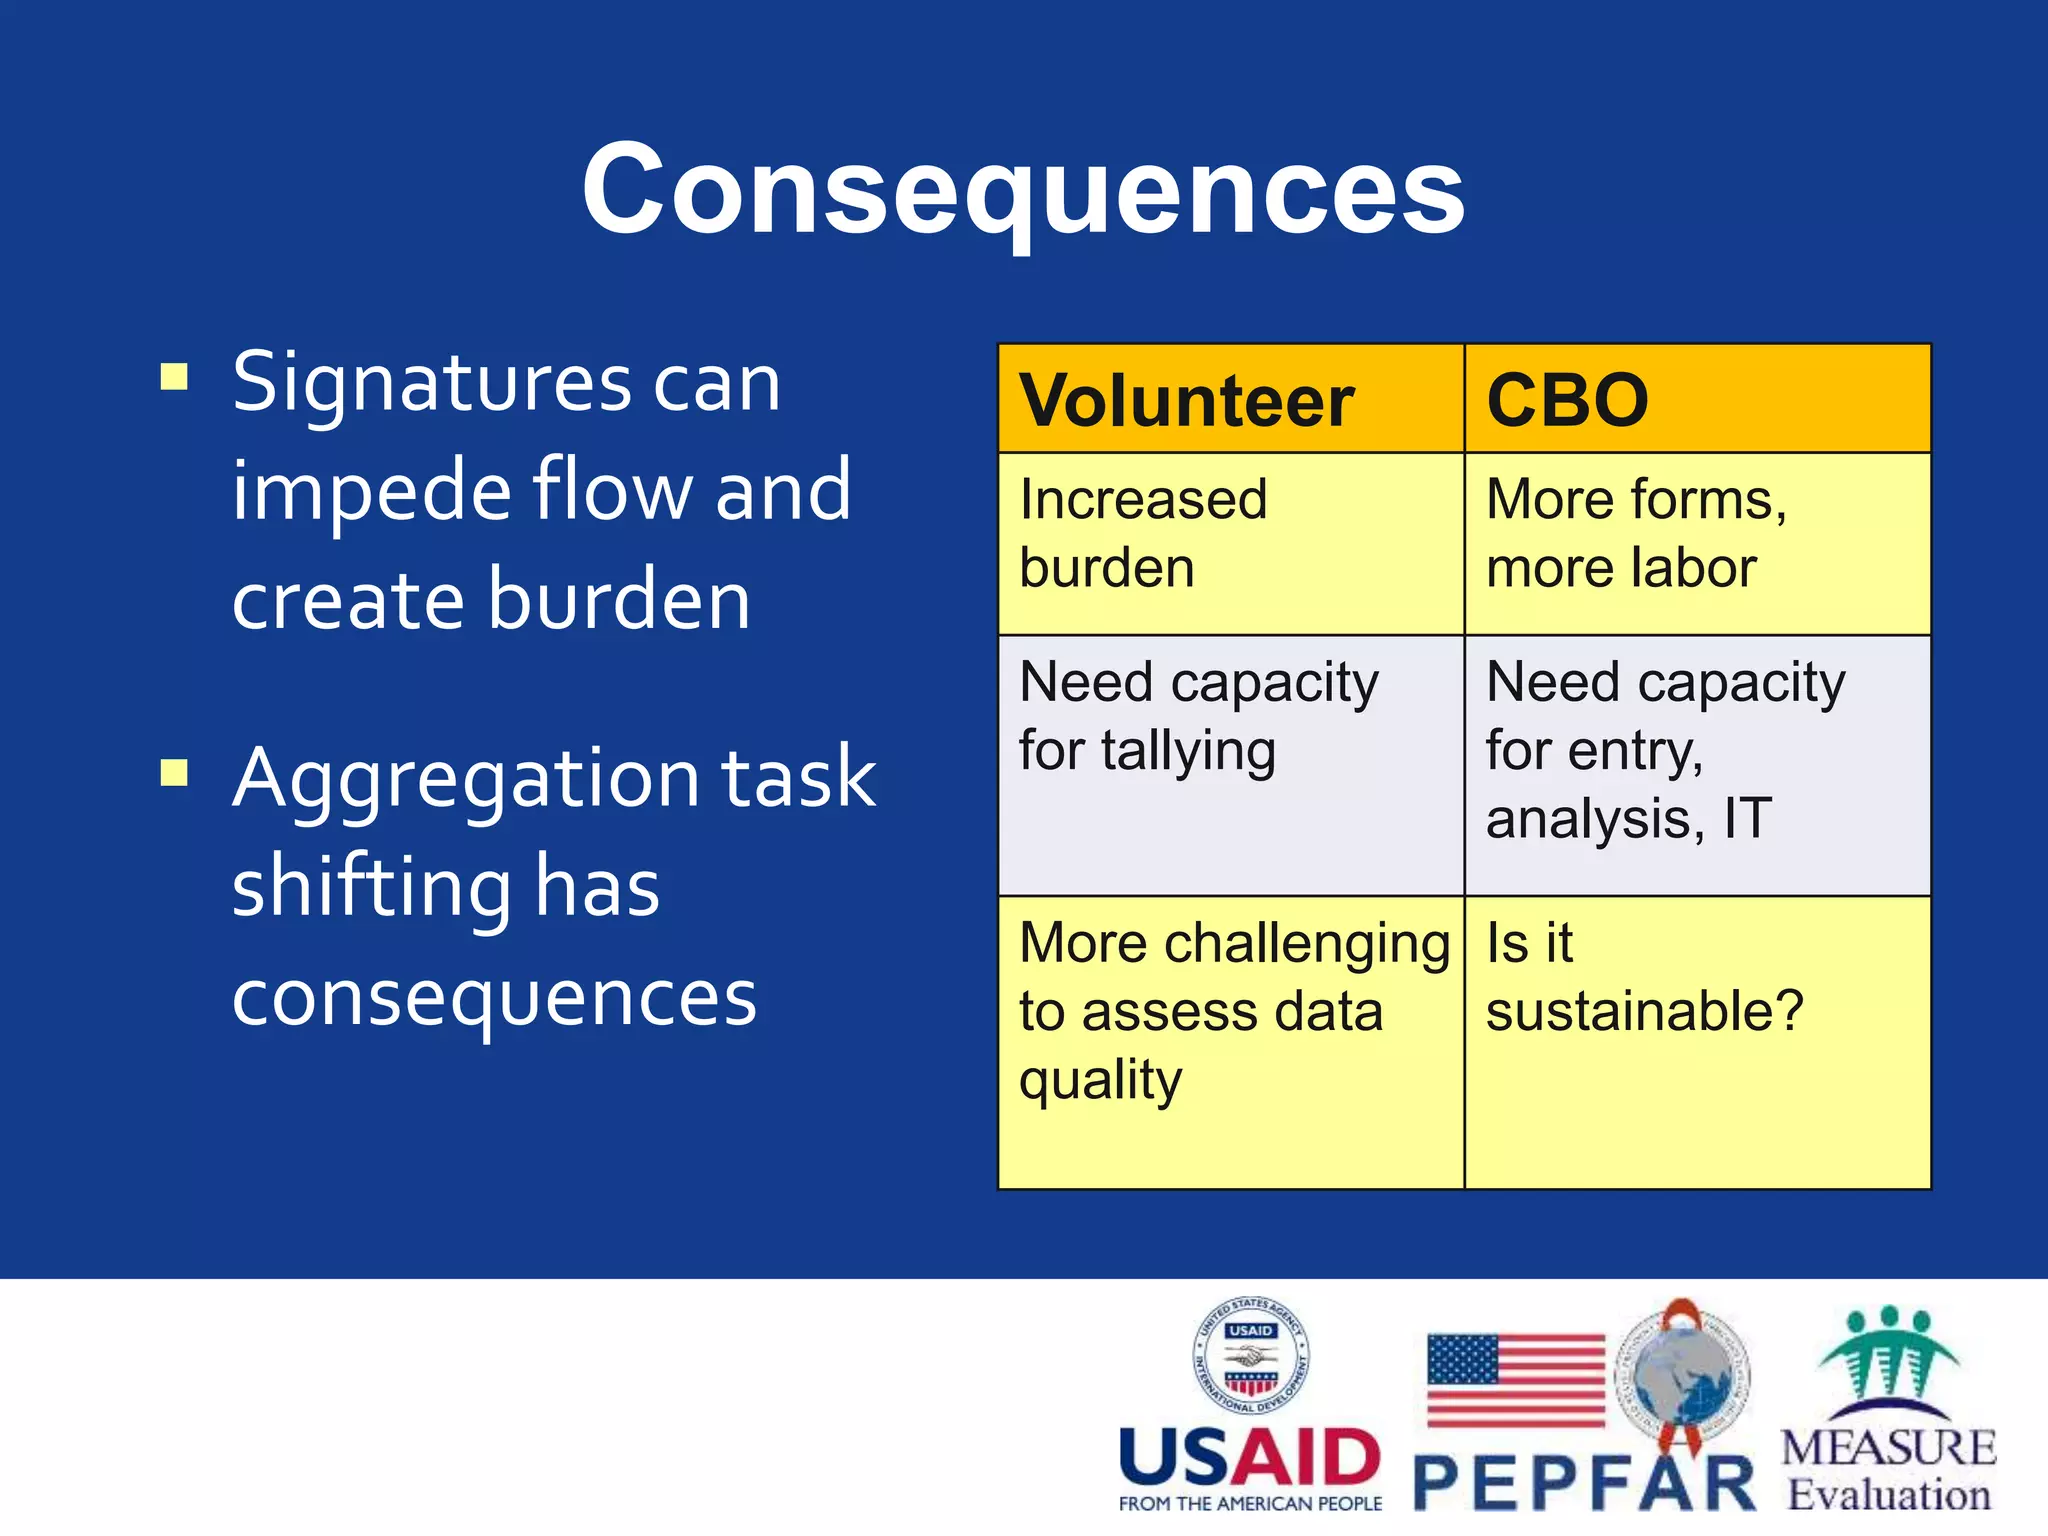
Building Information Systems
for Community Programs
Mary Freyder
Community Programs
 Definitions of community
 Geography, identity
 Setting, target, agent, resource
 Clinical and non-clinical health services
 Community actors – volunteers, civil society
orgs, government agencies
 Evidence-based impact – community
development, non-clinical services
MEASURE Evaluation Contributions
 M&E framework – Kenya
 Needs assessments – Kenya, Mozambique, Mali
 Case studies – Kenya, Tanzania, Zambia
 System design and training – Ethiopia, Kenya
 Data quality assessments– Tanzania, Rwanda
MEASURE Evaluation Contributions
 Indicator development
 Routine data quality assessment (RDQA) tool
 mhealth technologies for data quality improvement
 Child Status Index (CSI)
 Priorities for Local AIDS Control Efforts (PLACE)
 Survey tool for OVC programs
Lessons Learned
 Community volunteers and CBOs are collecting
and using data – Kenya dialogue days, local CBOs
serving vulnerable children
 Information systems often focus on reporting to
higher levels – not useful or sustainable at the
community level.
 M&E tools are only useful when they fit the
purpose – room for capacity building
Interventions for Empowering
Communities-Strengthening the
Community Health Information System
(CHIS) in Kenya
Edward Kunyanga
MEASURE Evaluation
End-of-Phase-III Event, May 22, 2014
Outline
 Background
 Overview of Community Health Strategy
(CHS) in Kenya
 Progress and outcomes in CHIS
strengthening
 Lessons Learned
Background
 Community Health Strategy (CHS) rolled out in
2006 as part of the National Health Sector
Strategic Plan (NHSSP II) 2005-2010
 NHSSP II refocuses national efforts on health
promotion of individuals and communities,
formally recognizing tier 1 services
 Tier 1 services are aimed at empowering
communities and households to take charge of
improving their health
Structure for Community Health
Service Delivery
Community Health Committee (CHC)
 Health activities taking place in the community
unit (CU) are coordinated
by the CHC:
 Dialogue days: key health indicators are reviewedin
orderto identify communityneedsto improvehealth
and developactions
 Actiondays: keyactions as determinedduring the
dialogue days are implemented
Typical Monthly CU Dialogue Day
 Improvingtheperformance(availability,access,qualityandutilization)ofCHISwill
beagradualprocess(lowliteracylevelsofCHWs,volunteerism,sizeofthe
coverage,stakeholderconsensusbuilding)
 Utilizationofover80%ofthecollectedcommunitydatainCUsdialogueandaction
dayshasimprovedhealthoutcomes
Objectives of CHIS Strengthening
 To strengthen CHIS in providing quality
data from tier 1 for use at both community
level and within the formal health sector
 Prepare CHIS for linkage with the unified
system for national health information
management (District Health Information
System – DHIS2)
CHIS Strengthening
Examples of CHIS Indicators
 # of deliveries by a skilled attendant
 # of pregnant mothers who attend at least
4 ANC visits
 # of children fully immunized
 # of fever cases managed
 # of case referred
 # of births, # of deaths by age
 # of diarrhea cases managed
Community Health Information System
(CHIS) – Assessment
 Case Study of the CHIS in 5 CUs conducted
in April 2011
 M&E capacity assessment of national CHS
M&E unit conducted in June 2013
 CHIS functionality assessment of 31
CUs conducted in July 2013
Findings
 CHISrequirescoordinatedstrengtheningeffortsaround
priorityareasin orderforittobea morecompleteand
functional systemservingbothcommunityand national-level
programmonitoring anddecisionmaking, asintended.(Case
Study, 2011)
 Capacity oftheM&E teamtoimplementCHIS requires
supportwithineachofthe12 componentsofafunctional
M&Esystemtoimprovethequality, technical, and financial
autonomy in implementingCHIS (M&ECBAssessment,2013)
CHIS Functionality Assessment
Key Finding: Only half of the CUs that
were sampled were fully functional as
per national guidelines.
Issues include:
 lack of infrastructure
 training gaps among CU staff
 poor reporting rates and data quality
Where Are We Now?
 Monitoring the collectionanduseofquality datain8CUsthat
havebeentargeted with apackageofinterventions todevelop
themas“Centers ofExcellence” forCHIS
 Currentreportingrates insupportedCUsreceiving apackage
ofinterventions hasincreasedfrom69%inJune,2013to100%
asofMarch2014
 New data collectiontoolshavebeenrolled-outtobetterfacilitate
thecollection, management, anduseofcommunityhealth data
 TheCHISM&Eteamisimplementing acapacitybuilding action
plan
 AnmHealthplatformhasbeendeveloped toincreasethe
collection ,quality, anduseofcommunityhealth data
 Structuredlearning visits have beenorganizedtosharelessons
andbestpractices inCHSprogramming.
Lessons Learned
1. System strengthening takes timeandlong-term commitment
andresourcesinordertoensureboth
successandsustainability
2. SuccessfulCHISstrengthening isreliant uponunderstanding
localdataneeds
3. Continuousengagement with DCHSiscritical incoordinatinga
countryownedprocessforsystem strengthening
4. Synergyamongallpartners isessential inordertoaddress allof
theneeds forstrengthening CHIS
5. Using CHWstoanswerdonor,national, andsubnational
questions abouthealth service delivery andoutcomesoften
over-burdensstaff,andresults inmissing reportsandpoor
quality data
Community Based Information Systems
Through an OVC Lens
Molly Cannon
End-of-Project Event
May 22, 2014
Volunteer
CBO
Types of OVC Information Gathered
Information Types Illustrative Tools
Situation Analysis PEPFAR OVC program evaluation tools
Targeting Nigeria’s Child Vulnerability Index, VAT, VI
Information to support
and monitor case
management
Child Status Index, Orphan Wellbeing Tool
Parenting Map, Child Support Index,
Household Assessment
Monitoring
Registration, Visitation/Service, Referral,
Training forms
Program Evaluation PEPFAR OVC program evaluation tools
MEASURE Evaluation Contributions
 Global Leadership
 National Systems
 Assessments
 Quantitative
 Qualitative
 Mixed Methods
MEASURE Evaluation Contributions
 Global Leadership
 National Systems
 Assessments
 Quantitative
 Qualitative
 Mixed Methods
MEASURE Evaluation Contributions
 Global Leadership
 National Systems
 Assessments
 Quantitative
 Qualitative
 Mixed Methods
MEASURE Evaluation Contributions
 Global Leadership
 National Systems
 Assessments
 Quantitative
 Qualitative
 Mixed Methods
OVC M&E Lessons Learned
1. Advances in OVC M&E systems
2. Data collection systems are organized for
reporting purposes
3. Design of M&E systems effects data flow
4. Ensure tools are fit for purpose
1. Advances in OVC M&E Systems
 Strong M&E systems
 Emphasis on data quality and availability
 Use of information for decision making
OVC Tools
Database
Canned Reports
Review Data
Queries
Framework for Decision Making
2. Data Collection Systems Are
Organized for Reporting Purposes
Consequences
 Disconnect
 Collecting information on every child at
every encounter
 Ethics
 Burden
 Data quality
I’m sorry, didn’tyou
already ask me about that
last time you were here?
3. Design Of M&E Systems Effects Data Flow
Village 1
X40
Village 2
X40
SIGNATURES
80 forms per ward
X 20 wards =1,600
forms
WEO 1
CBO2
CBO3
CBO4
CBO5
CBO6
CBO7
CBO8
80 forms
CBO 1
X4 X4 X4
Station 1 Station 2 Station 3
11 volunteers
per station x 4
forms = 44
per station
tation
11 vol * 4 forms
District 1
OVC Focal Person
CBO 1
44 forms X 3 stations =
132 forms for a District
2 districts X 66 volunteers =
252 forms
District 2
1 volunteer
completes 40
forms per
month. 40
stay with
him/her
CBO 2 CBO 3
11 vol * 4 forms 11 vol * 4 forms
Consequences
Volunteer CBO
Increased
burden
More forms,
more labor
Need capacity
for tallying
Need capacity
for entry,
analysis, IT
More challenging
to assess data
quality
Is it
sustainable?
 Signatures can
impede flow and
create burden
 Aggregation task
shifting has
consequences
4. Ensure Tools Are Fit for Purpose
 Consequence
 May make
decisions on
incorrect
information
The Way Forward
Prioritize information needs
Streamline guidance and tools
Ensureinformationsupportsvolunteers
Identify sustainable solutions
www.measureevaluation.org/eop

Building Information Systems for Community Programs

  • 1.
    Building Information Systems forCommunity Programs Mary Freyder
  • 2.
    Community Programs  Definitionsof community  Geography, identity  Setting, target, agent, resource  Clinical and non-clinical health services  Community actors – volunteers, civil society orgs, government agencies  Evidence-based impact – community development, non-clinical services
  • 3.
    MEASURE Evaluation Contributions M&E framework – Kenya  Needs assessments – Kenya, Mozambique, Mali  Case studies – Kenya, Tanzania, Zambia  System design and training – Ethiopia, Kenya  Data quality assessments– Tanzania, Rwanda
  • 4.
    MEASURE Evaluation Contributions Indicator development  Routine data quality assessment (RDQA) tool  mhealth technologies for data quality improvement  Child Status Index (CSI)  Priorities for Local AIDS Control Efforts (PLACE)  Survey tool for OVC programs
  • 5.
    Lessons Learned  Communityvolunteers and CBOs are collecting and using data – Kenya dialogue days, local CBOs serving vulnerable children  Information systems often focus on reporting to higher levels – not useful or sustainable at the community level.  M&E tools are only useful when they fit the purpose – room for capacity building
  • 6.
    Interventions for Empowering Communities-Strengtheningthe Community Health Information System (CHIS) in Kenya Edward Kunyanga MEASURE Evaluation End-of-Phase-III Event, May 22, 2014
  • 7.
    Outline  Background  Overviewof Community Health Strategy (CHS) in Kenya  Progress and outcomes in CHIS strengthening  Lessons Learned
  • 8.
    Background  Community HealthStrategy (CHS) rolled out in 2006 as part of the National Health Sector Strategic Plan (NHSSP II) 2005-2010  NHSSP II refocuses national efforts on health promotion of individuals and communities, formally recognizing tier 1 services  Tier 1 services are aimed at empowering communities and households to take charge of improving their health
  • 9.
    Structure for CommunityHealth Service Delivery
  • 10.
    Community Health Committee(CHC)  Health activities taking place in the community unit (CU) are coordinated by the CHC:  Dialogue days: key health indicators are reviewedin orderto identify communityneedsto improvehealth and developactions  Actiondays: keyactions as determinedduring the dialogue days are implemented
  • 11.
    Typical Monthly CUDialogue Day  Improvingtheperformance(availability,access,qualityandutilization)ofCHISwill beagradualprocess(lowliteracylevelsofCHWs,volunteerism,sizeofthe coverage,stakeholderconsensusbuilding)  Utilizationofover80%ofthecollectedcommunitydatainCUsdialogueandaction dayshasimprovedhealthoutcomes
  • 12.
    Objectives of CHISStrengthening  To strengthen CHIS in providing quality data from tier 1 for use at both community level and within the formal health sector  Prepare CHIS for linkage with the unified system for national health information management (District Health Information System – DHIS2)
  • 13.
  • 14.
    Examples of CHISIndicators  # of deliveries by a skilled attendant  # of pregnant mothers who attend at least 4 ANC visits  # of children fully immunized  # of fever cases managed  # of case referred  # of births, # of deaths by age  # of diarrhea cases managed
  • 15.
    Community Health InformationSystem (CHIS) – Assessment  Case Study of the CHIS in 5 CUs conducted in April 2011  M&E capacity assessment of national CHS M&E unit conducted in June 2013  CHIS functionality assessment of 31 CUs conducted in July 2013
  • 16.
    Findings  CHISrequirescoordinatedstrengtheningeffortsaround priorityareasin orderforittobeamorecompleteand functional systemservingbothcommunityand national-level programmonitoring anddecisionmaking, asintended.(Case Study, 2011)  Capacity oftheM&E teamtoimplementCHIS requires supportwithineachofthe12 componentsofafunctional M&Esystemtoimprovethequality, technical, and financial autonomy in implementingCHIS (M&ECBAssessment,2013)
  • 17.
    CHIS Functionality Assessment KeyFinding: Only half of the CUs that were sampled were fully functional as per national guidelines. Issues include:  lack of infrastructure  training gaps among CU staff  poor reporting rates and data quality
  • 18.
    Where Are WeNow?  Monitoring the collectionanduseofquality datain8CUsthat havebeentargeted with apackageofinterventions todevelop themas“Centers ofExcellence” forCHIS  Currentreportingrates insupportedCUsreceiving apackage ofinterventions hasincreasedfrom69%inJune,2013to100% asofMarch2014  New data collectiontoolshavebeenrolled-outtobetterfacilitate thecollection, management, anduseofcommunityhealth data  TheCHISM&Eteamisimplementing acapacitybuilding action plan  AnmHealthplatformhasbeendeveloped toincreasethe collection ,quality, anduseofcommunityhealth data  Structuredlearning visits have beenorganizedtosharelessons andbestpractices inCHSprogramming.
  • 19.
    Lessons Learned 1. Systemstrengthening takes timeandlong-term commitment andresourcesinordertoensureboth successandsustainability 2. SuccessfulCHISstrengthening isreliant uponunderstanding localdataneeds 3. Continuousengagement with DCHSiscritical incoordinatinga countryownedprocessforsystem strengthening 4. Synergyamongallpartners isessential inordertoaddress allof theneeds forstrengthening CHIS 5. Using CHWstoanswerdonor,national, andsubnational questions abouthealth service delivery andoutcomesoften over-burdensstaff,andresults inmissing reportsandpoor quality data
  • 20.
    Community Based InformationSystems Through an OVC Lens Molly Cannon End-of-Project Event May 22, 2014
  • 21.
  • 22.
    Types of OVCInformation Gathered Information Types Illustrative Tools Situation Analysis PEPFAR OVC program evaluation tools Targeting Nigeria’s Child Vulnerability Index, VAT, VI Information to support and monitor case management Child Status Index, Orphan Wellbeing Tool Parenting Map, Child Support Index, Household Assessment Monitoring Registration, Visitation/Service, Referral, Training forms Program Evaluation PEPFAR OVC program evaluation tools
  • 23.
    MEASURE Evaluation Contributions Global Leadership  National Systems  Assessments  Quantitative  Qualitative  Mixed Methods
  • 24.
    MEASURE Evaluation Contributions Global Leadership  National Systems  Assessments  Quantitative  Qualitative  Mixed Methods
  • 25.
    MEASURE Evaluation Contributions Global Leadership  National Systems  Assessments  Quantitative  Qualitative  Mixed Methods
  • 26.
    MEASURE Evaluation Contributions Global Leadership  National Systems  Assessments  Quantitative  Qualitative  Mixed Methods
  • 27.
    OVC M&E LessonsLearned 1. Advances in OVC M&E systems 2. Data collection systems are organized for reporting purposes 3. Design of M&E systems effects data flow 4. Ensure tools are fit for purpose
  • 28.
    1. Advances inOVC M&E Systems  Strong M&E systems  Emphasis on data quality and availability  Use of information for decision making
  • 31.
    OVC Tools Database Canned Reports ReviewData Queries Framework for Decision Making
  • 32.
    2. Data CollectionSystems Are Organized for Reporting Purposes
  • 33.
    Consequences  Disconnect  Collectinginformation on every child at every encounter  Ethics  Burden  Data quality I’m sorry, didn’tyou already ask me about that last time you were here?
  • 34.
    3. Design OfM&E Systems Effects Data Flow Village 1 X40 Village 2 X40 SIGNATURES 80 forms per ward X 20 wards =1,600 forms WEO 1 CBO2 CBO3 CBO4 CBO5 CBO6 CBO7 CBO8 80 forms CBO 1
  • 35.
    X4 X4 X4 Station1 Station 2 Station 3 11 volunteers per station x 4 forms = 44 per station tation 11 vol * 4 forms District 1 OVC Focal Person CBO 1 44 forms X 3 stations = 132 forms for a District 2 districts X 66 volunteers = 252 forms District 2 1 volunteer completes 40 forms per month. 40 stay with him/her CBO 2 CBO 3 11 vol * 4 forms 11 vol * 4 forms
  • 36.
    Consequences Volunteer CBO Increased burden More forms, morelabor Need capacity for tallying Need capacity for entry, analysis, IT More challenging to assess data quality Is it sustainable?  Signatures can impede flow and create burden  Aggregation task shifting has consequences
  • 37.
    4. Ensure ToolsAre Fit for Purpose  Consequence  May make decisions on incorrect information
  • 38.
    The Way Forward Prioritizeinformation needs Streamline guidance and tools Ensureinformationsupportsvolunteers Identify sustainable solutions
  • 39.