2. Timely, actionable information to power the core
of the hospital
Hospitals worldwide leverage Picis analytics and reporting solutions
to transform the business of perioperative care and improve clinical
documentation and financial and operational results. A compre-
hensive business intelligence environment is tantamount to arming
perioperative administrators and clinicians with timely information
and analysis to help them justify their decisions and make improve-
ments to operational performance and clinical quality, including:
• Operational reports for front-line staff to manage day-to-day
and week-to-week operations
• Graphical dashboards help clinicians and administrators
manage by exception by displaying real-time actionable
business intelligence
• Business intelligence helps managers understand trends and
root causes by drilling into the exceptions in the data
• Quality reporting for quality auditors to automatically mine
and aggregate patient charts for Meaningful Use, Surgical
Care Improvement Project (SCIP), Physician Quality Reporting
Initiative (PQRI) and other Joint Commission measures
3. Reporting as a change agent with the Intelligent
Perioperative Suite
Picis perioperative solutions collect volumes of rich, discrete
data almost every minute of every day across the continuum of
care. The challenge is to transform this plethora of data into the
business, operational and medical knowledge needed to help clini-
cians make the best strategic and operational decisions possible.
Timely, accurate and reliable analytics and reporting solutions
from Picis help hospitals and clinicians to improve care quality as
well as the efficiency of business operations.
Deliver high-value information via role-based
reporting
The diverse information needs of stakeholders throughout the
hospital require diverse views of shared information, and Picis
accomplishes this through powerful and flexible analysis and
reporting capabilities that allow organizations to tailor reporting
needs according to user roles.
While clinicians need fast access to clinical information, adminis-
trative users and analysts need the flexibility to analyze aggregate
information to identify trends and optimize operational efficiencies.
Understanding the information needs of these different user com-
munities is essential to delivering the reporting capabilities these
users need to perform their jobs well.
While all users need secure access to data stored in periopera-
tive applications, their information needs, skillsets and focus
areas vary dramatically. While an OR staff nurse may be focused
on what’s going on right now, the OR director must continuously
analyze the business aspects of the operating room, including
supply inventories, staffing and facility utilization. The chief of
anesthesia may need to track staff utilization and clinical quality,
and all department directors must carefully monitor daily reports
to ensure that all services and supplies are captured for accurate
billing purposes.
Business users require periodic reports to monitor the financial
health of the organization, document compliance, review quality
indicators and continuously optimize organizational efficiencies.
Quality officers must collect and review regulatory compliance
measures, combining them with those from the other departments
in the hospital. No hospital has the luxury of spending a significant
amount of time training users on multiple reporting tools so that
they can create custom reports.
Easy access to configurable reports
The traditional reliance on centralized IT for reporting often results
in delays and inefficiencies, and does not provide the timely
information needed at the point of care. Hospitals therefore need
out-of-the-box reports for front-line staff to manage operations, and
visual dashboards displaying relevant and timely patient informa-
tion. Hospitals also need business intelligence so managers can
understand trends and gain insights into root causes, and they
need the flexibility to query and aggregate patient charts to gener-
ate meaningful quality reports.
Role-based data access and analysis
Healthcare reporting is not just about presenting data and graphs;
it’s about providing high-value information to the right users based
on their roles in the organization to support informed decision-
making. Picis knows the business of the OR through experience
implementing OR solutions in more than 600 hospitals. With a
large team of clinicians providing peer-to-peer physician guidance,
Picis has developed documentation and quality reporting driven
from customer best practices.
4. Operational reporting
As the financial engine of the hospital — with over 50% of the margin and more than one
third of the hospital supply costs — the OR suite presents many unique opportunities to
streamline care delivery, reduce expenditures and help improve clinical outcomes. Clinicians
and business users need to be able to get information from perioperative software applica-
tions quickly — without requiring intensive training or technical assistance. Picis applica-
tions provide standard reports that can be run as needed, including:
But standard reports alone are not enough; hospitals also need the ability to create their
own reports. That’s why integrated support for SAP®
Crystal Reports®
is provided directly
from the Picis application menus.
In addition, point-and-click query tools embedded within Picis perioperative solutions allow
non-technical users to quickly create ad hoc reports and lists without having to learn how to
use a report writer. For example, nurses and physicians can create customized reports and
easily export data into off-the-shelf products, such as Microsoft®
Excel®
.
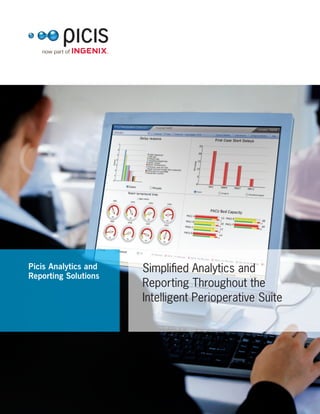
Manage by exception with business activity monitoring
Leveraging data across the Picis perioperative applications, Picis Perioperative Dashboard
offers visual indicators to quickly identify problems going on right now, the repercussions
of those problems and what can be done about them. The dashboard indicators cover key
aspects of perioperative management, including throughput, quality, documentation com-
pleteness, billing readiness and anesthesia concurrency, and the indicators also provide
more detailed “hover over” and drill-down information.
Leverage configurable views to improve communication among the perioperative
teams
With Picis Perioperative Dashboard, users can create a personal dashboard showing the
indicators they want to see, where they want to see them. As processes improve, users
can change the indicators they wish to see displayed, increasing visibility to the business
• Daily schedule
• Case record
• Medication reconciliation
• Scheduled pre-admission testing
exception report
• Cardiac and nausea risk assessment
compliance
• Preop work queue
• Anesthesia case time
• Anesthesia professional fee billing
report
• PACU returns to the OR
• Discharge disposition from PACU
• Critical care length of stay
• Patient transfer summary
• Discharge report
5. “With the Picis Perioperative
Dashboard, we have sustained
an increase in on-time first case
starts from 38% to 85% for 18
months. Our average turnaround
time has also decreased from
52 minutes to 42 minutes and
we have significantly improved
staff satisfaction.”
Janet Burke
OR systems manager
Lahey Clinic Medical Center
or quality measures under focus. Hospitals can also configure public dashboards on a big
screen to facilitate communication among perioperative teams.
Anticipate problems with visual indicators
The intuitive, web-based interface highlights outliers, allowing clinicians to manage by
exception. The system enables perioperative teams to anticipate the impact of problems as
they arise with visual indicators representing delays, add-on cases, PACU throughput, care
initiative compliance, billing readiness and other perioperative efficiency metrics.
Drill down for more detail
Users can click on an indicator to drill down for more detail. For example, a user can click
on the scrolling ticker to see the:
• Scheduled start time
• Actual start time
• Scheduled end time
• Projected actual end time
• Surgeon of the to-follow case
Easy to use, easy to deploy
Users access Picis Perioperative Dashboard through Microsoft Internet Explorer®
. Since
there is no client software, this web-native tool requires minimal IT resources, simplifying
usability while lowering its total cost of ownership.
Picis Perioperative Dashboard offers business activity monitoring in a visual dashboard display.
6. Retrospective analysis
Picis provides powerful, web-based analysis so that users can slice-and-dice perioperative data to
monitor key performance indicators, review variances, determine trends and evaluate everything from
physician performance to OR suite utilization.
Department heads can stop speculating and defend decisions with confidence and real numbers, and
leverage report libraries and integration with Microsoft Office. To avoid any performance impact on the live
system, the wealth of data is extracted nightly into a separate data mart that is optimized for analysis.
Picis Extelligence®
OR provides key per-
formance indicators for the surgical encoun-
ter. Perioperative service directors and
others can view the truth about OR block
utilization; case costs and times; the impact
of surgeons, services and procedures; and
stock items and implants. Dynamic drilling
and filtering let OR leadership see what’s
going on behind the numbers. Cross-facility
analysis is built-in, so users can benchmark
and monitor the business performance of
different sites.
It is easy to identify good practice and
areas of potential improvement through the
richness of the Picis OR Manager data. The
Extelligence OR report library assists users
in improving efficiency by analyzing block utilization, case costs, surgeon and room utilization, and
implants, while also providing access to all the user-defined booking and case record fields.
Picis Extelligence®
Anesthesia provides key performance and quality indicators specifically for the
anesthesia environment. Anesthesia chiefs and business managers can:
• Track perioperative quality indicators
• Investigate relationships within physiological data
• Analyze productivity and supervision of anesthesia providers
• Evaluate anesthesia case throughput
The Extelligence Anesthesia report library allows hospitals to conduct a complete analysis of anesthesia
milestones, medications and fluids, complications, physiologic data, billable hours, supervisory ratios
and productivity.
Extelligence OR offers case cost reporting in both tabular and graphical formats.
7. Regulatory compliance and meaningful use
reporting
The Picis Quality Reporting Portal automatically collects
data from Picis perioperative solutions and provides out of
the box reports of quality measures for government and
other regulatory agencies.
Reports are generated in a Microsoft Excel format, allow-
ing the quality auditor or other hospital staff to merge
Picis data with that from other departments, or to upload
the data into a hospital-wide quality reporting system for
submission. Current documentation practices are easily
mapped to the quality measures, eliminating the burden-
some and labor-intensive collection and aggregation of
perioperative data. Hospitals can easily demonstrate com-
pliance with meaningful use and other regulatory reporting
requirements to optimize hospital reimbursement.
Gain analysis and insight from the Intelligent Perioperative Suite
Picis provides the full continuum of operational reporting, real-time business activity moni-
toring, retrospective analytics and regulatory reporting needed to power the core of the
hospital. These integrated views of information and rigorous analysis capabilities are specifi-
cally tailored to the unique needs of various user roles within the hospital to enable greater
efficiency.
Implementing a comprehensive business intelligence environment combined with timely
access to relevant information about what happened yesterday, what’s going on right now
and what is planned for next week helps organizations improve perioperative care and
achieve operational and financial results to improve the future health of the hospital.
“The biggest benefit of using Extelligence
OR has been the user-friendly reporting
capability that allows the end users to be
able to manipulate the reports on their own
to get their data. This has decreased the
number of requests to our team.”
Debbie Schem
manager, perioperative information systems & billing
New York Hospital Queens
The Quality Reporting Portal provides out of the box perioperative
regulatory reporting.