Downloaded 193 times
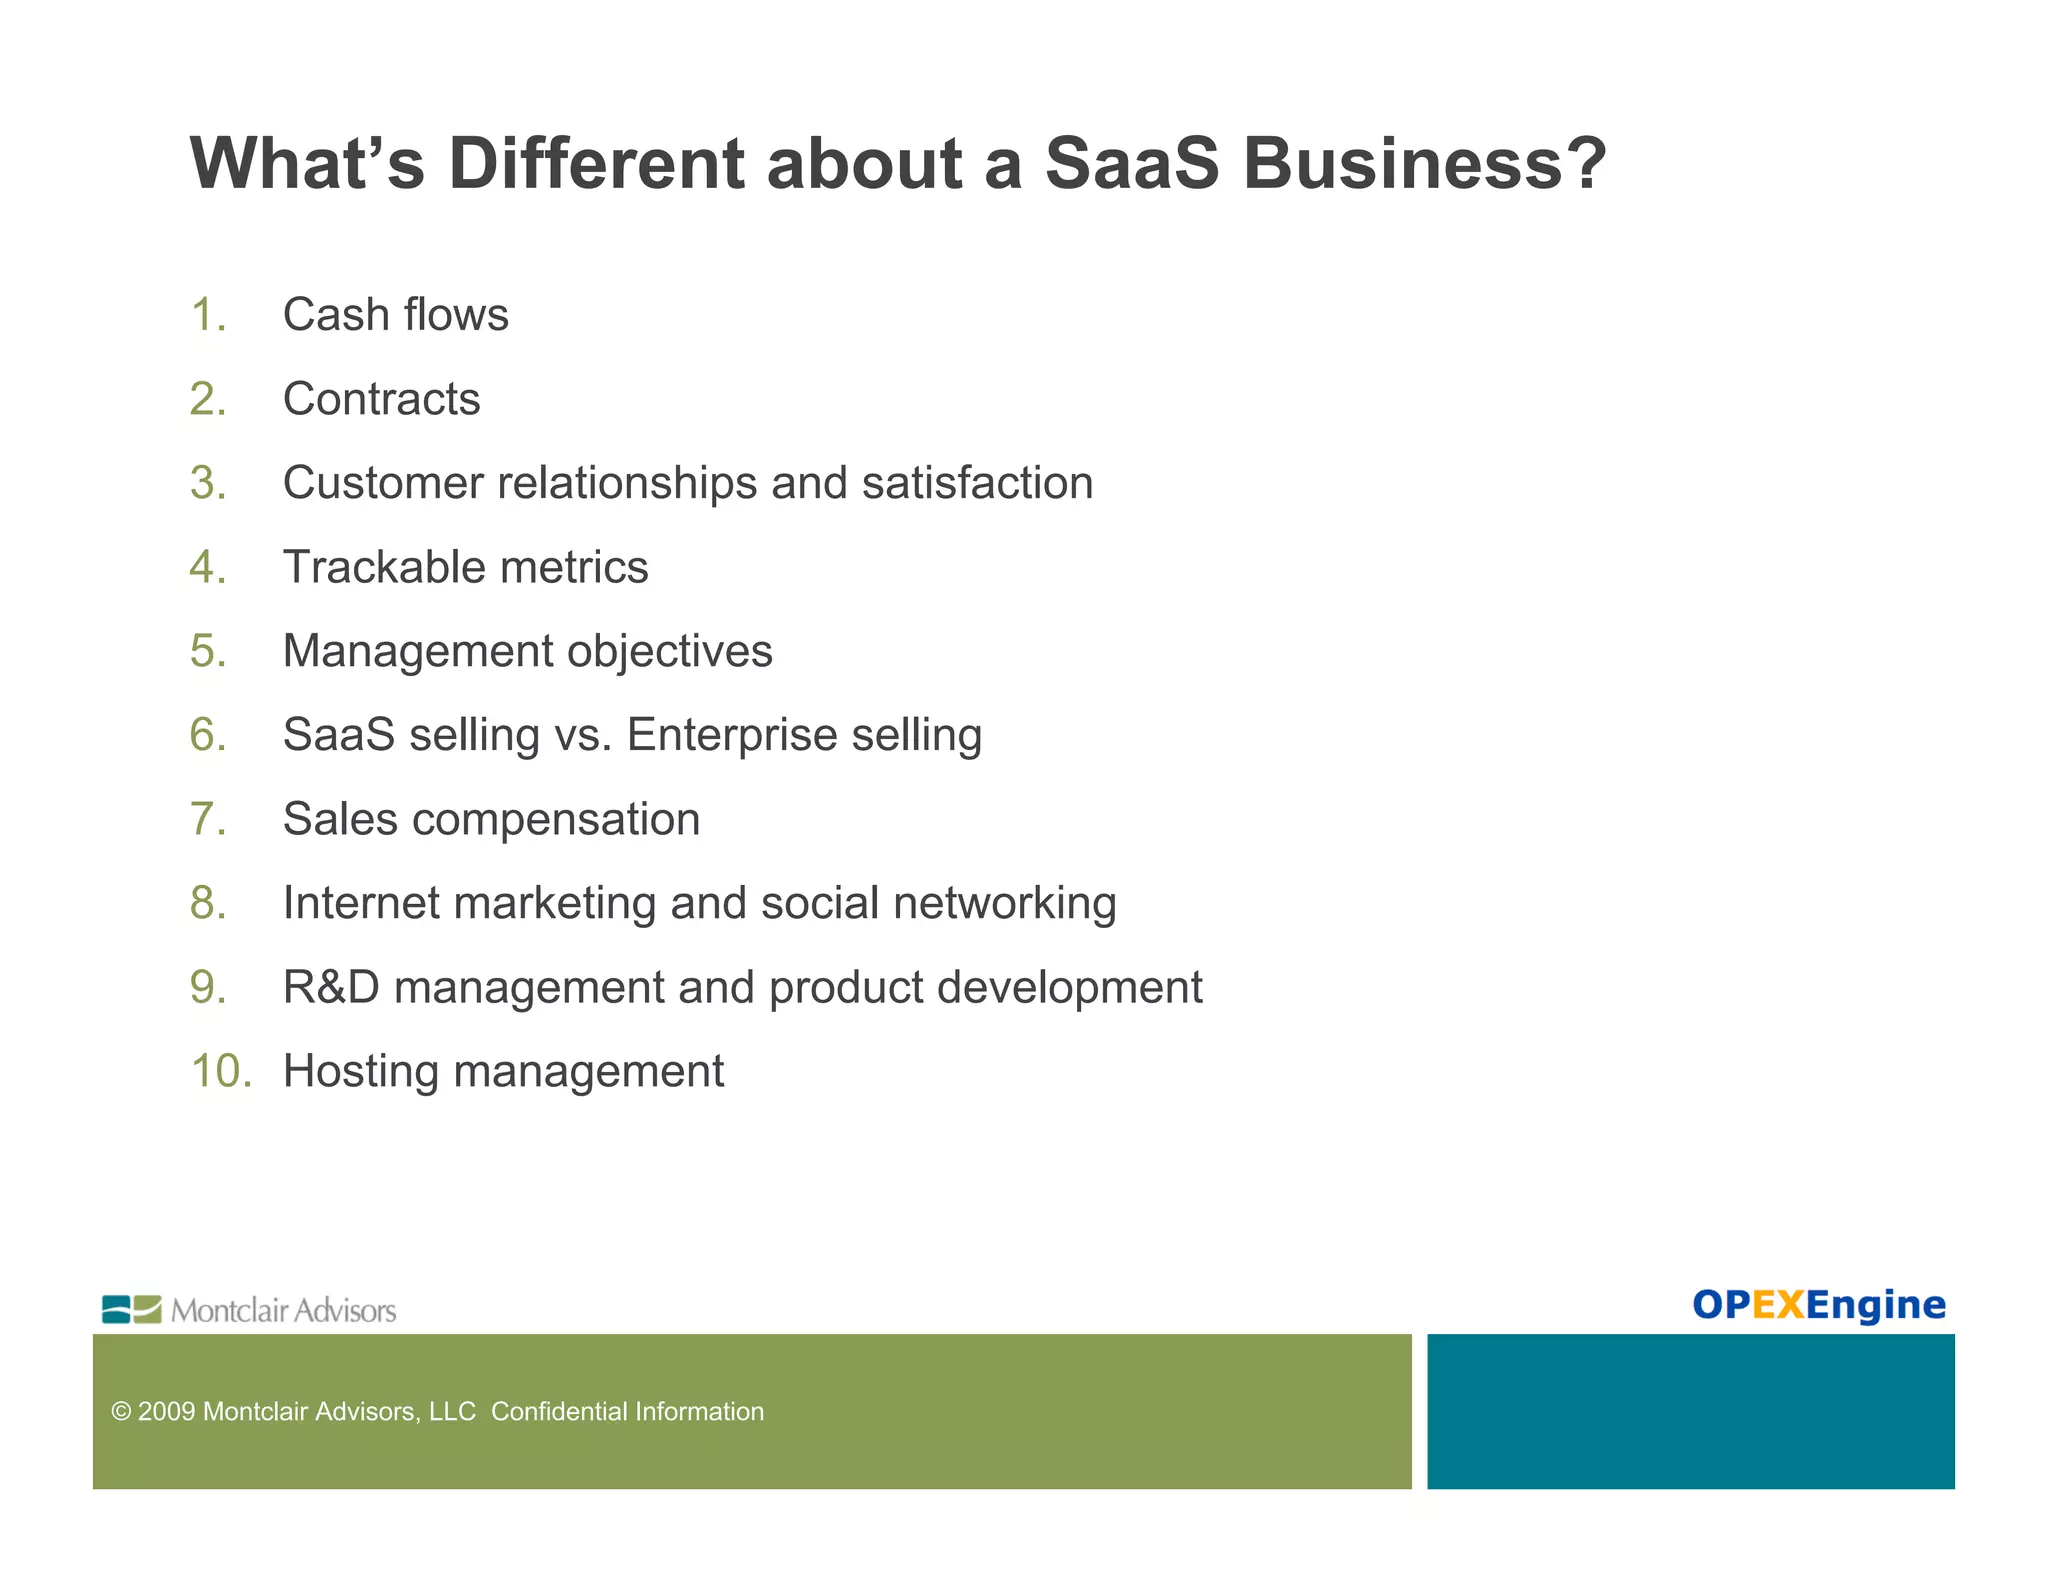
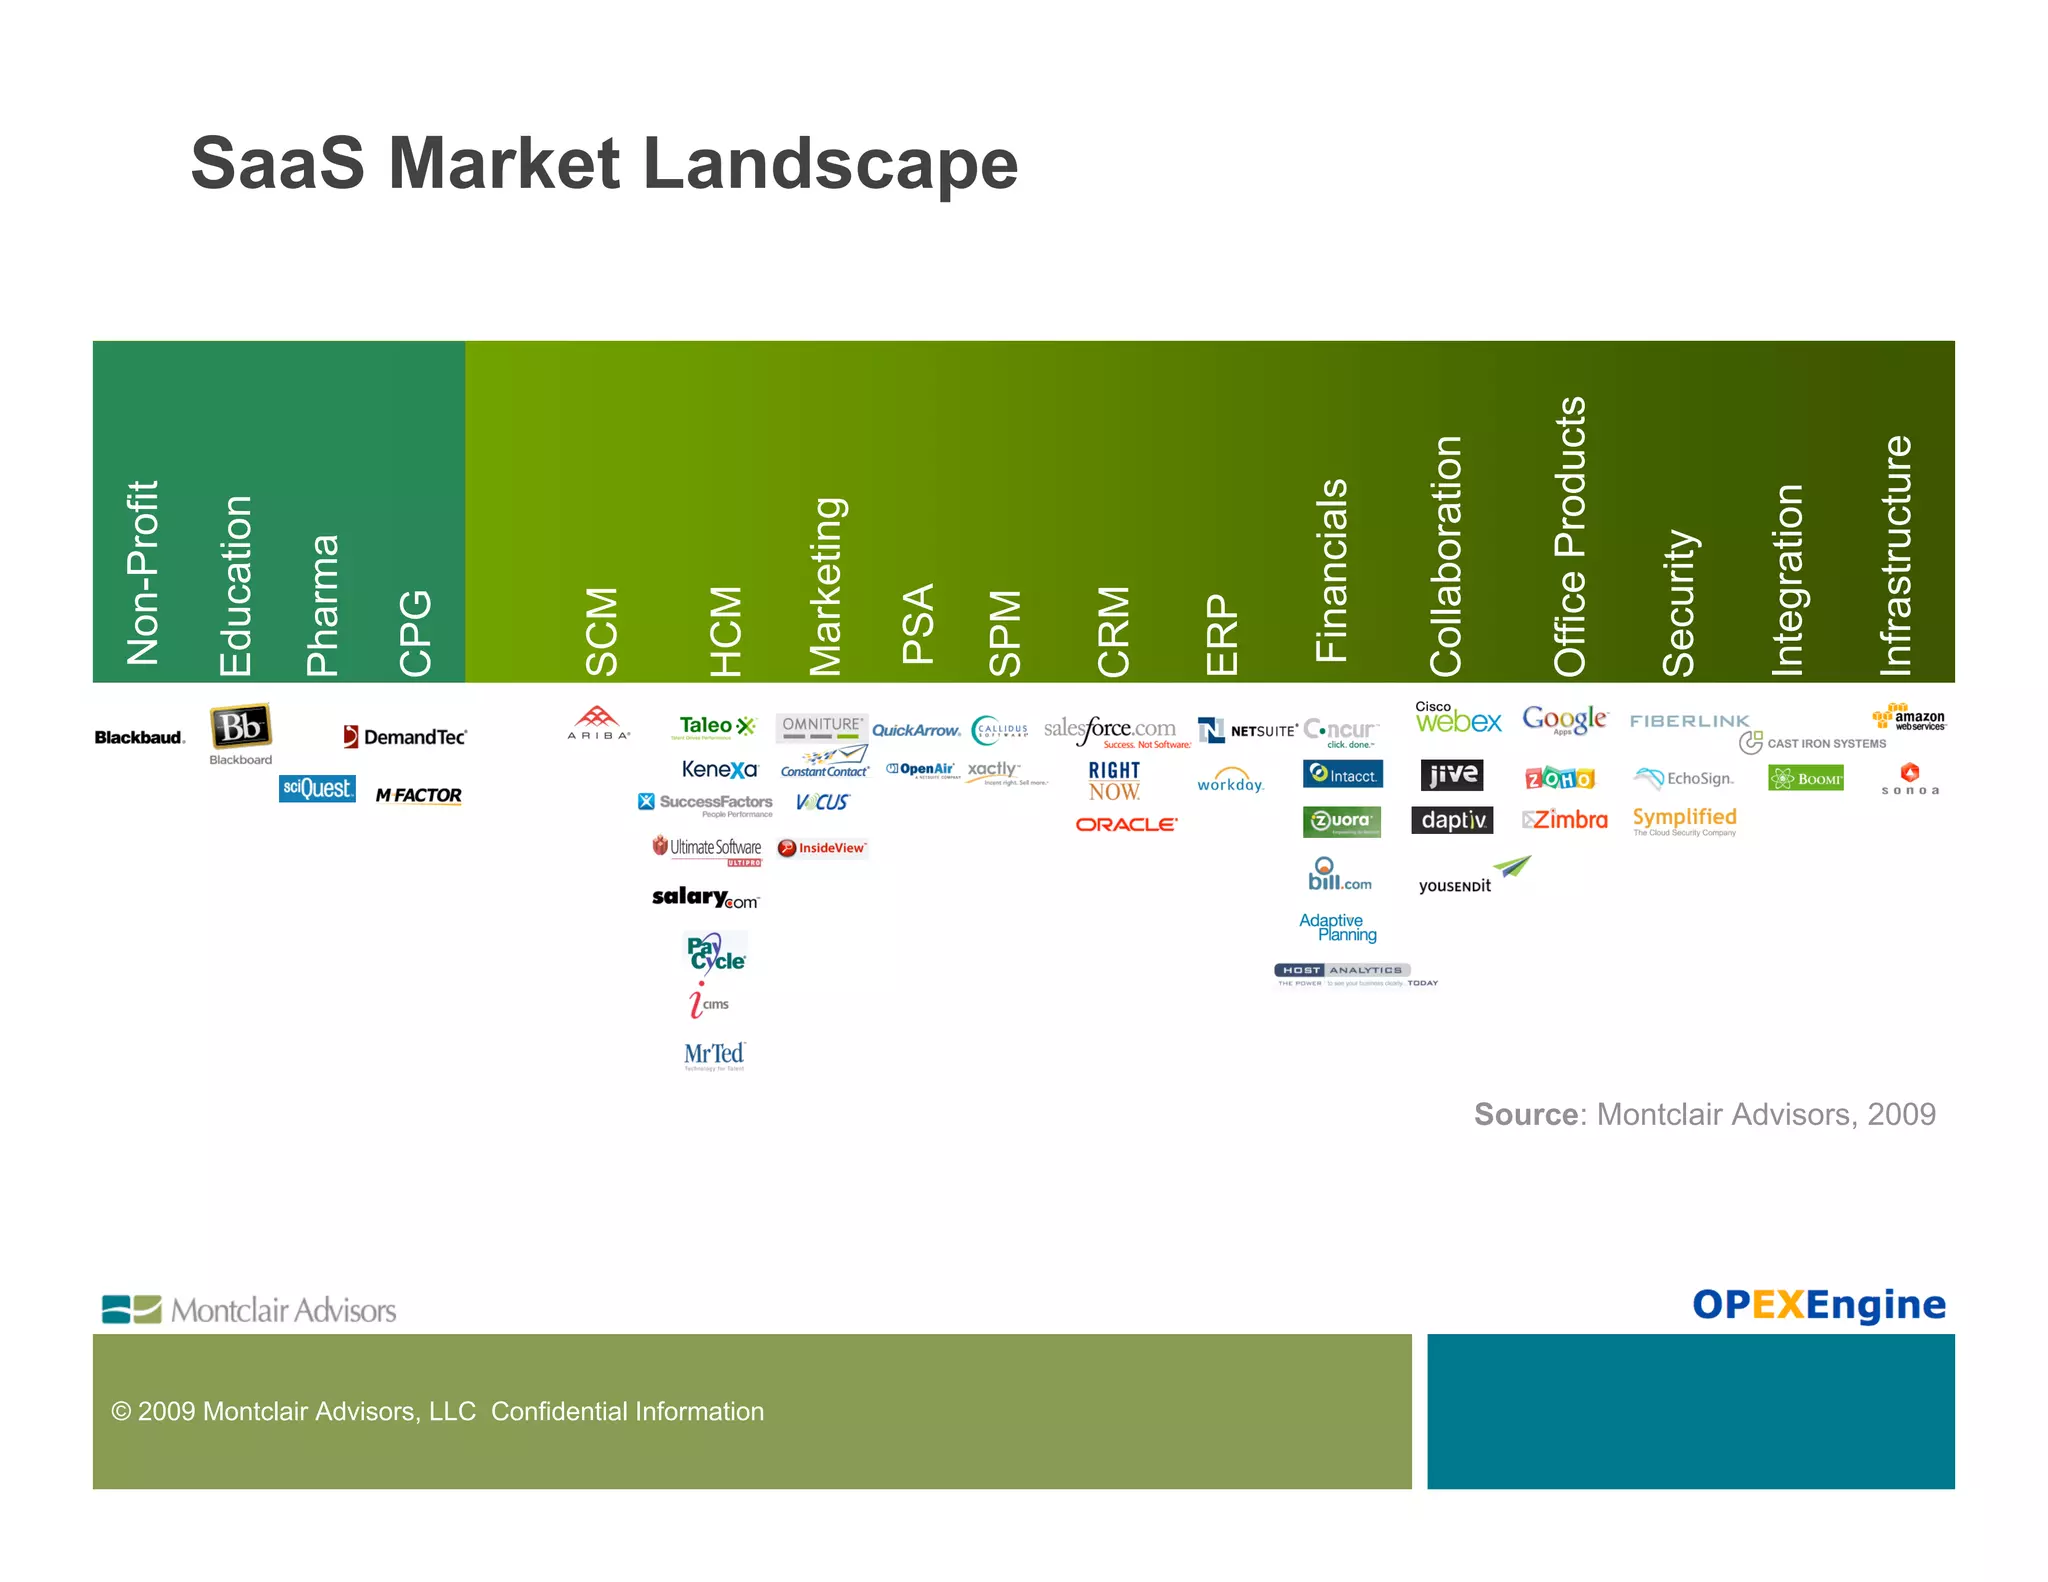
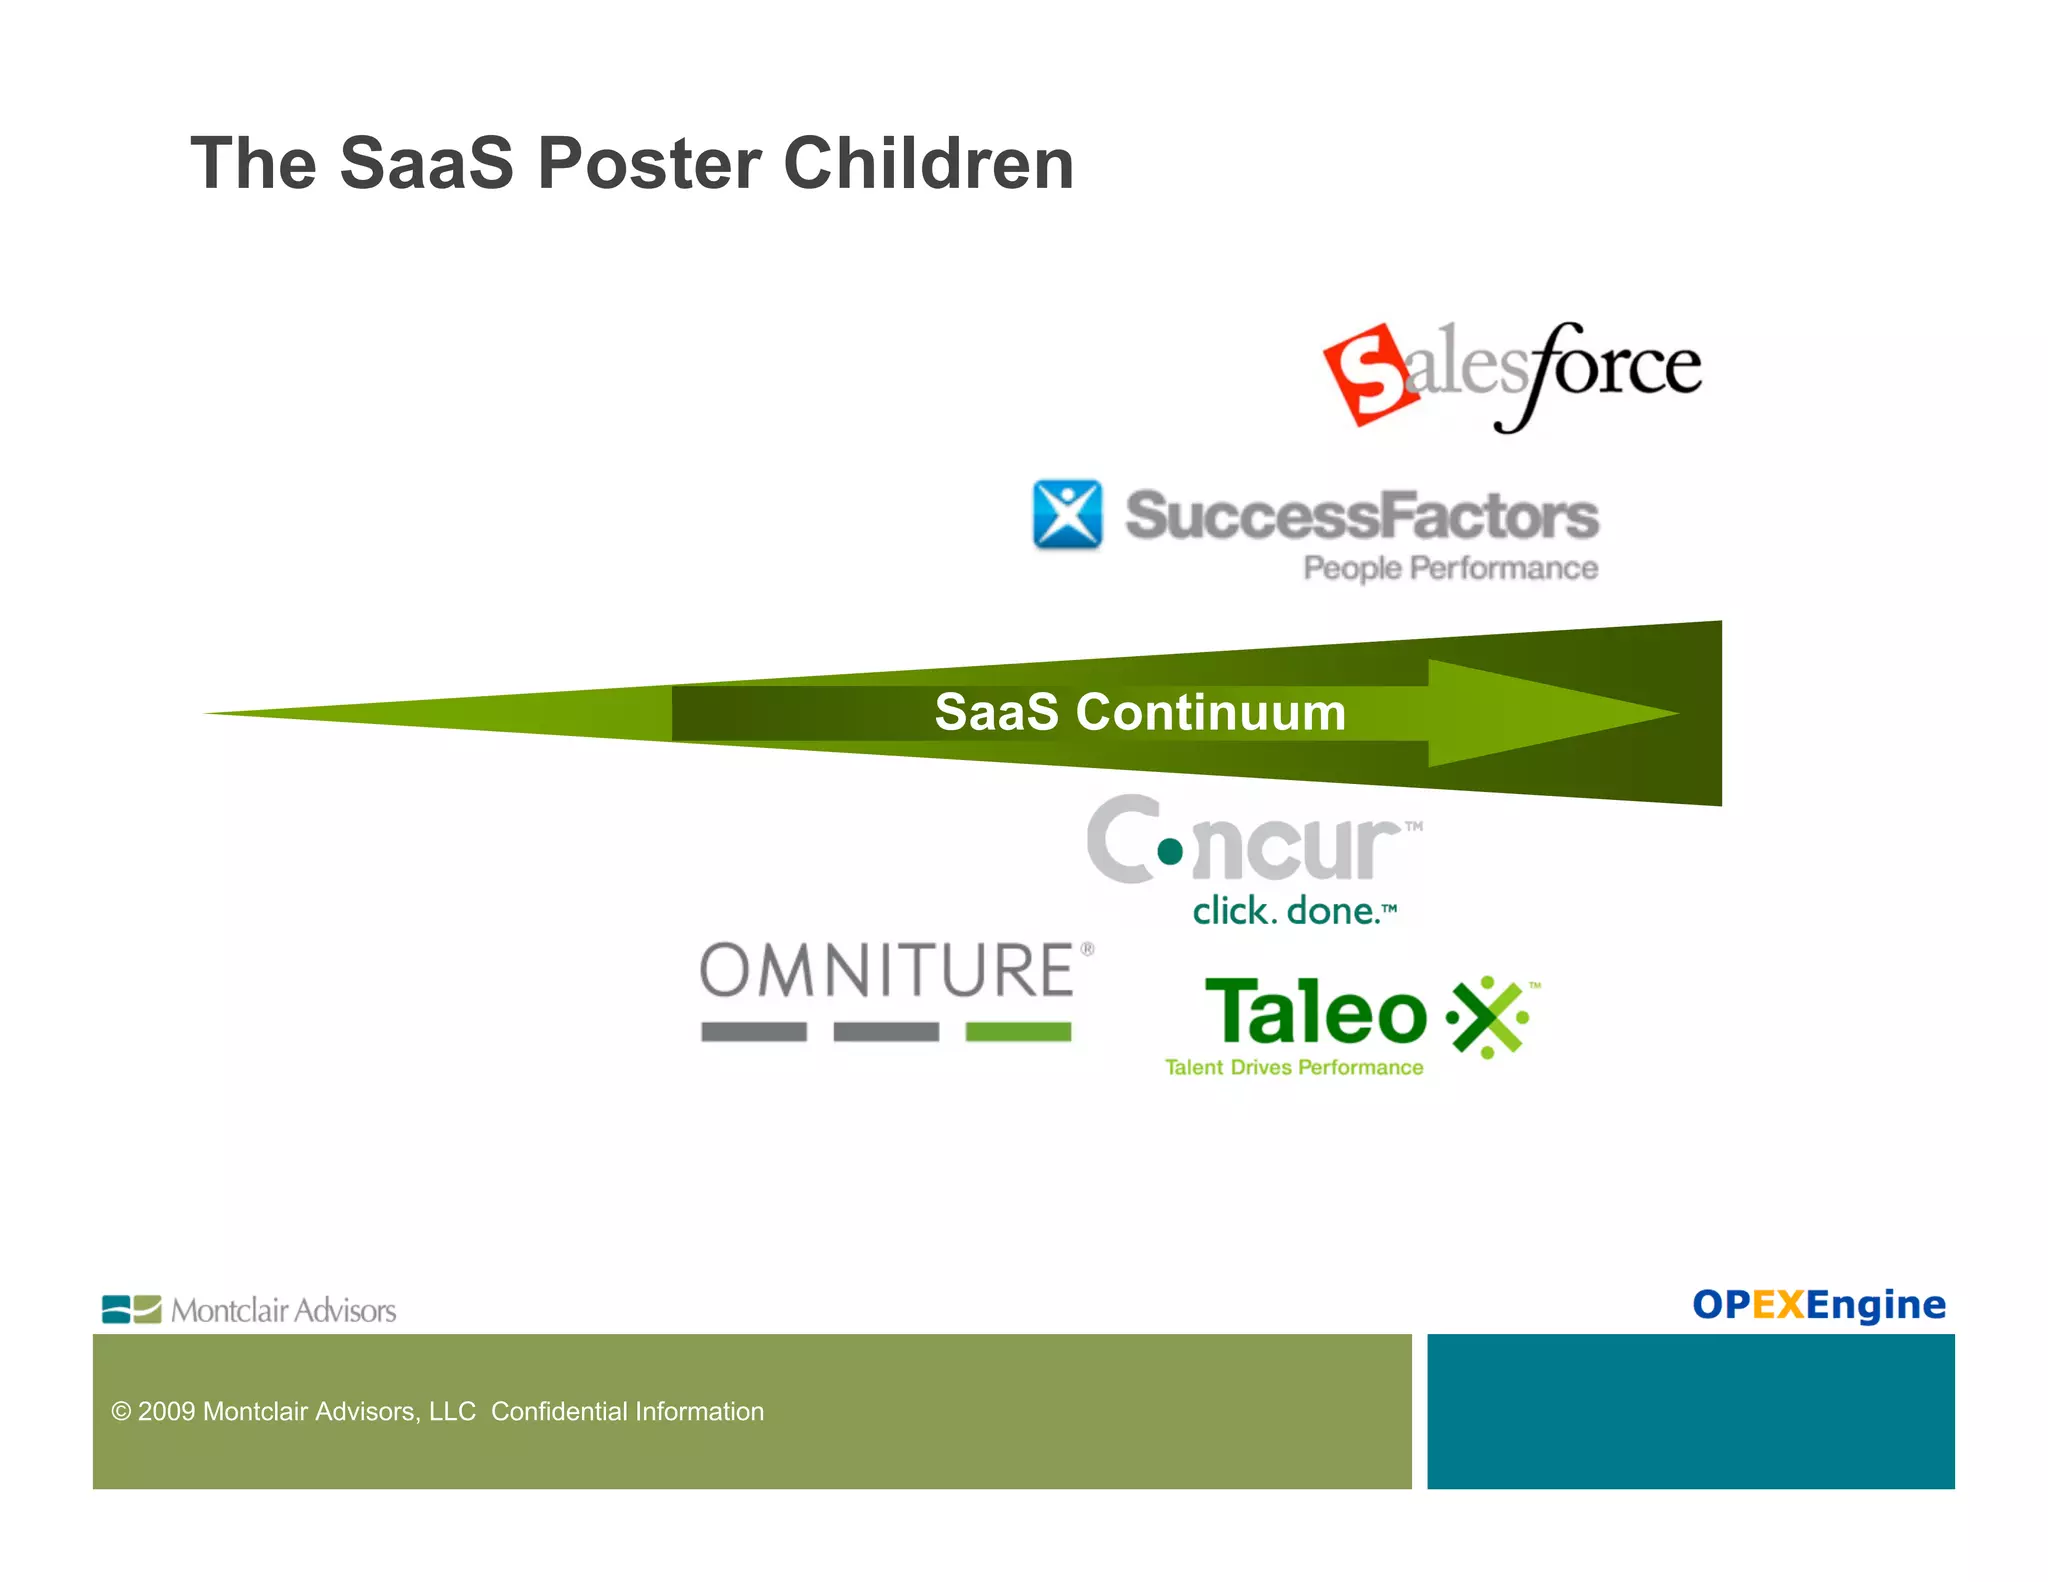
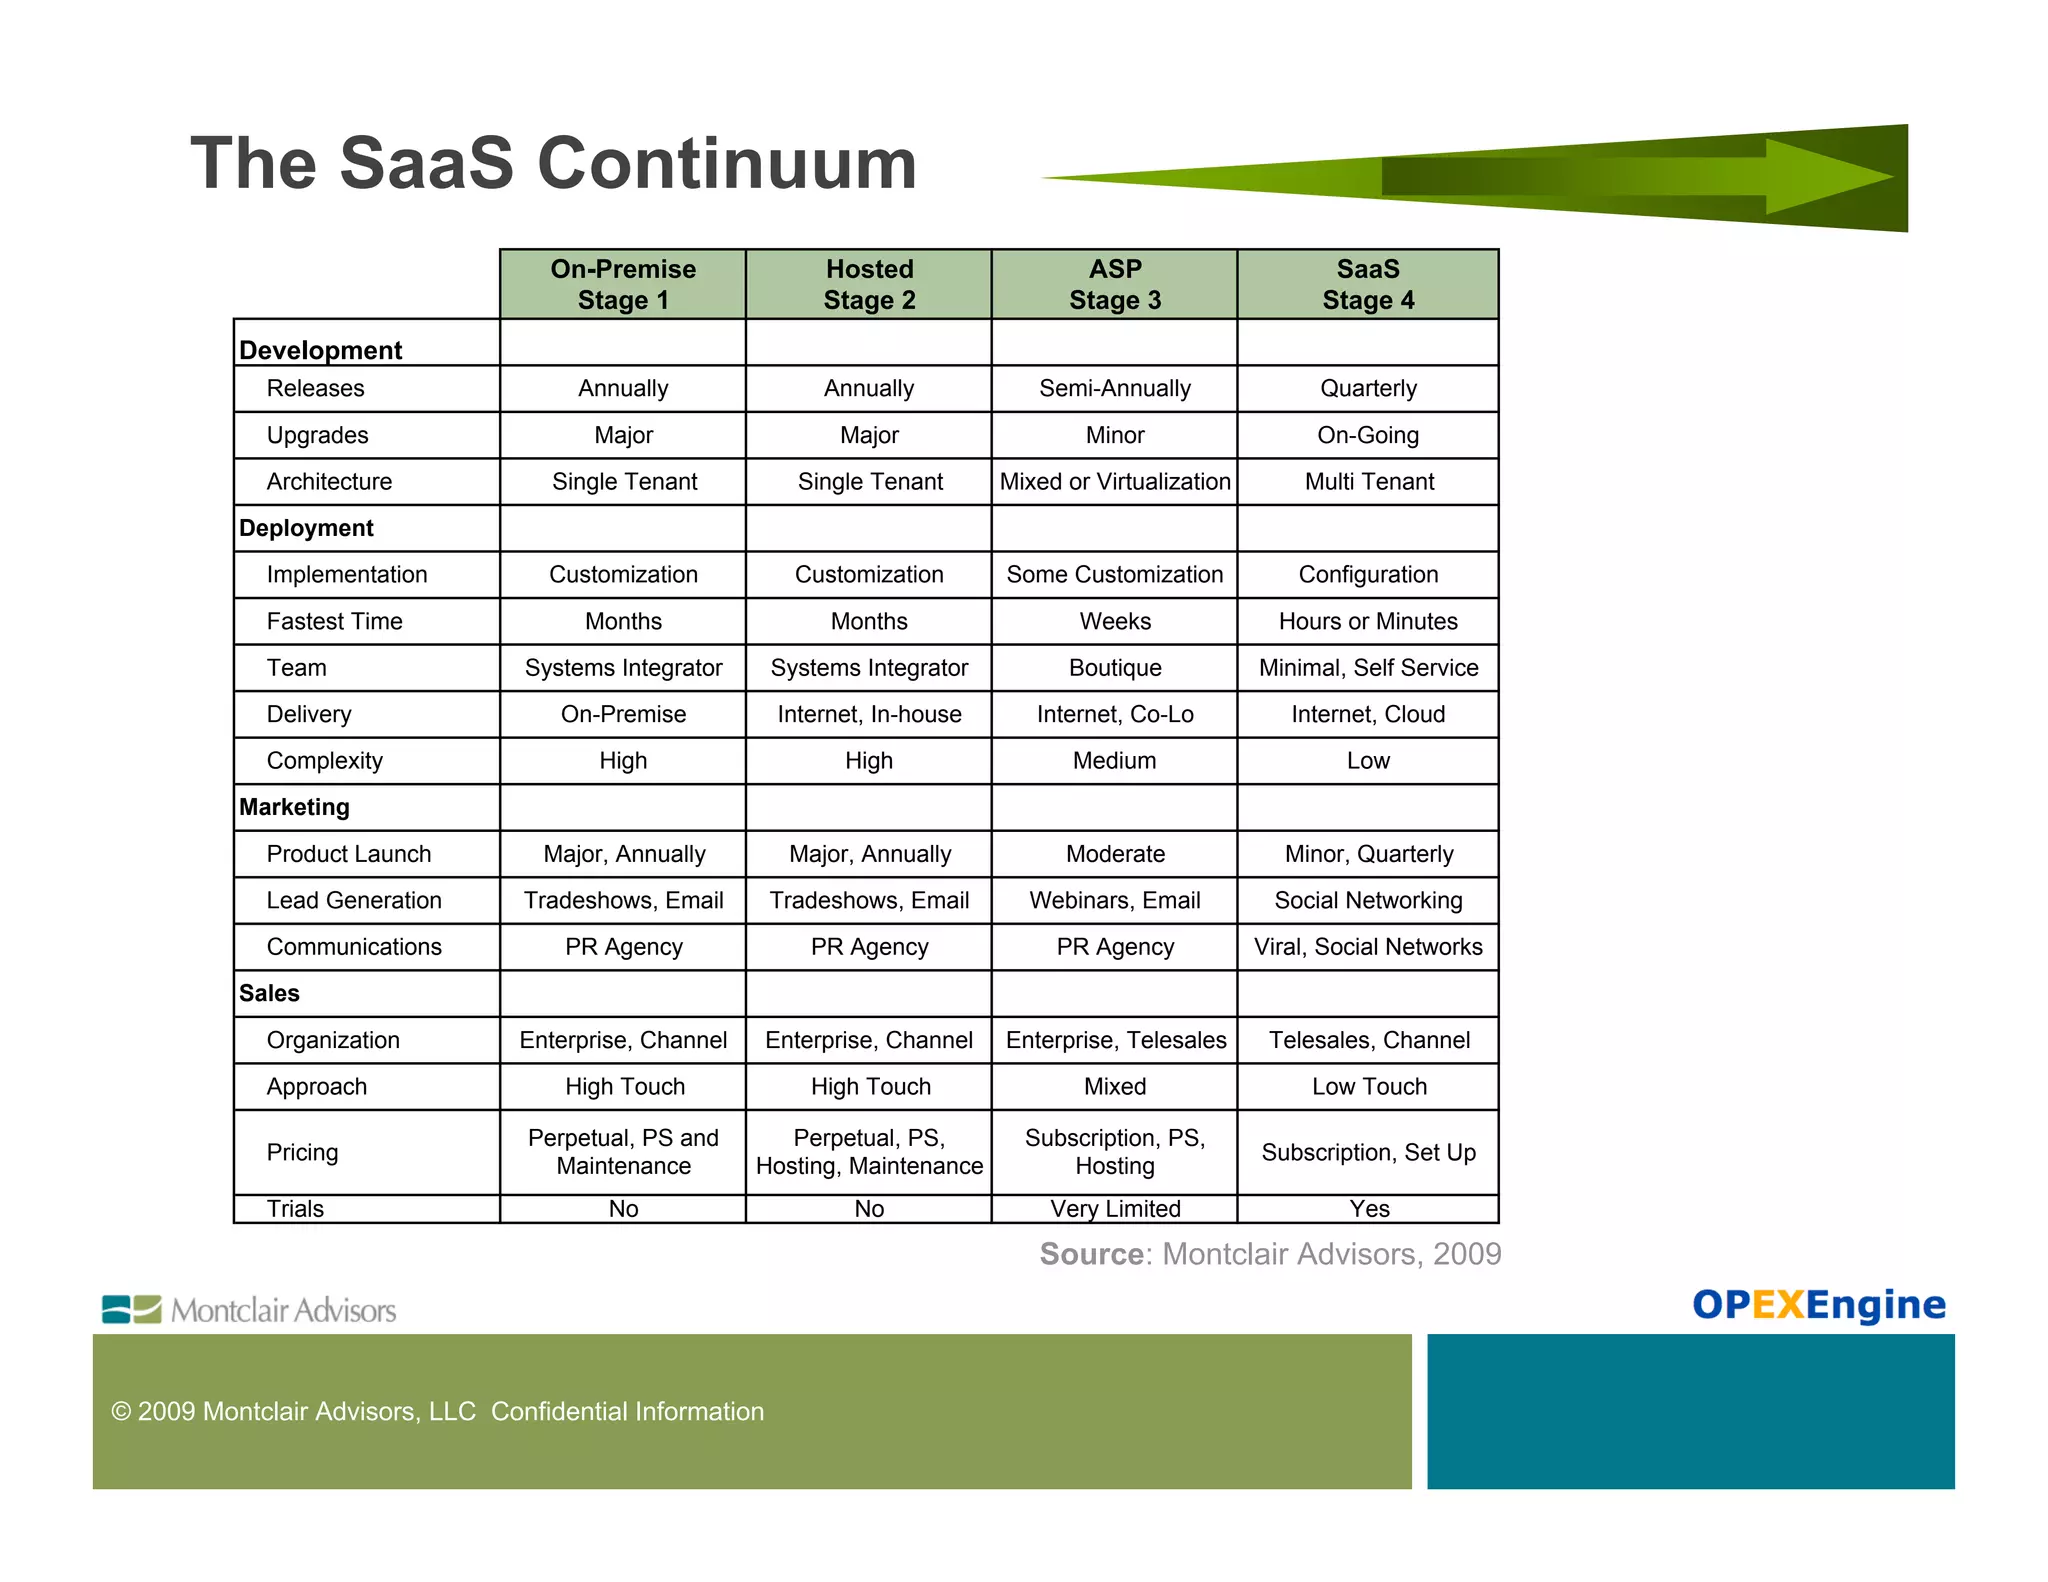
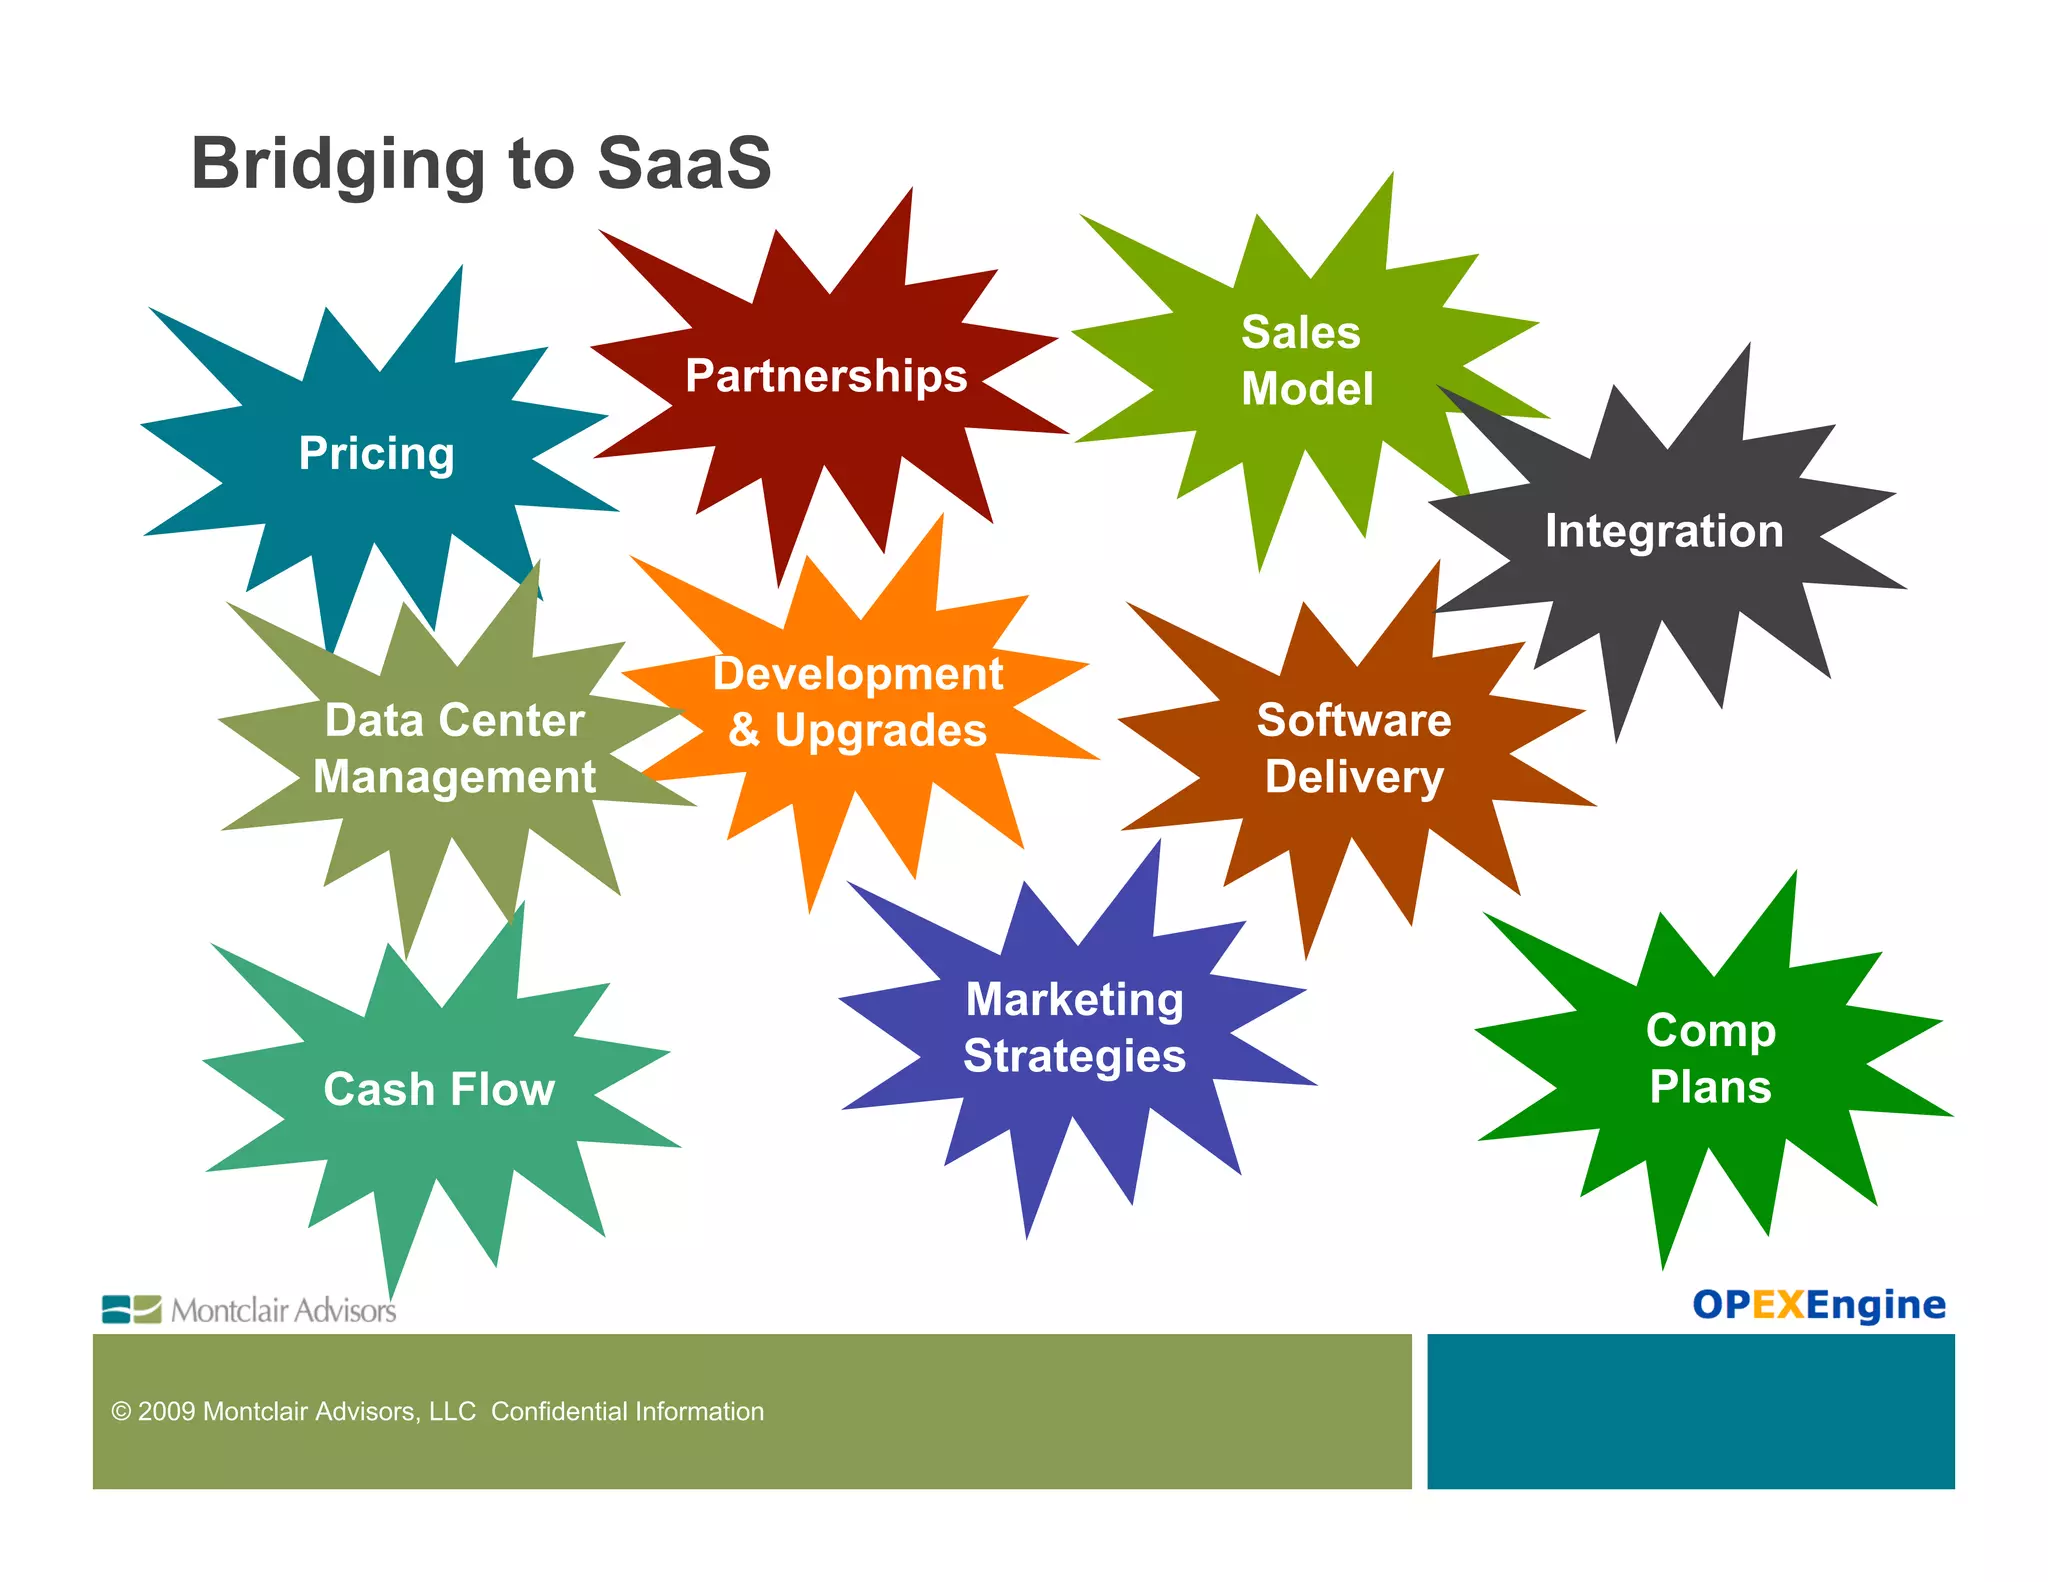
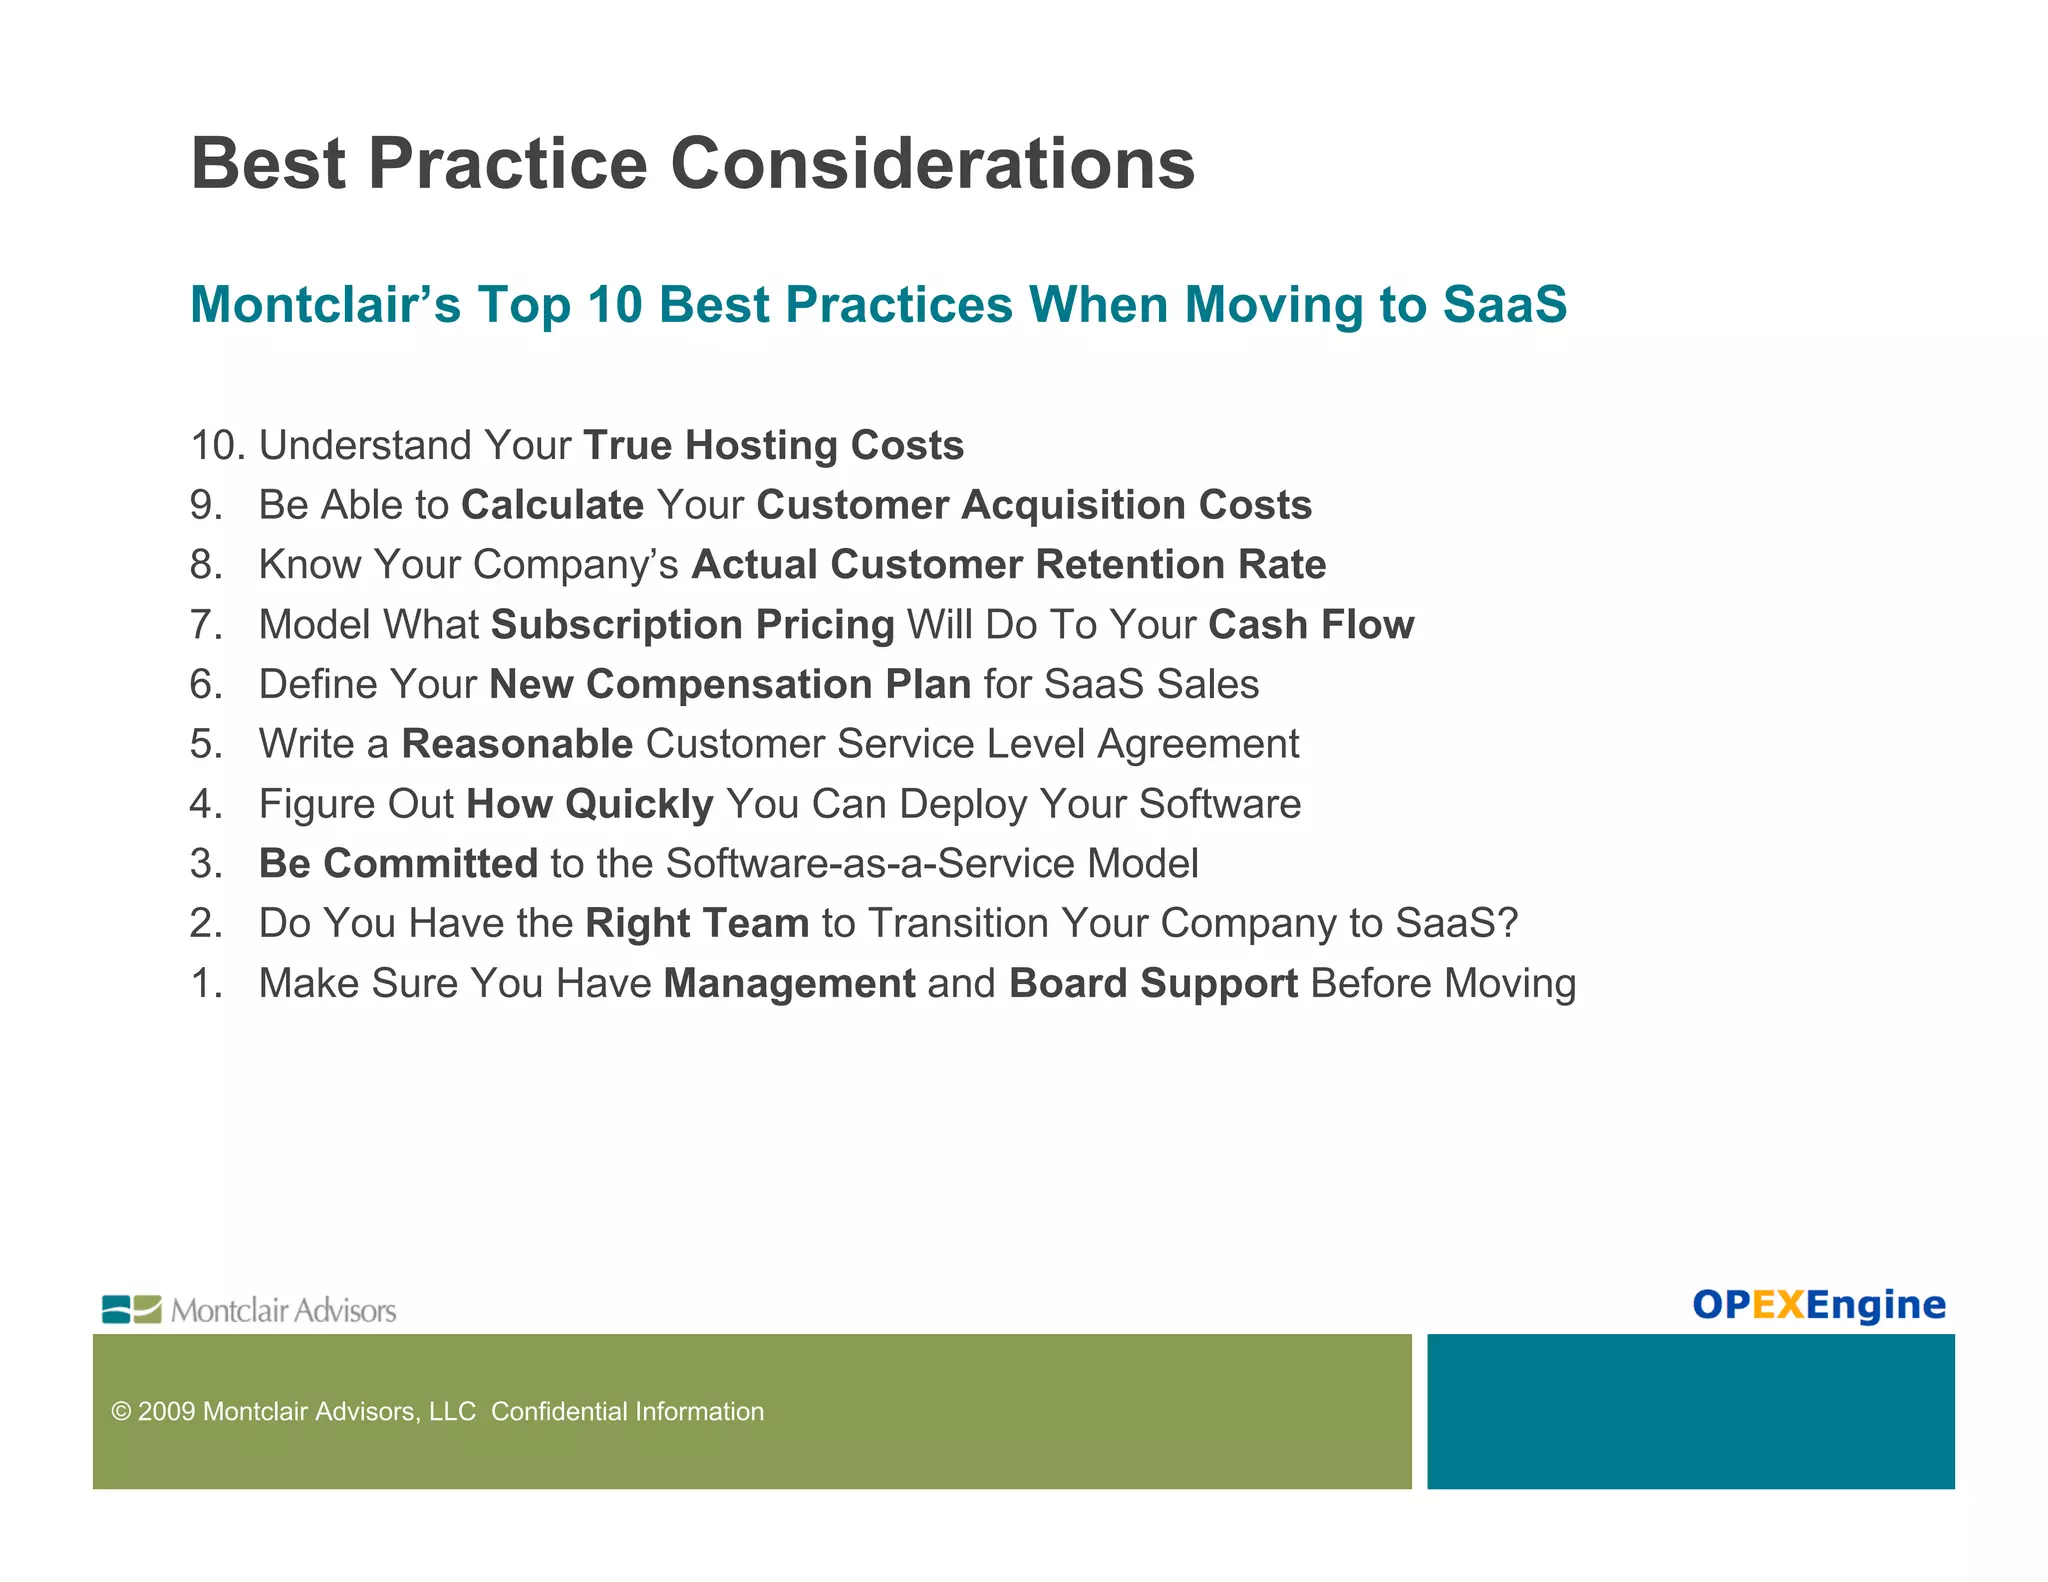
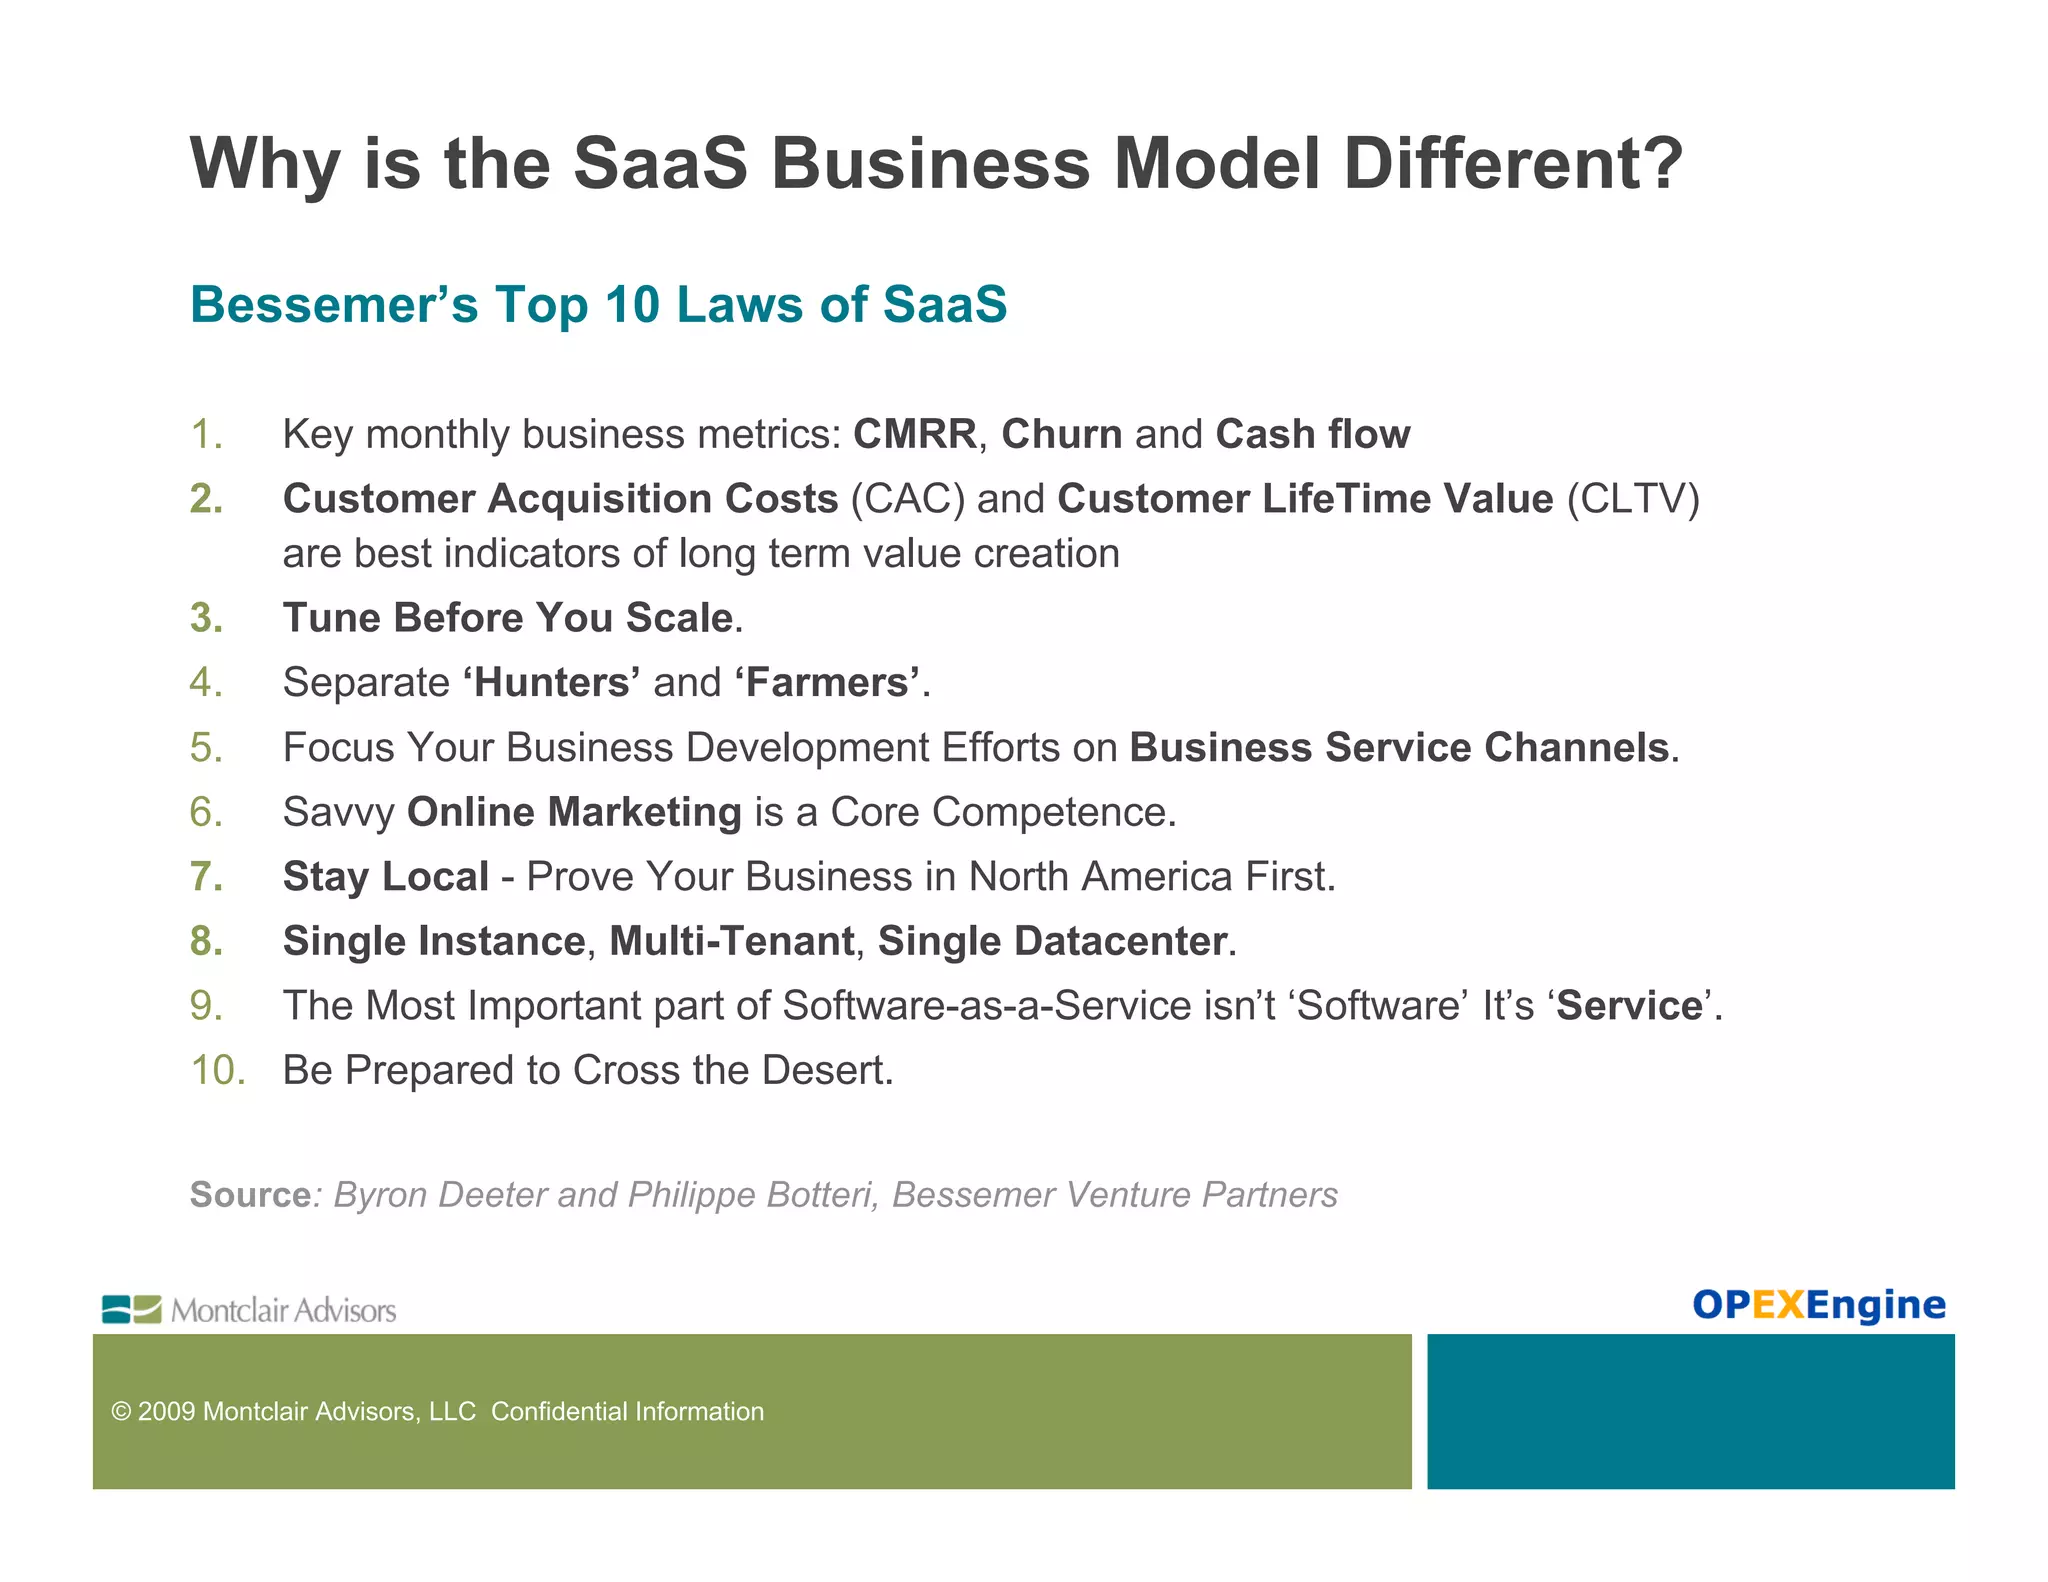
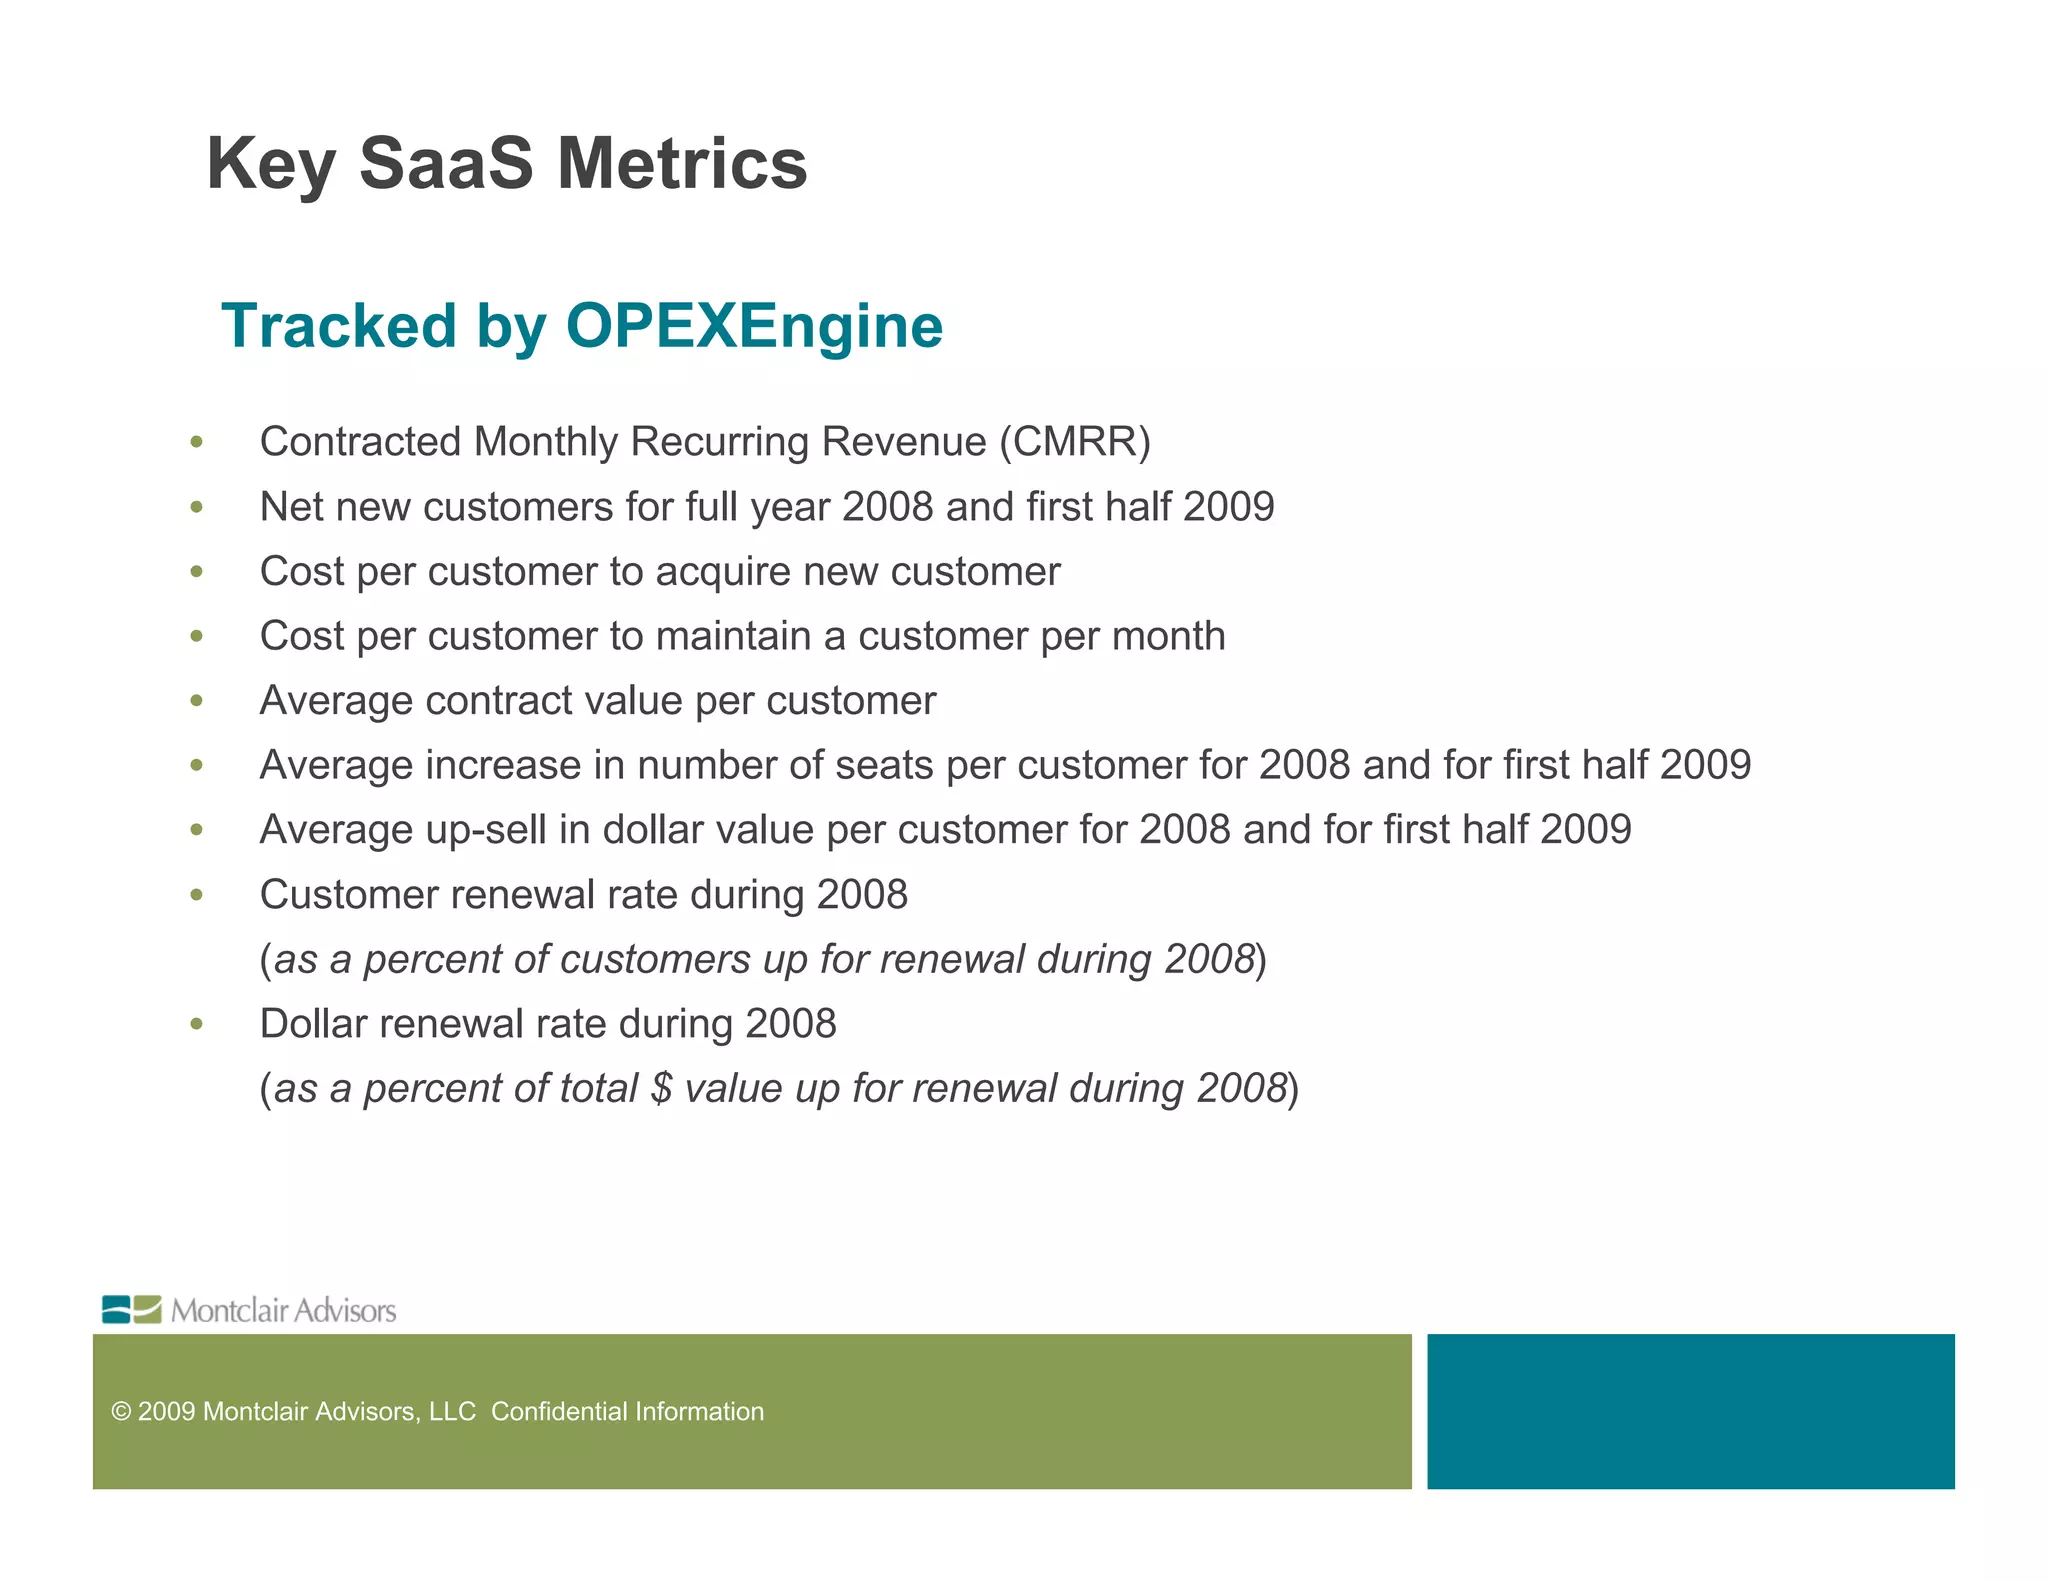
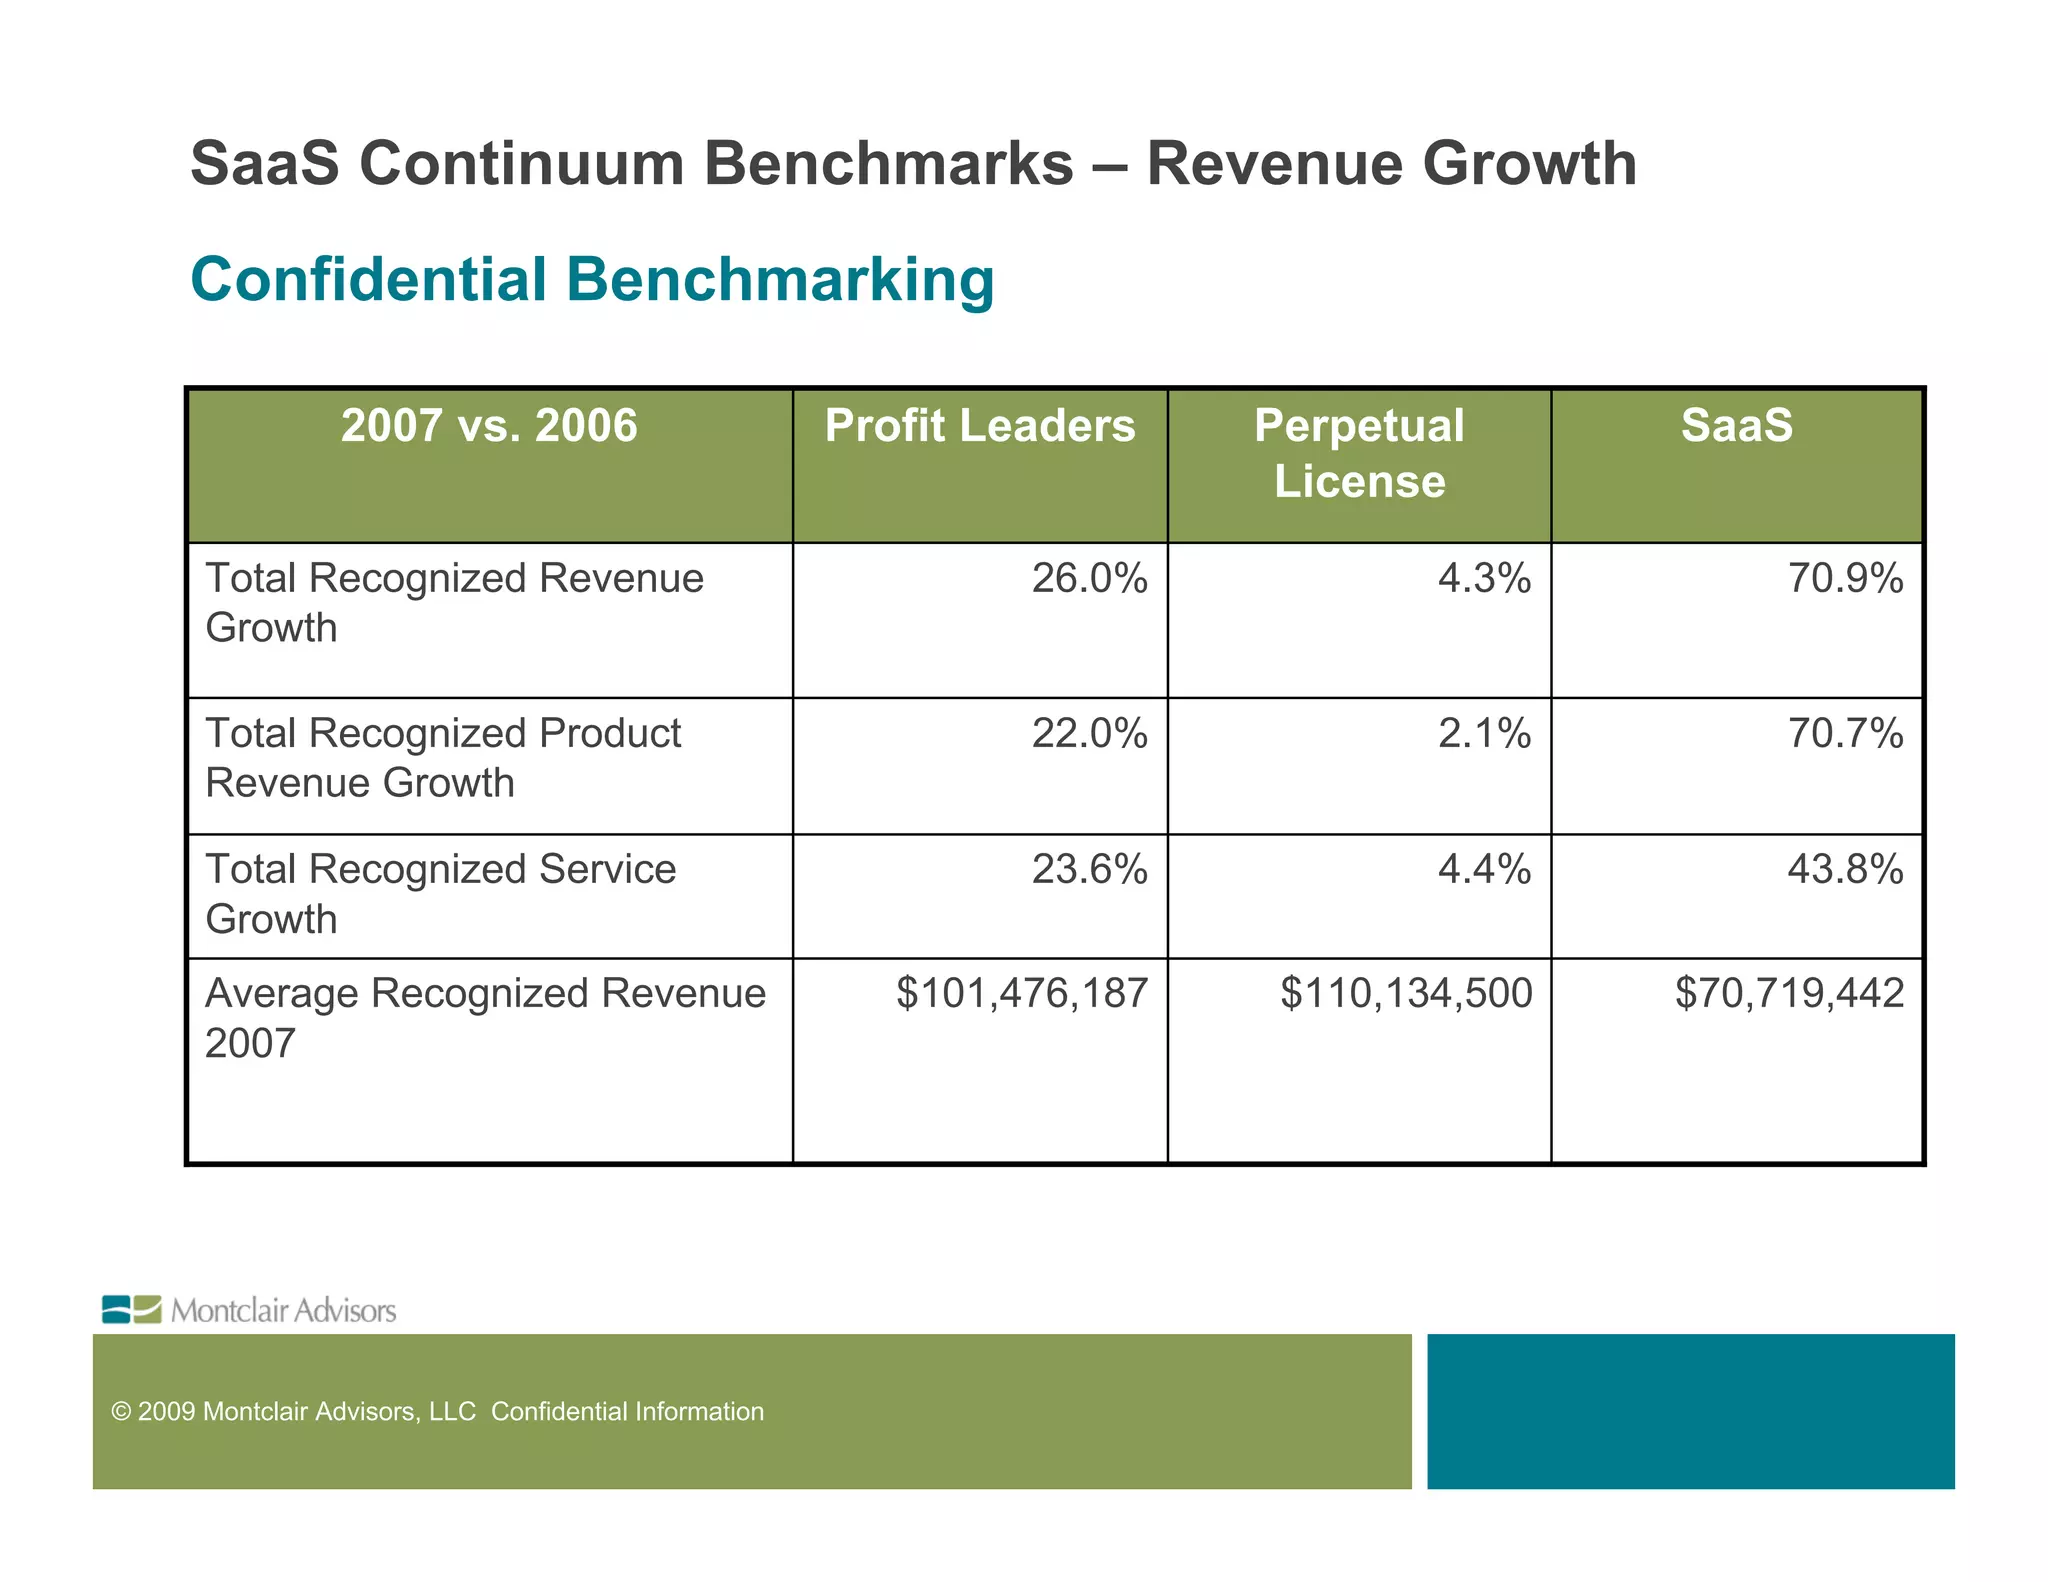
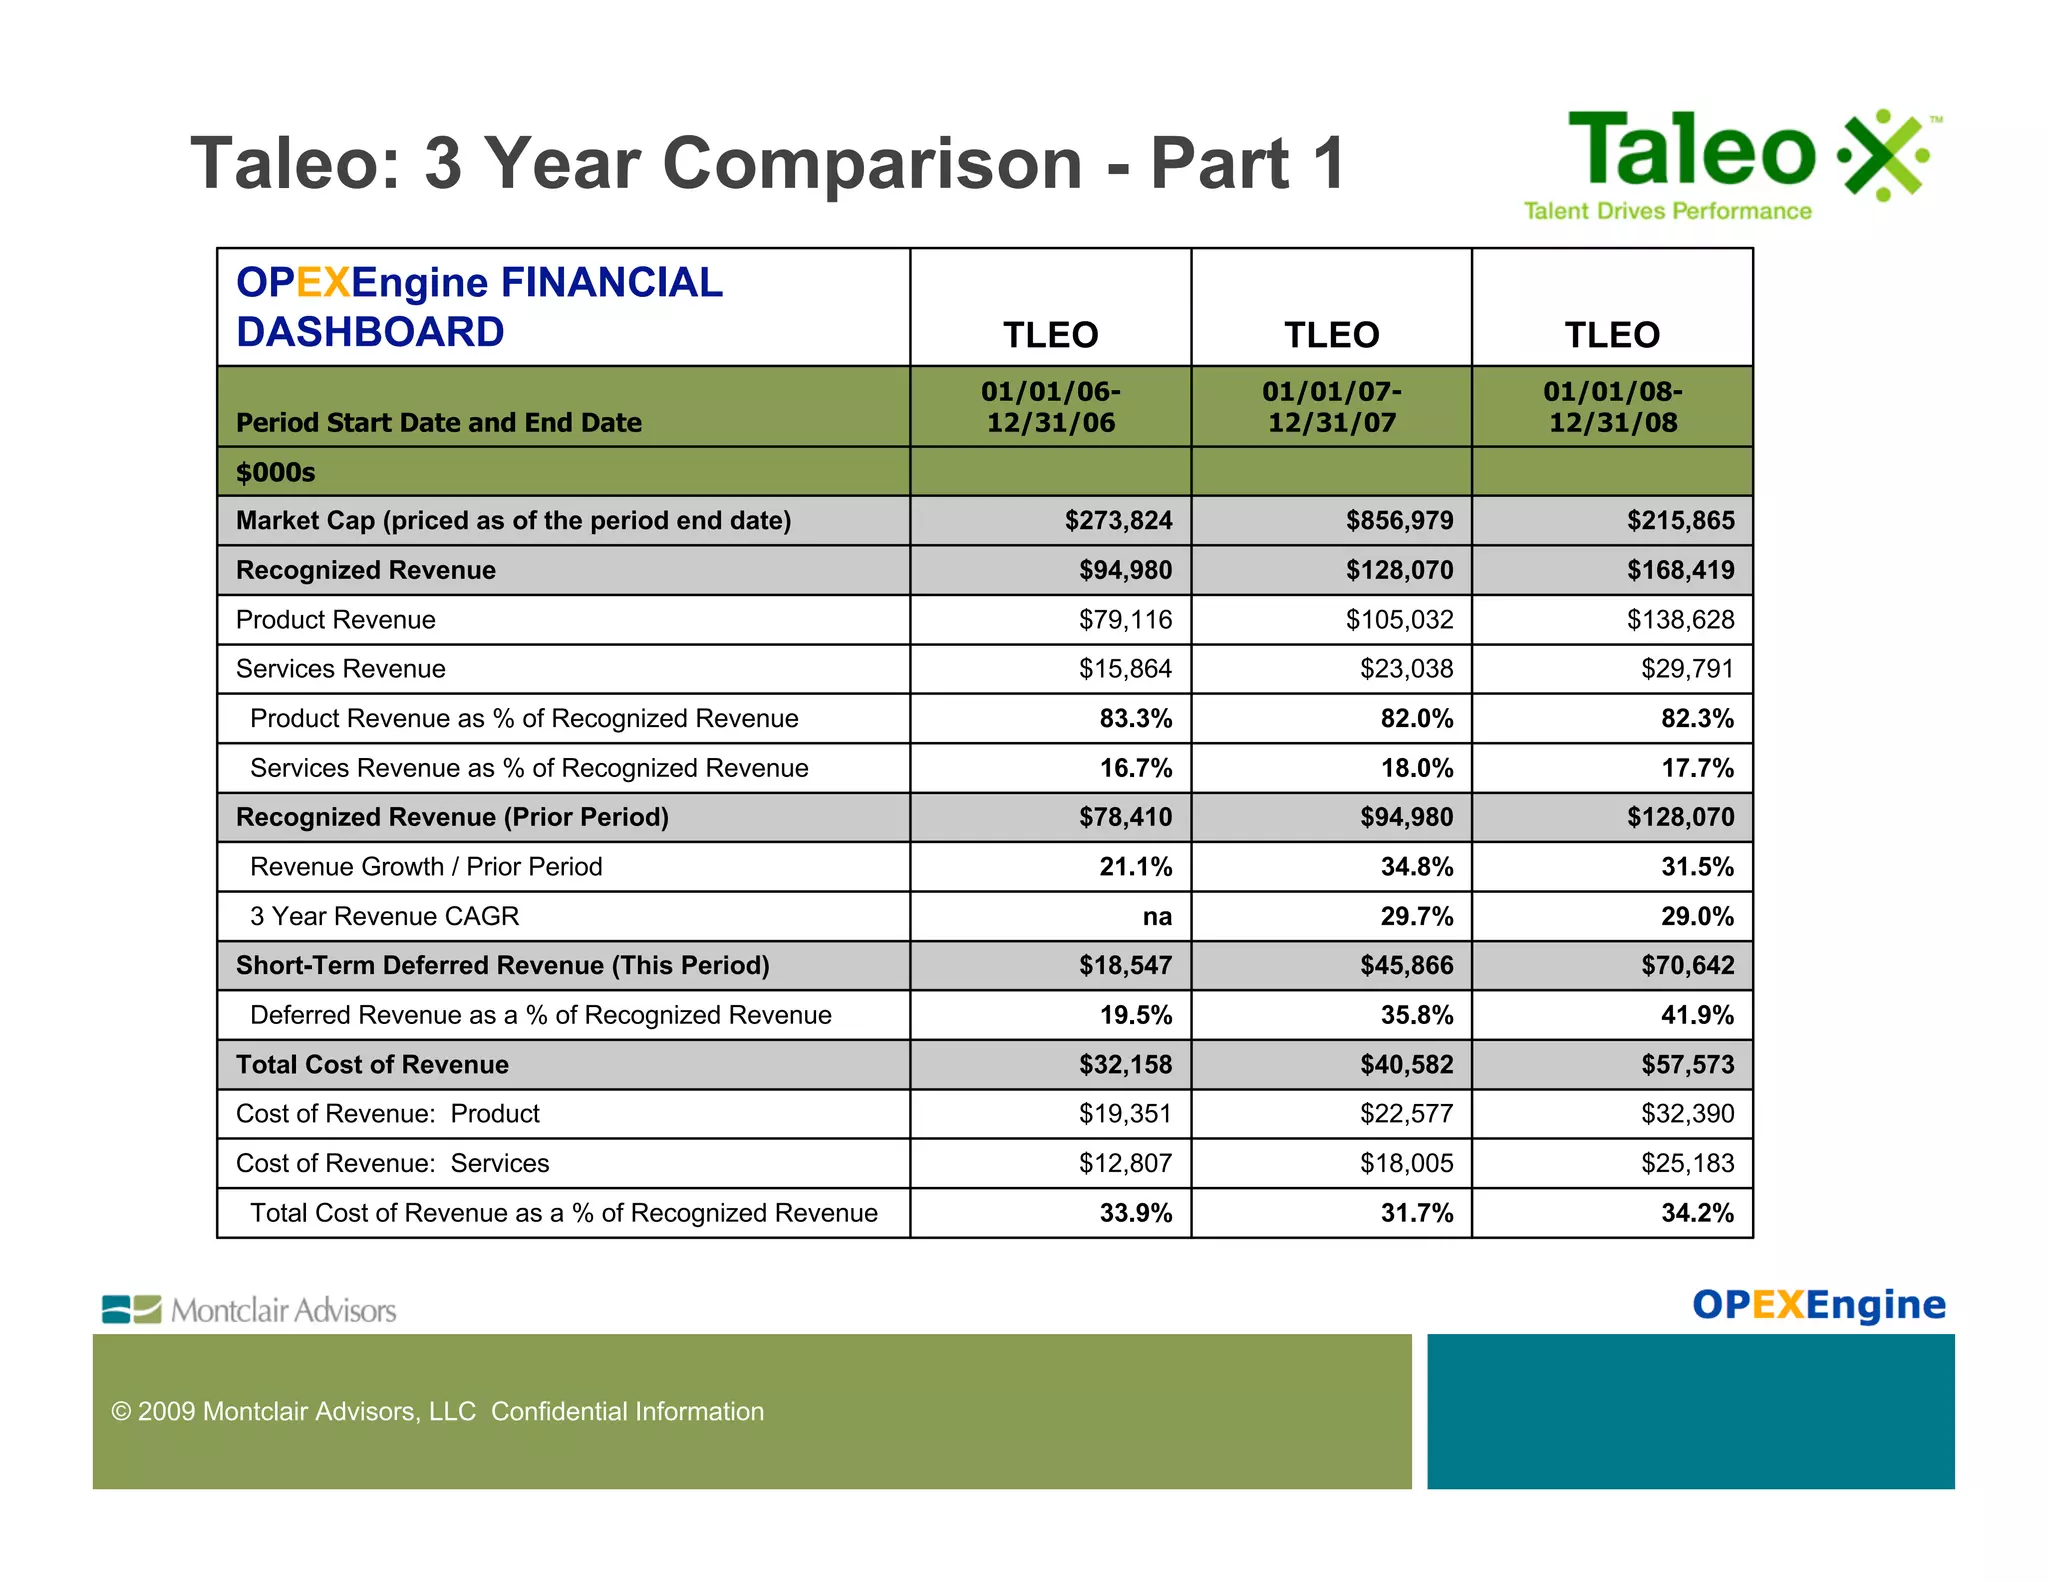
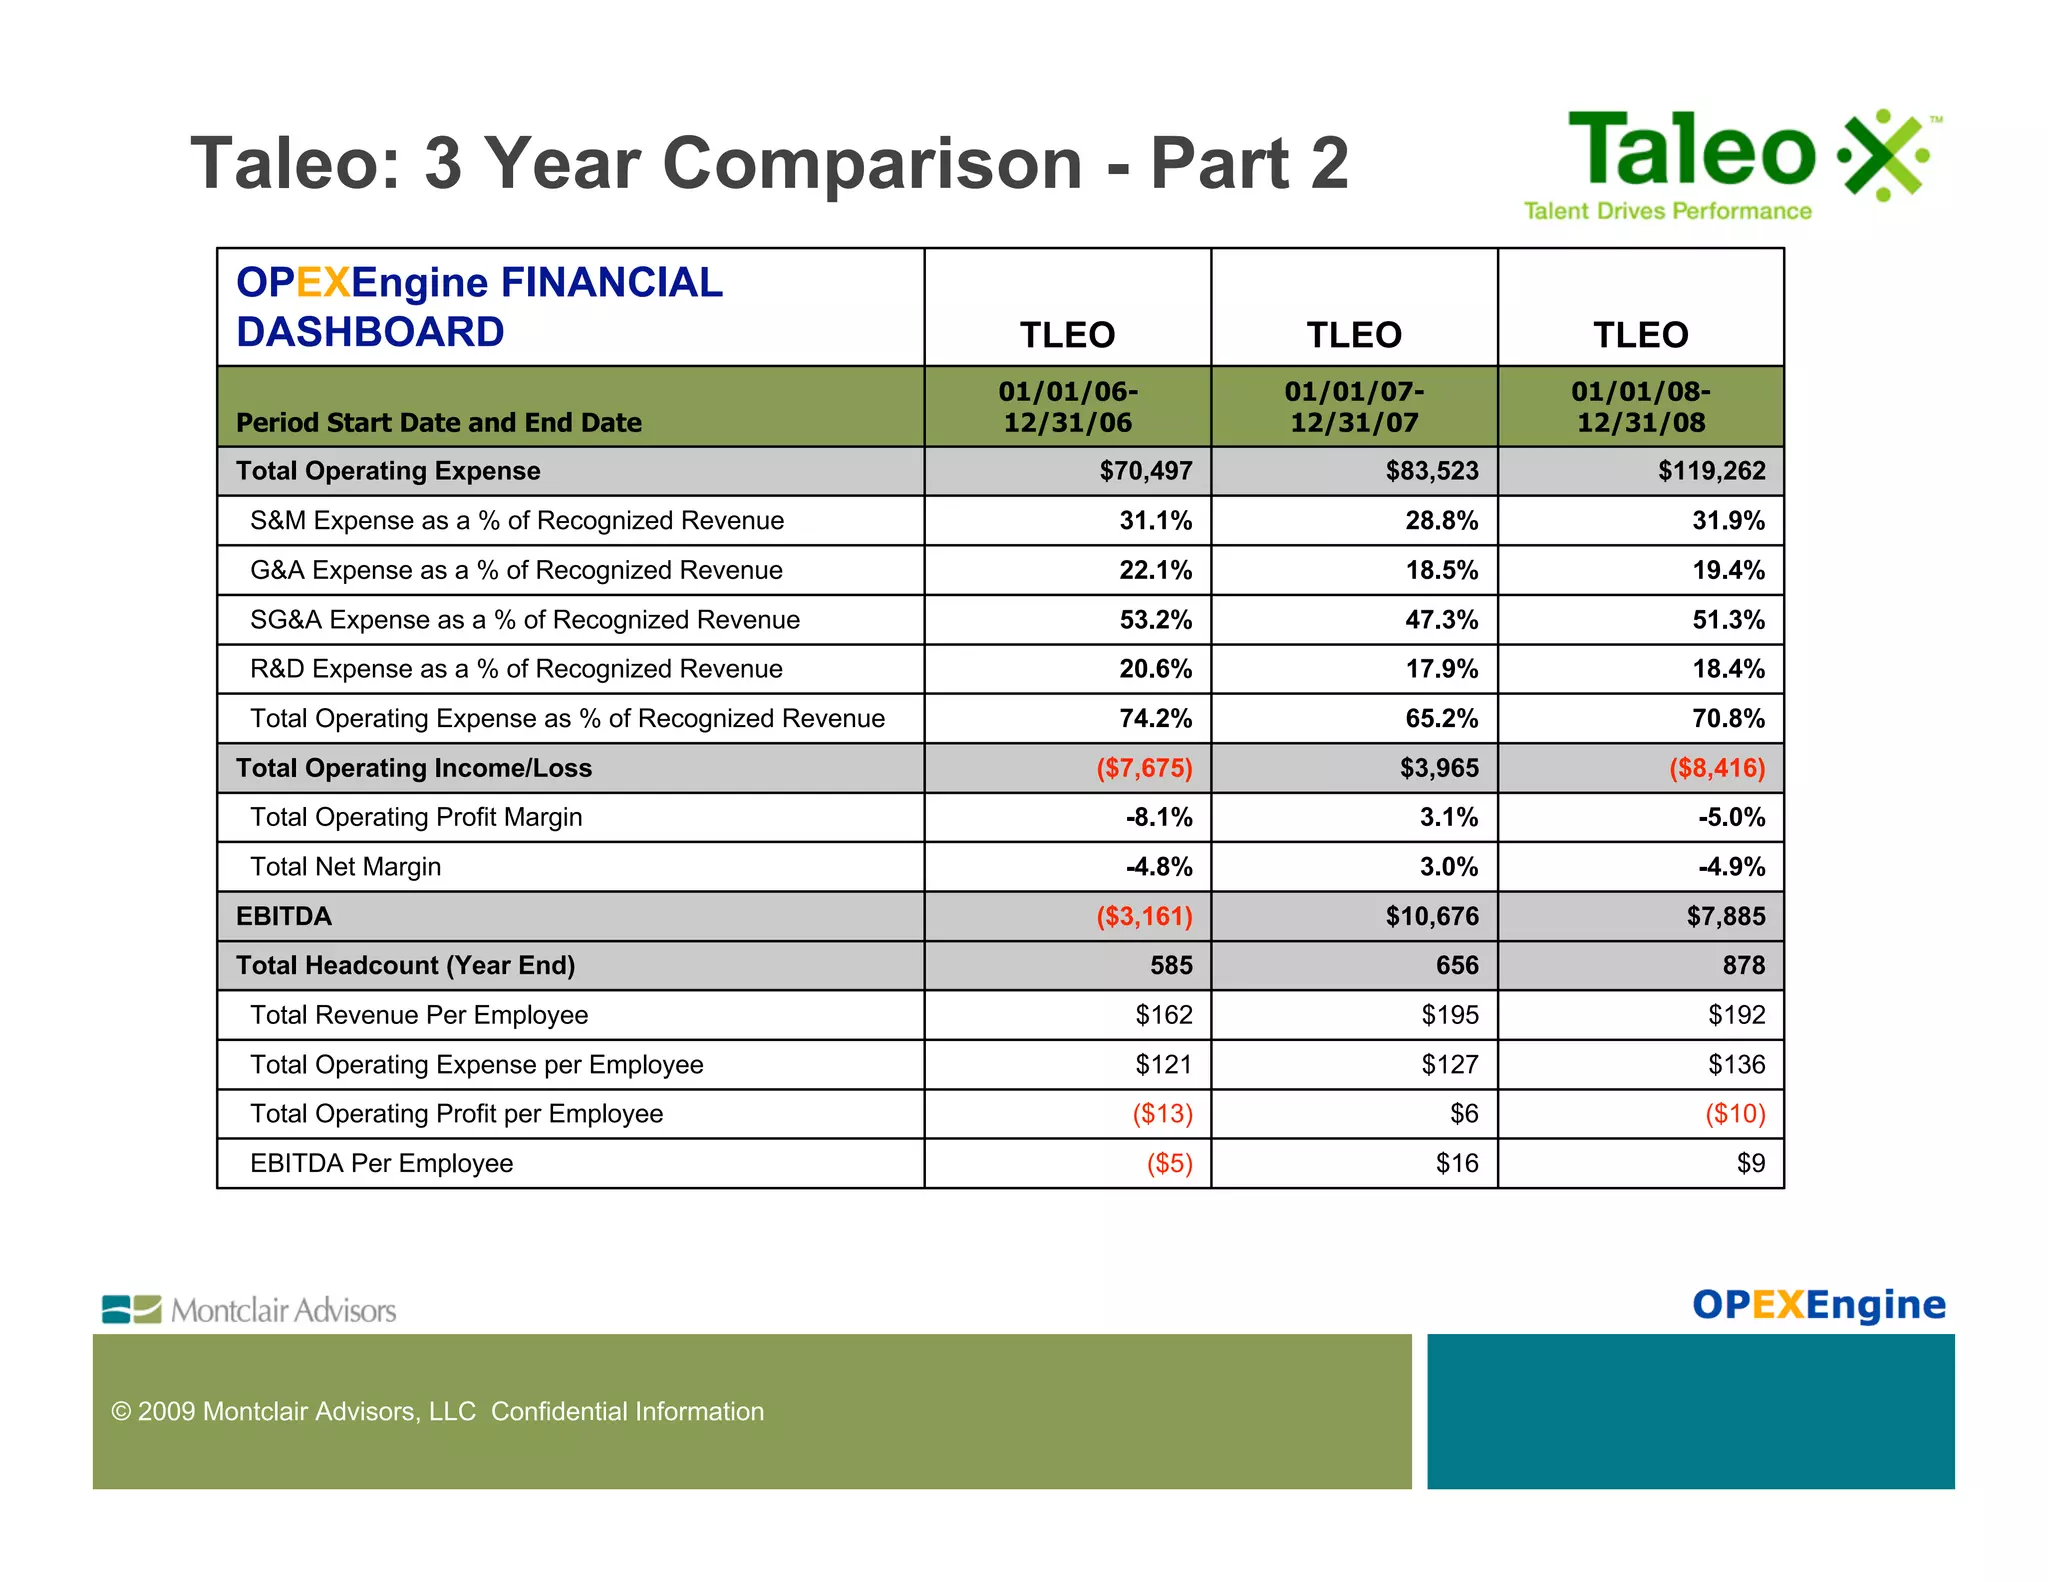
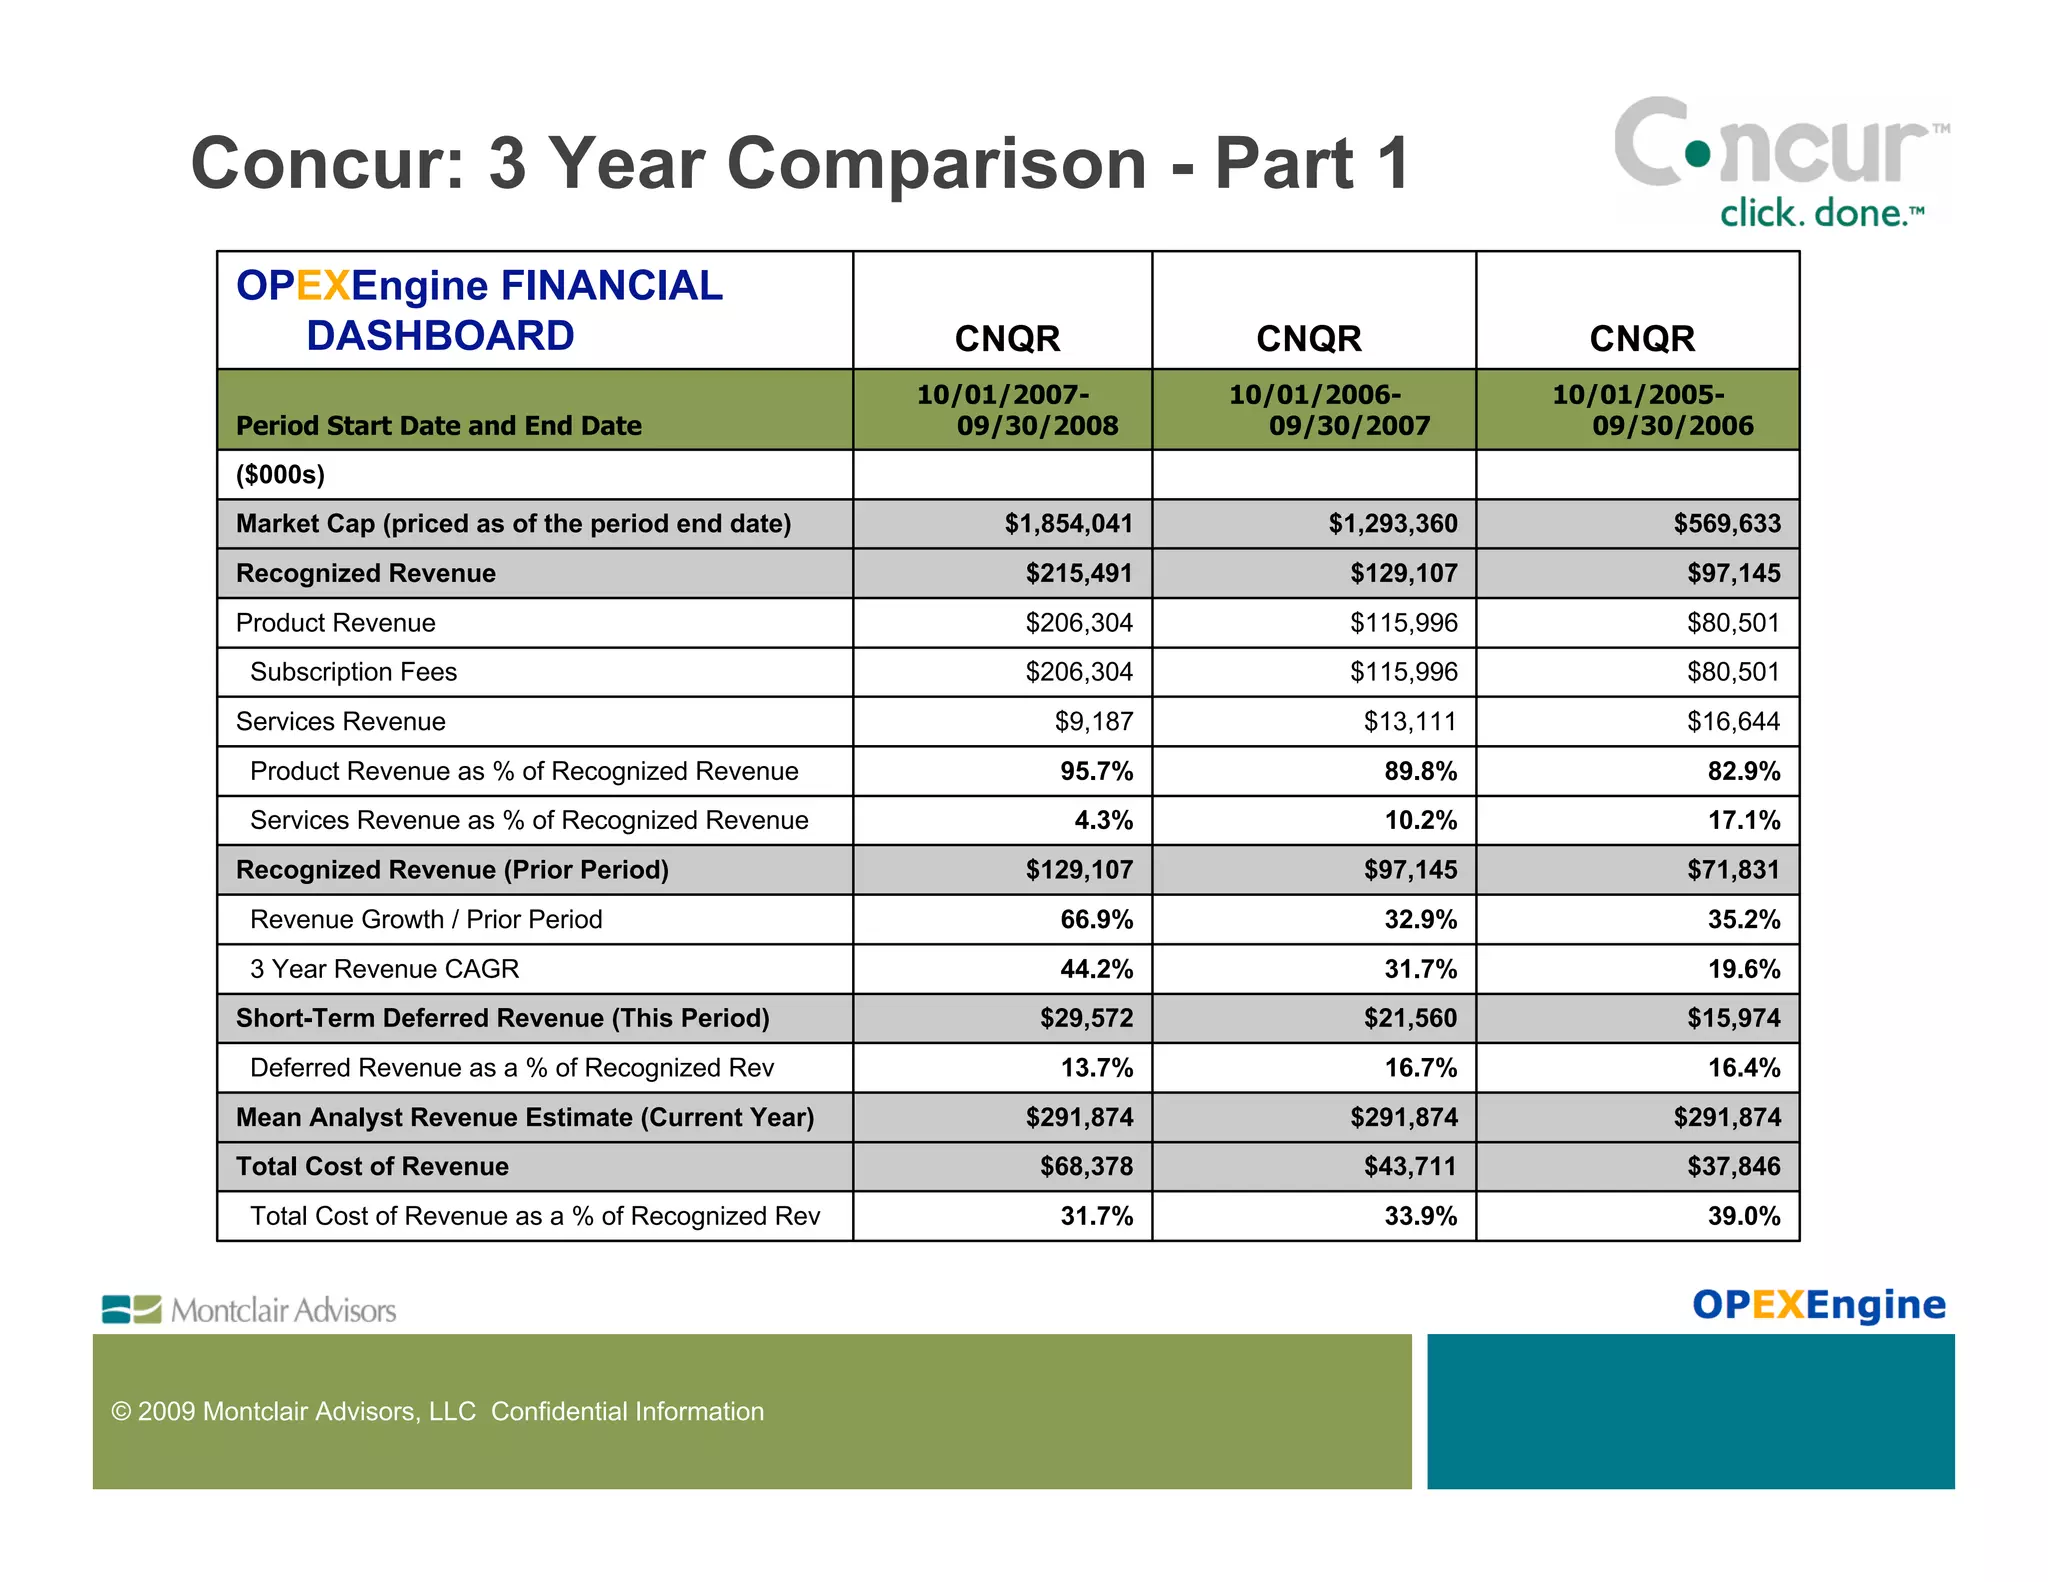
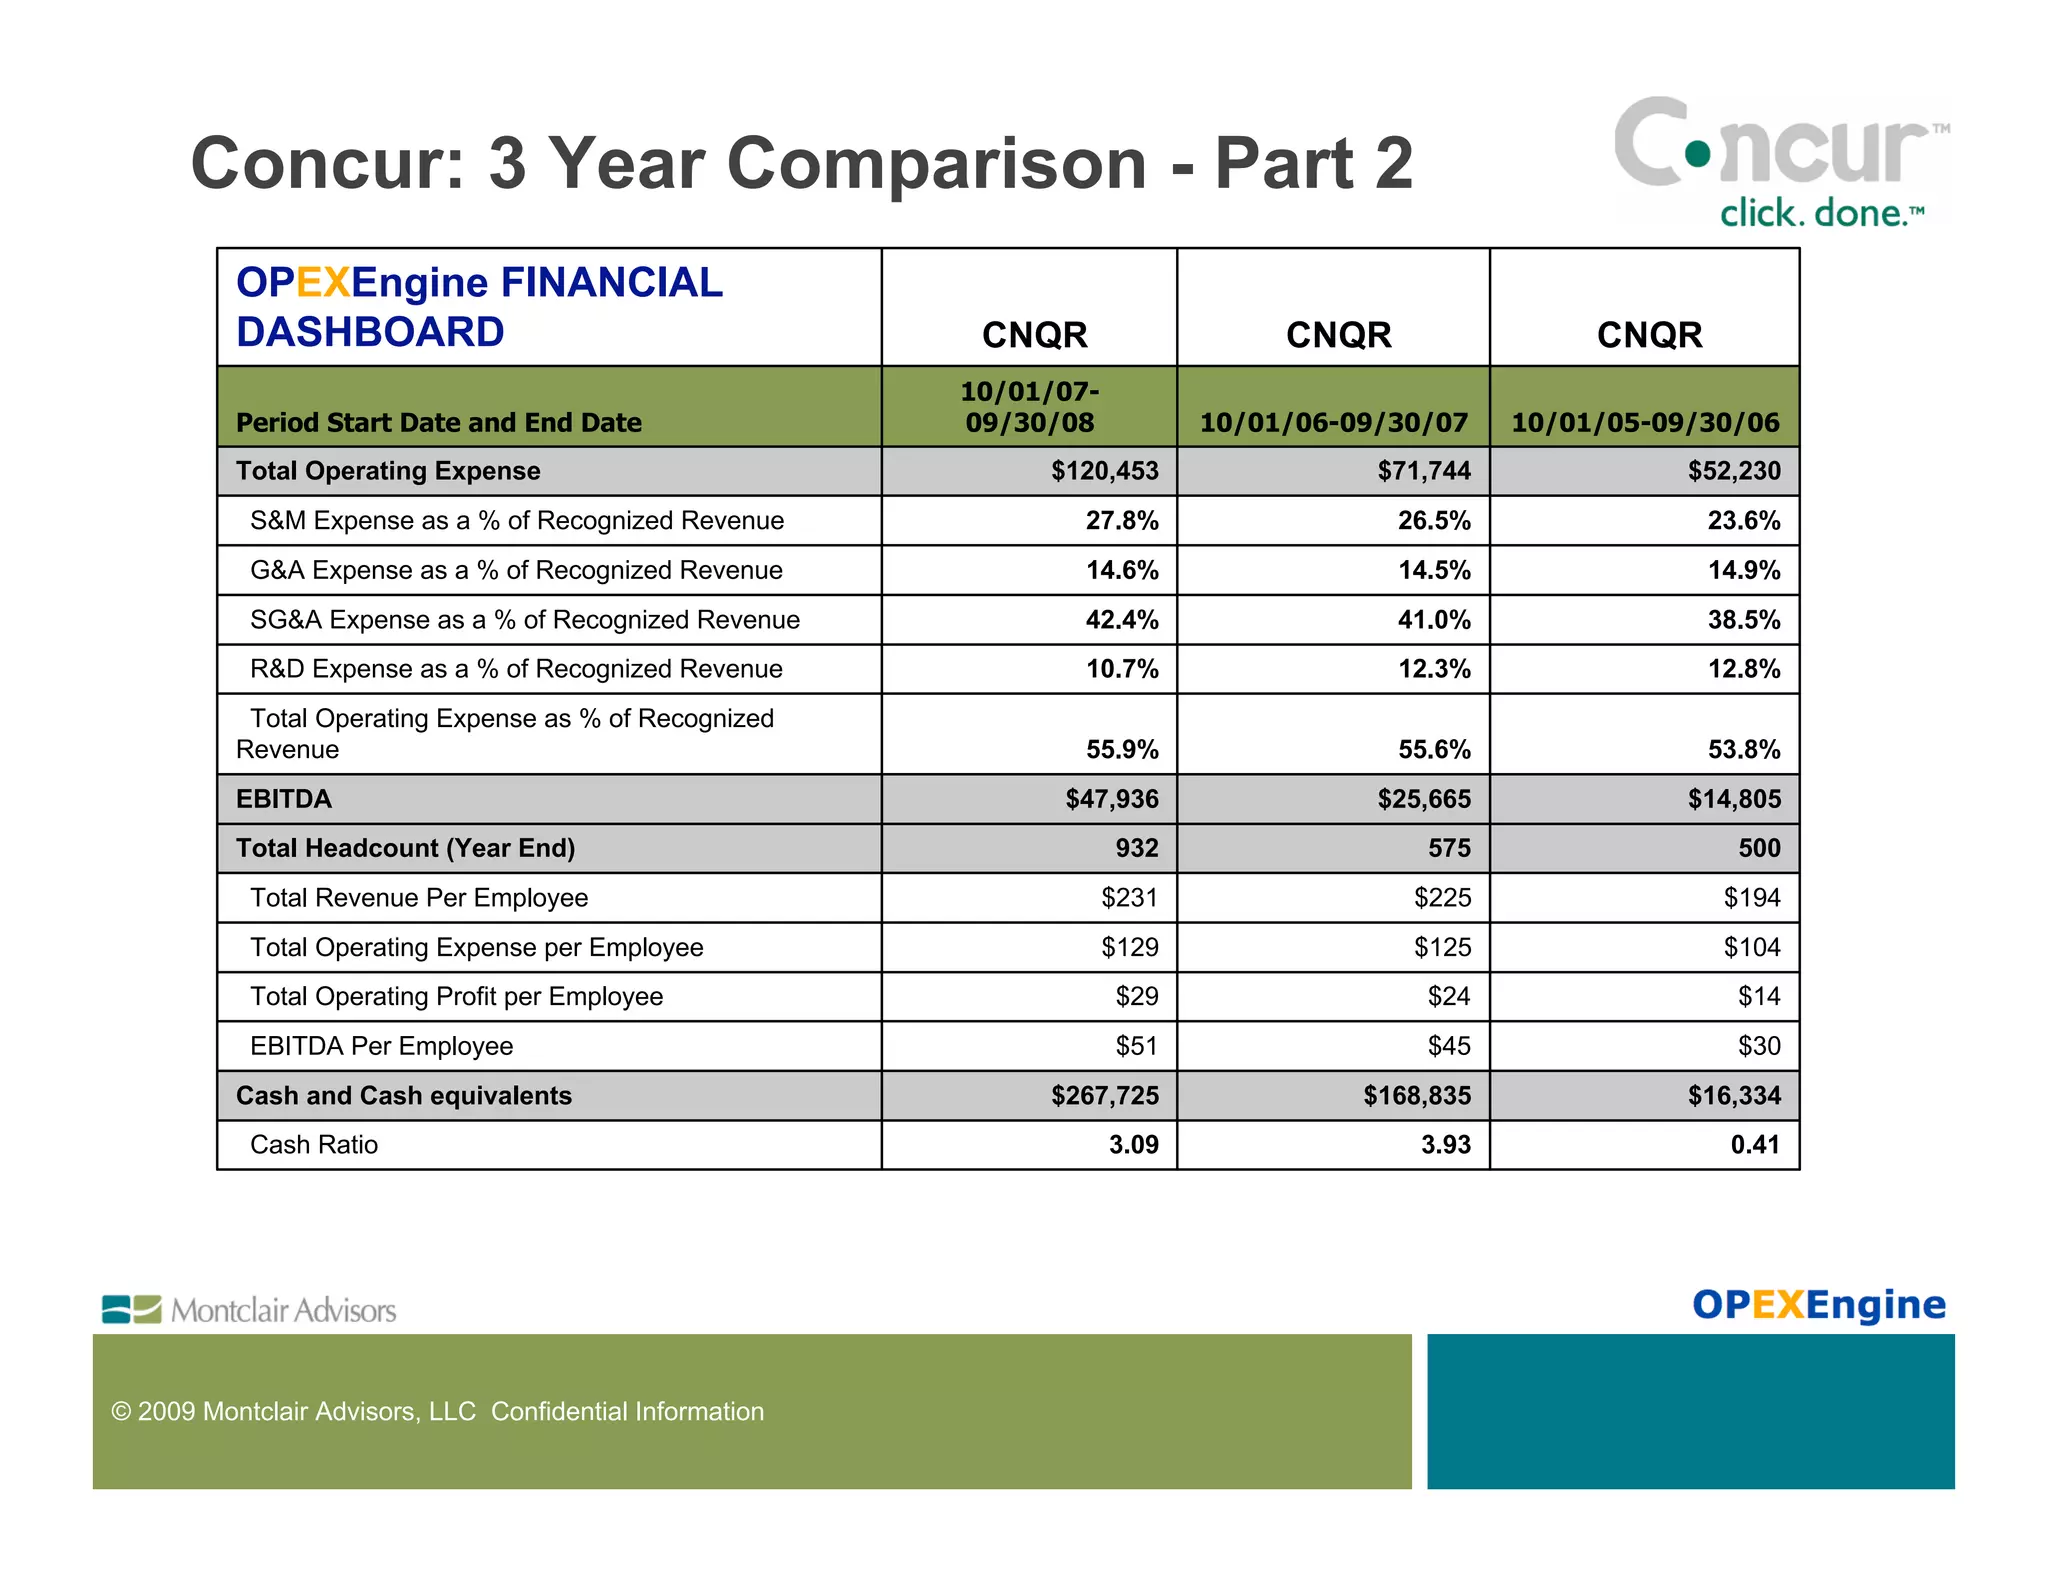
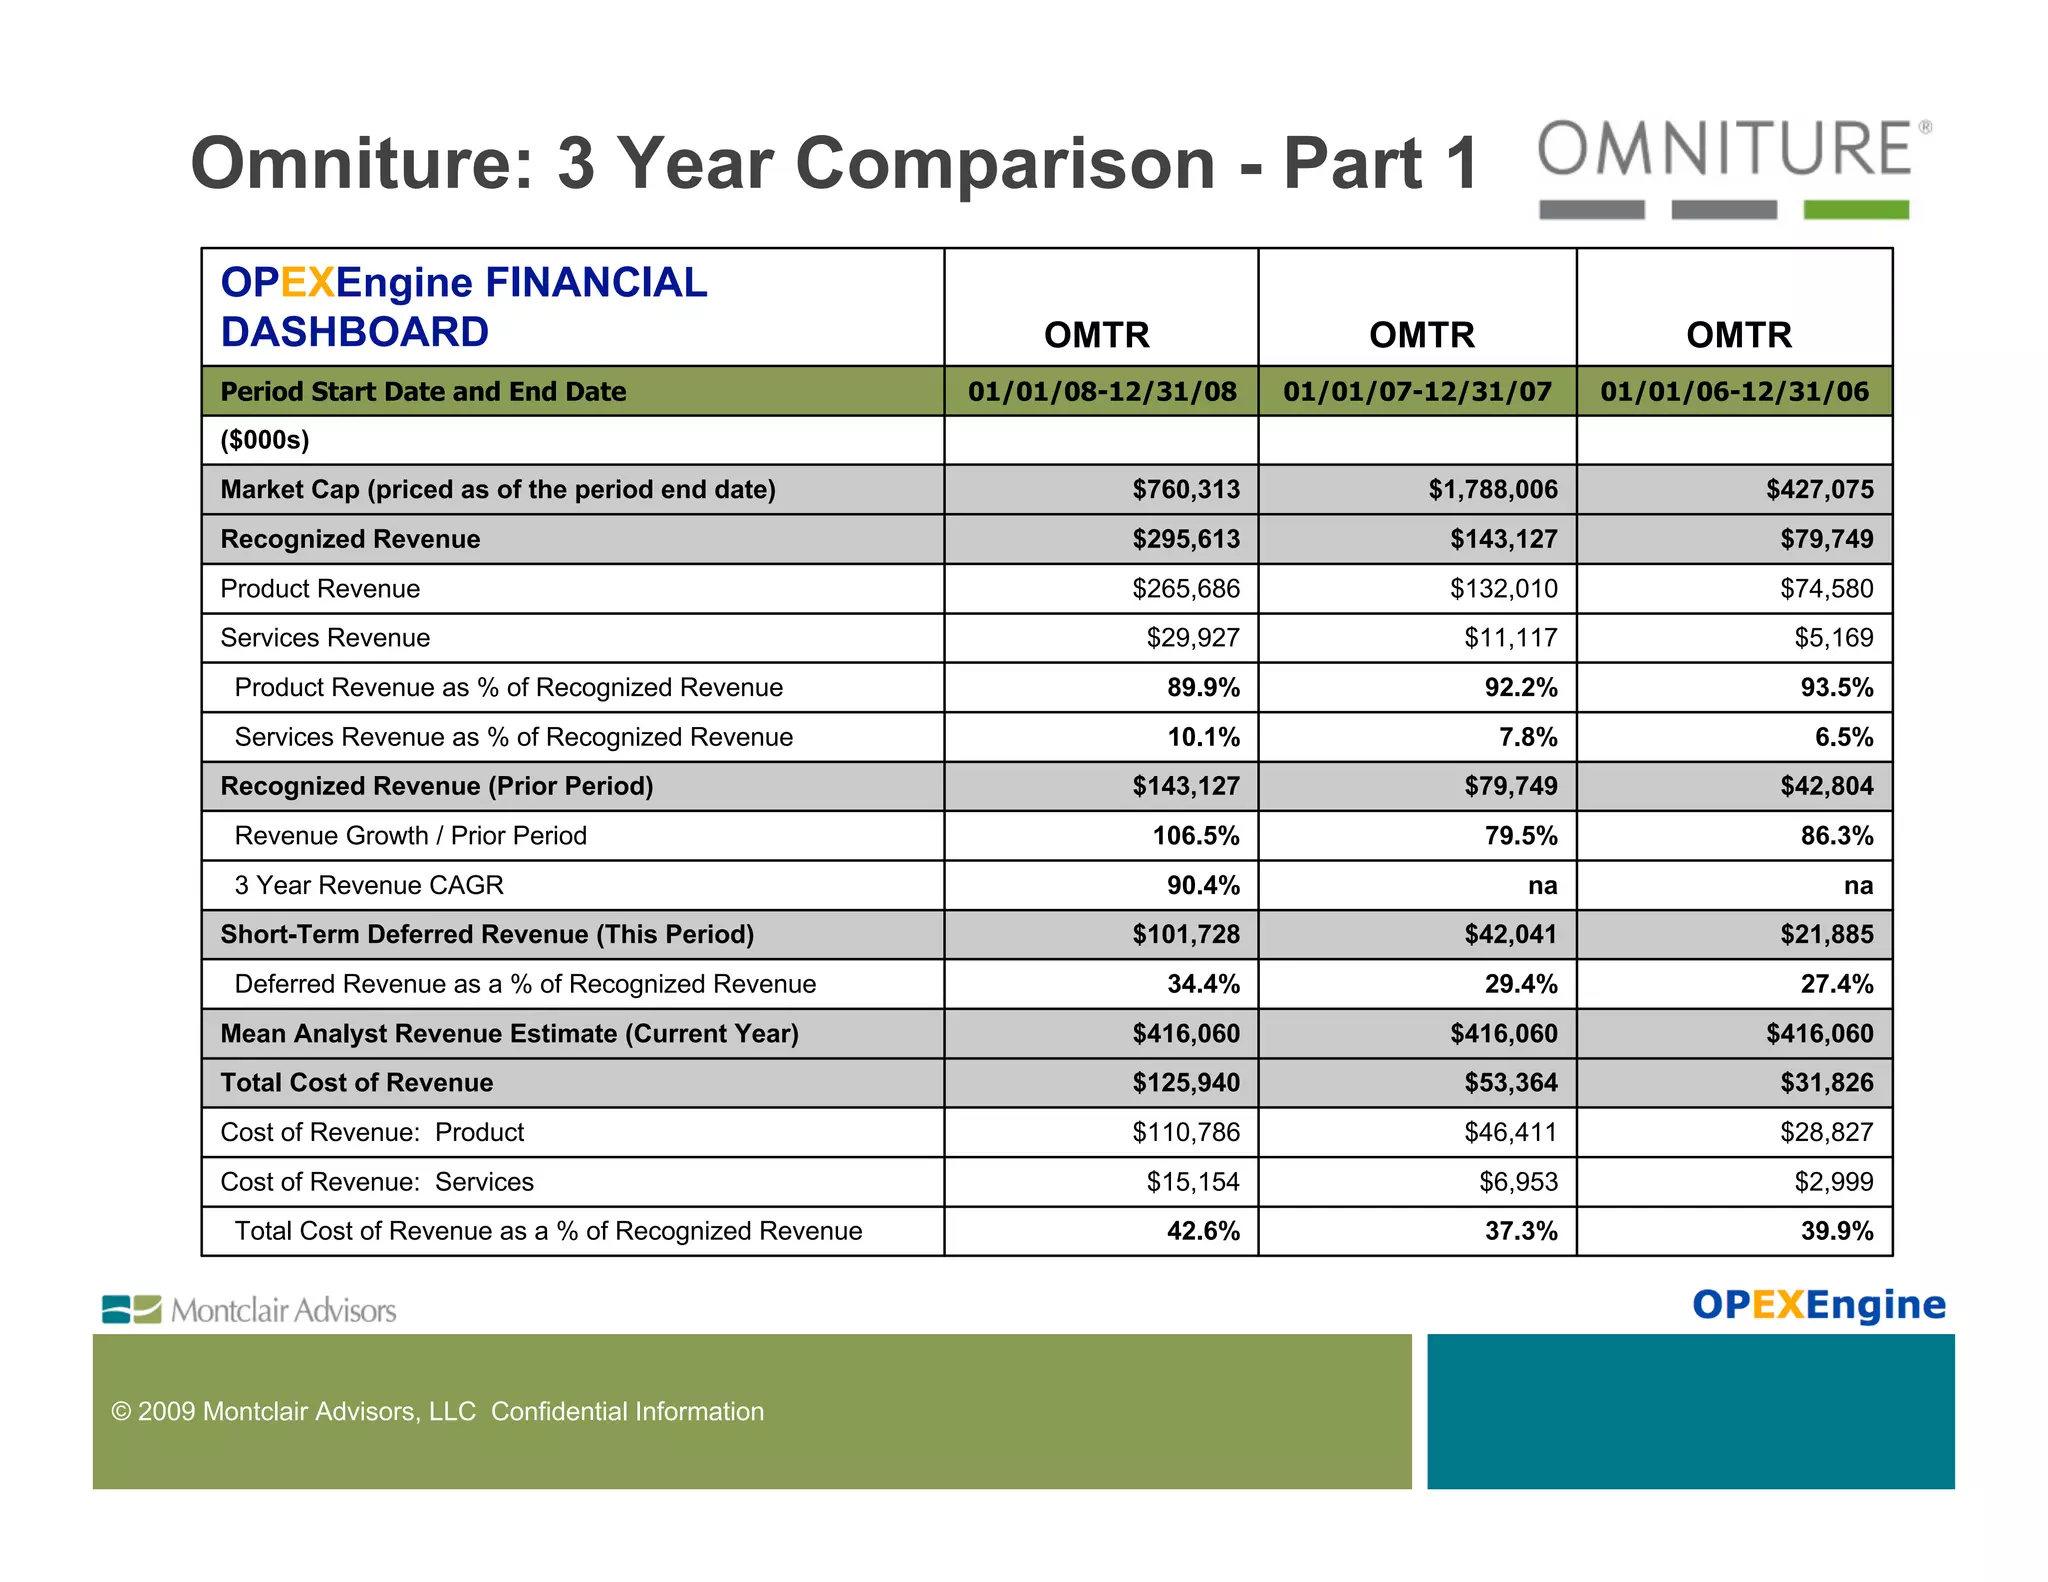
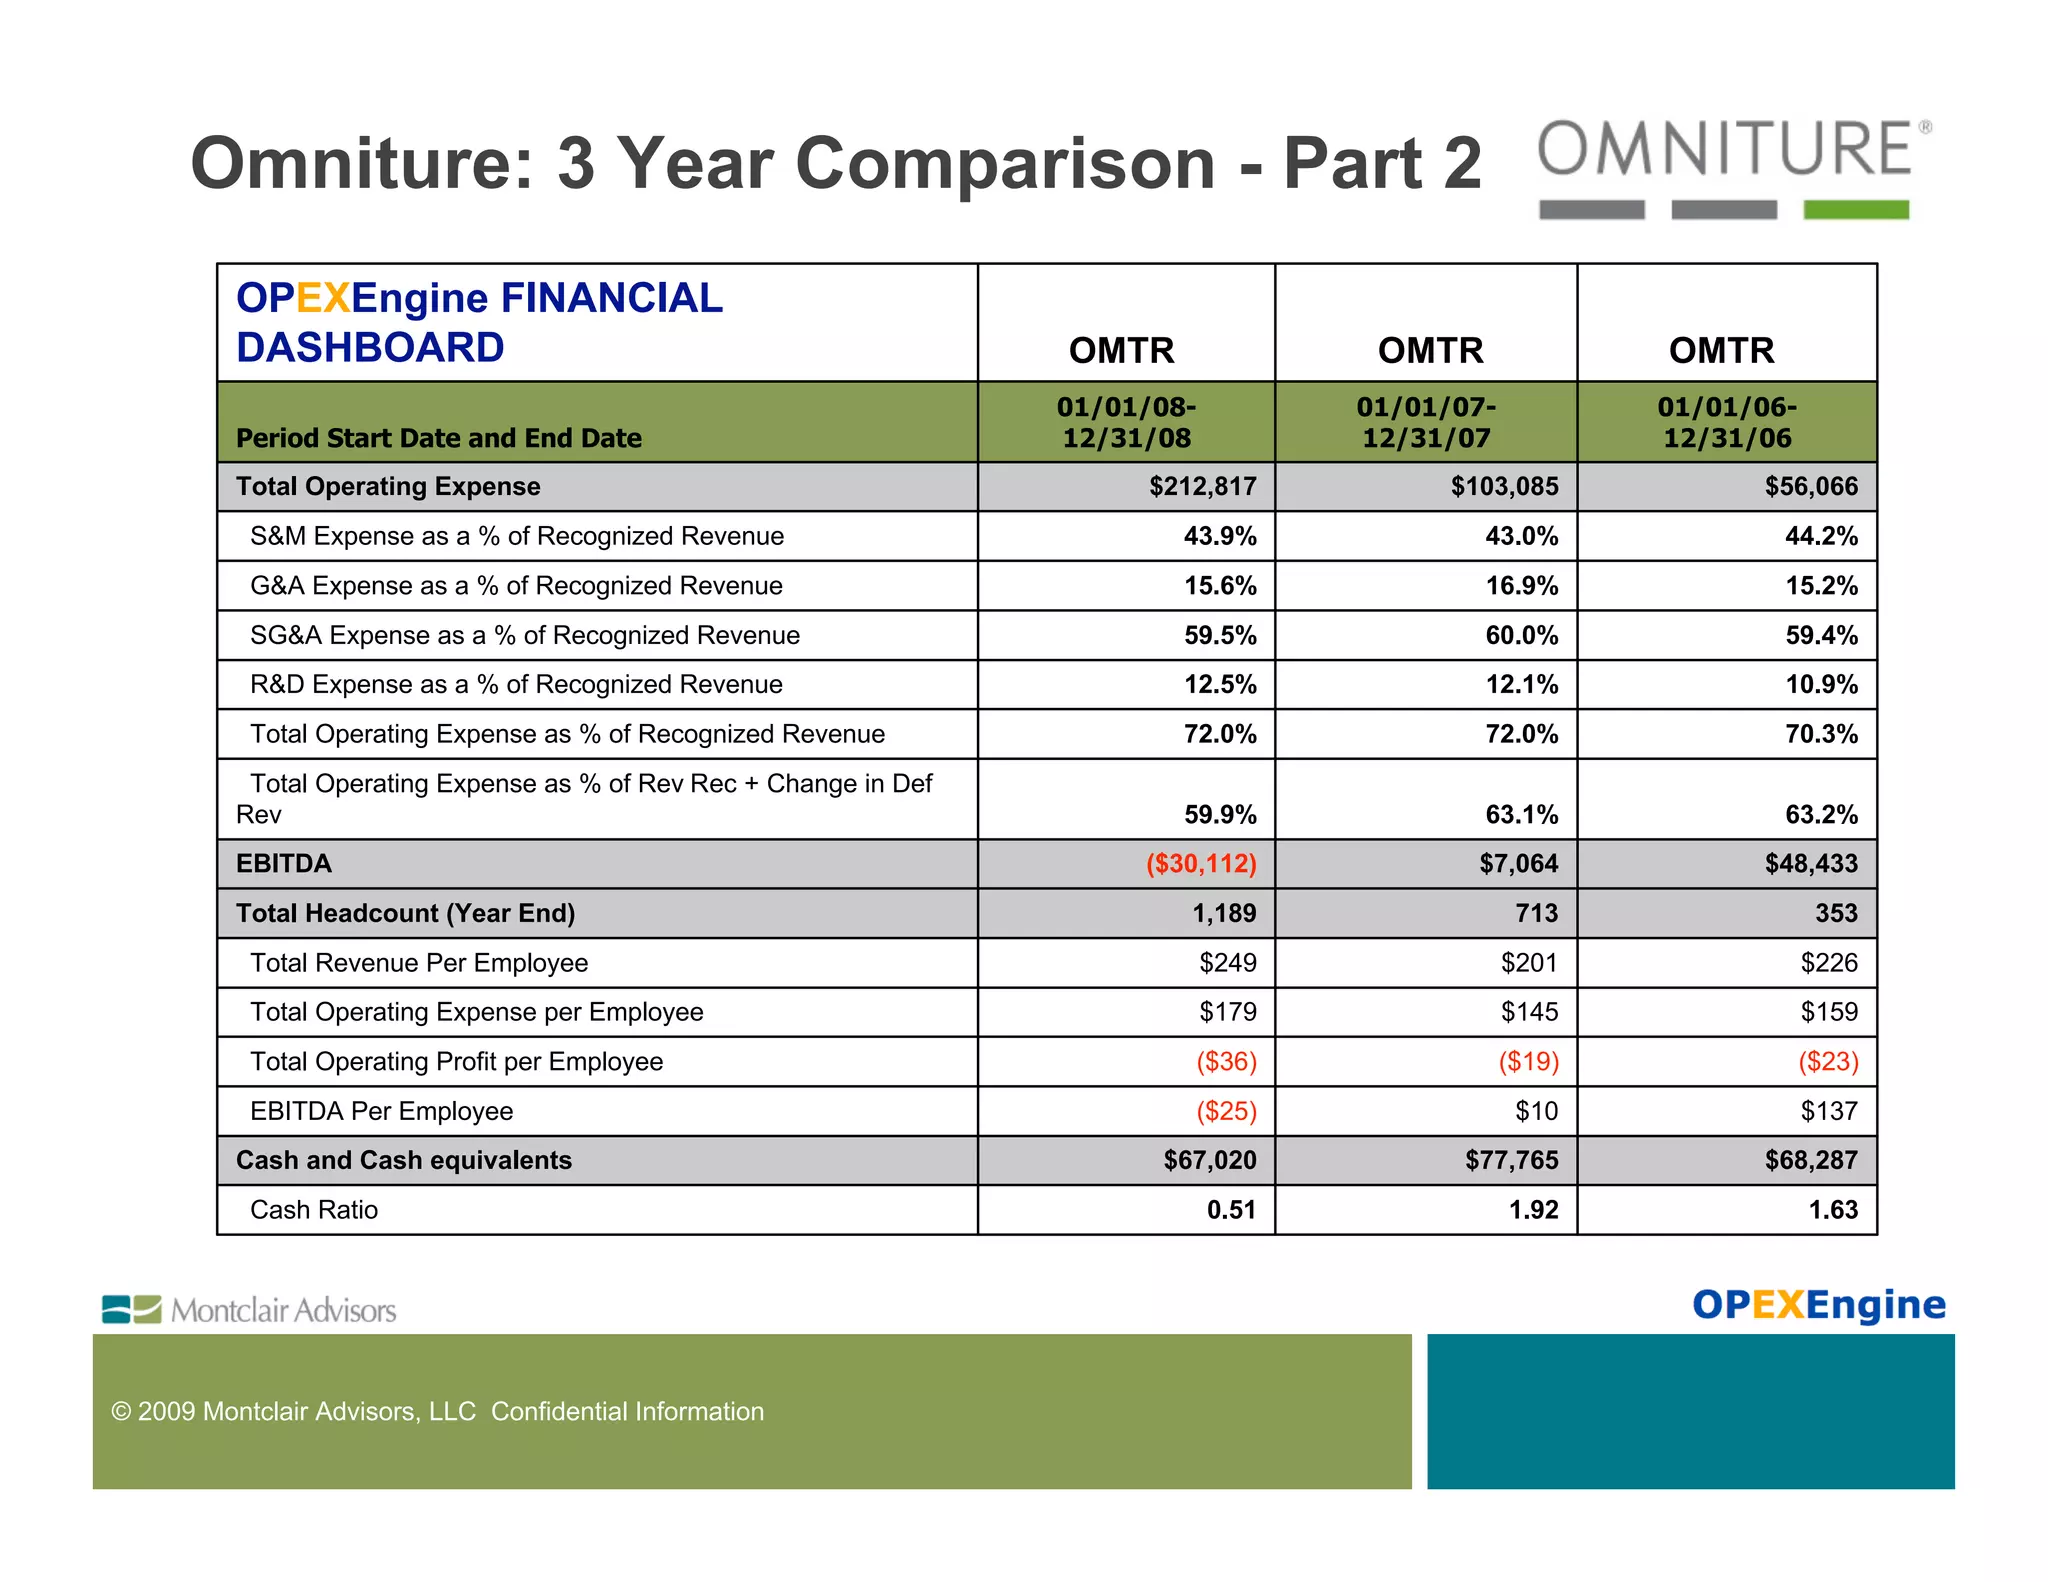
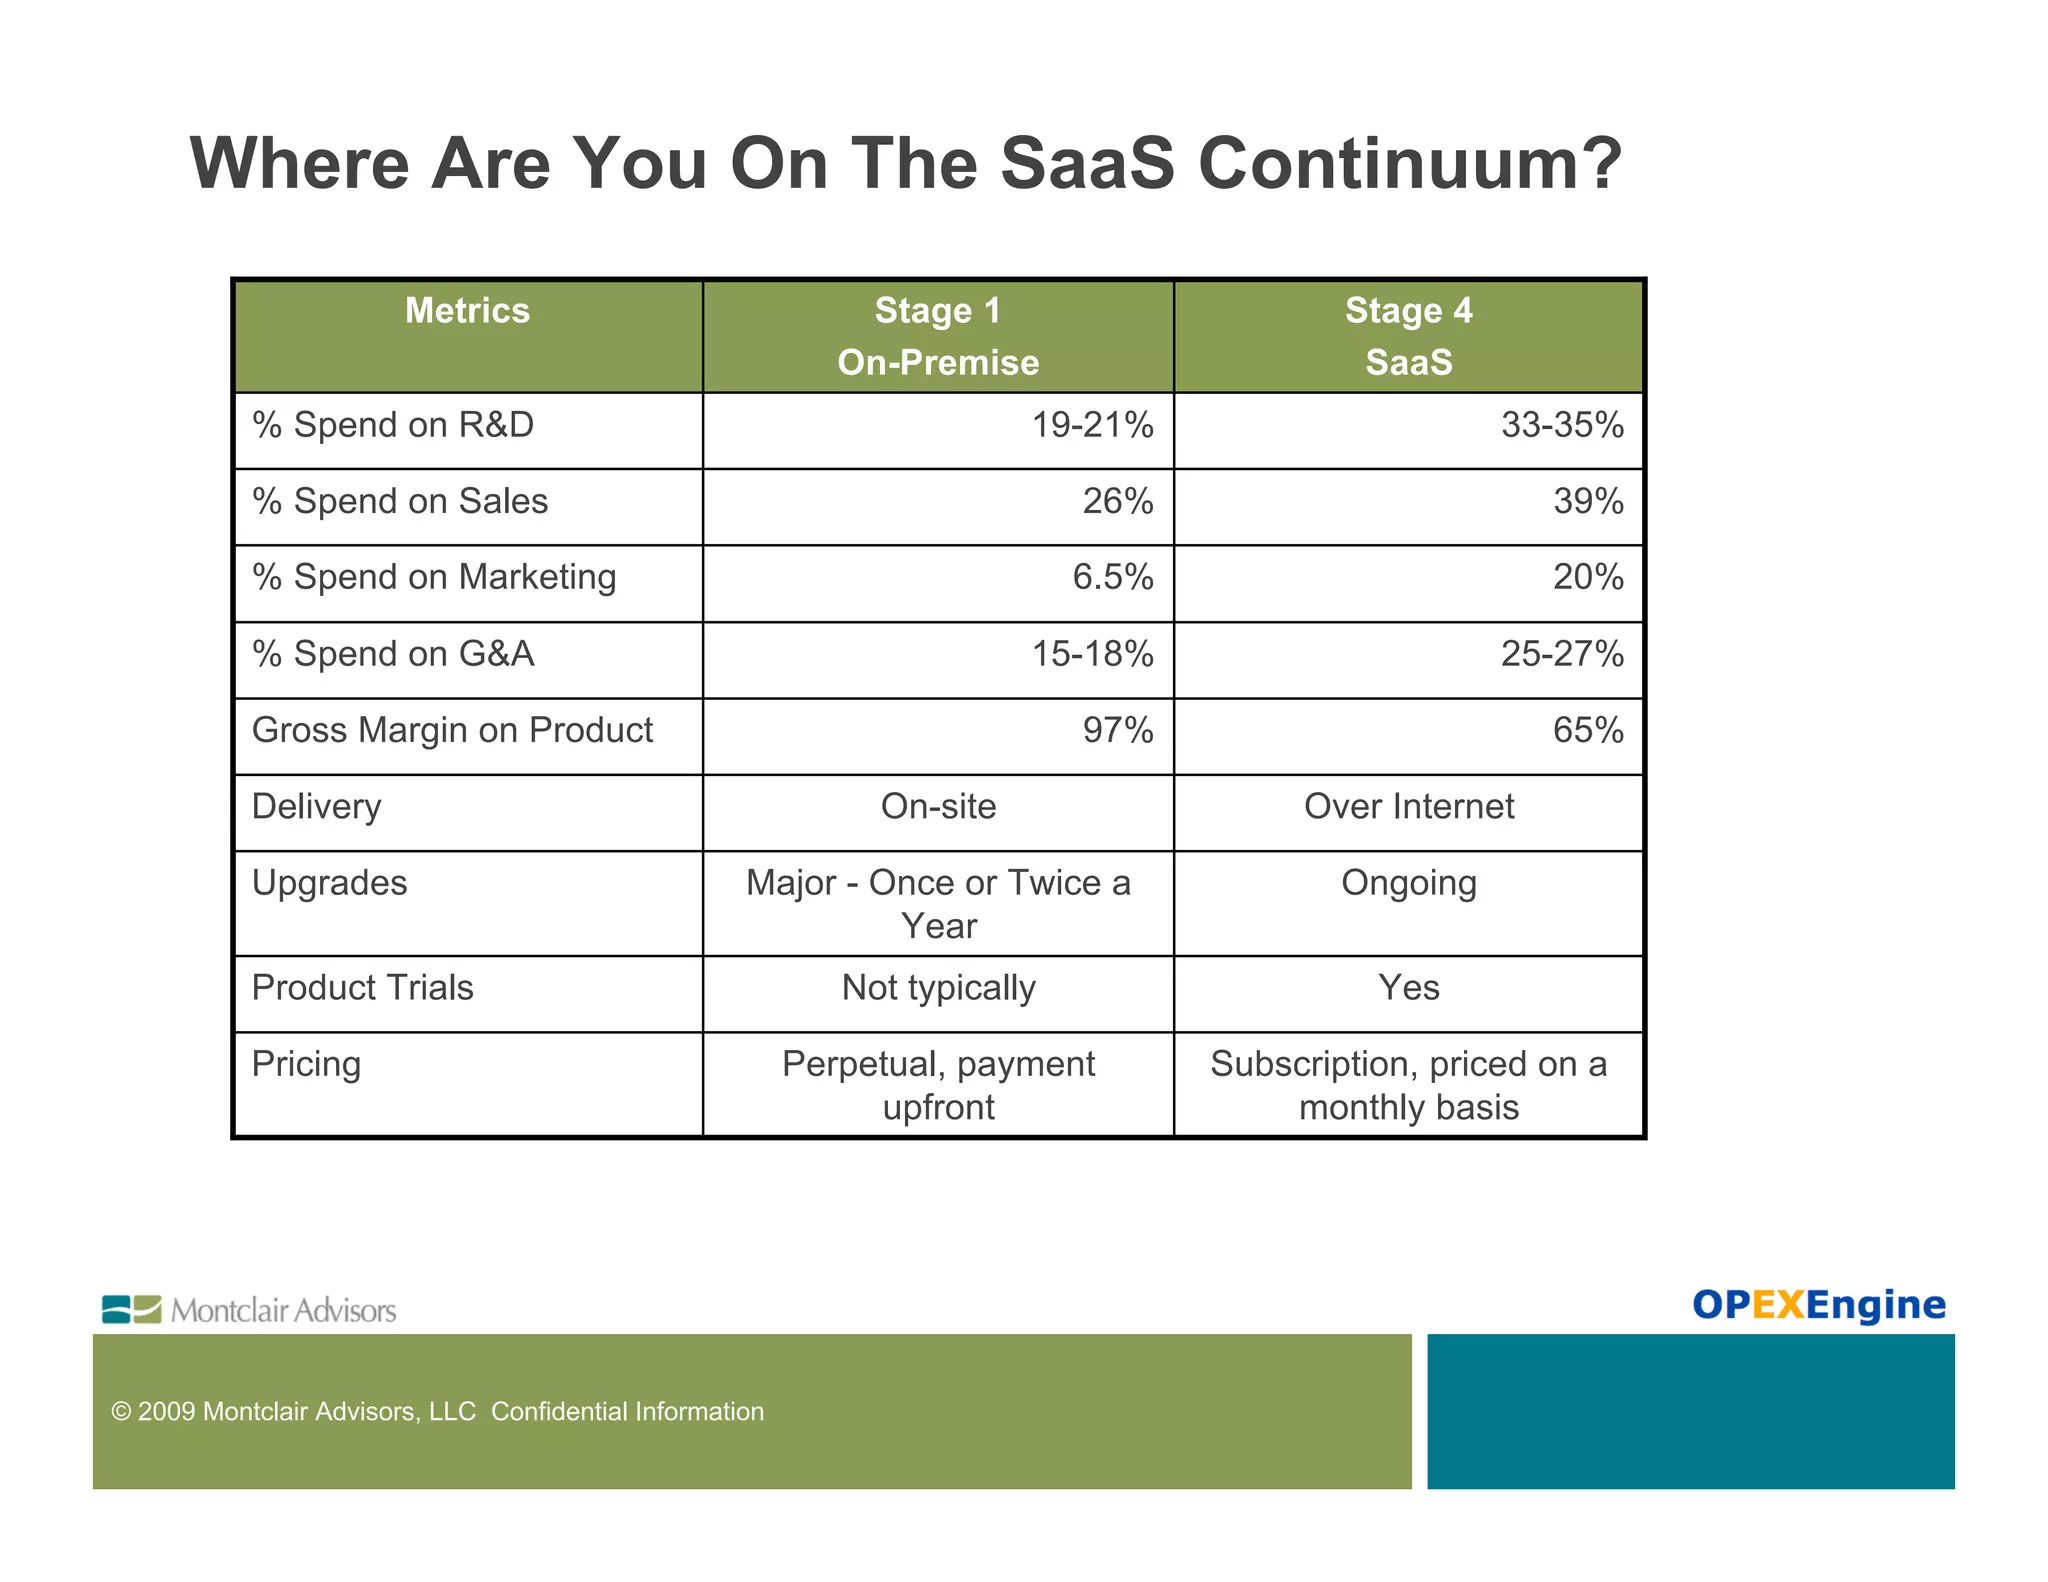

The document discusses the unique aspects of Software as a Service (SaaS) businesses, including cash flow, customer relationships, sales models, and management practices. It outlines a SaaS continuum ranging from on-premise solutions to multi-tenant cloud services and provides best practices for transitioning to a SaaS model. Additionally, it presents key metrics, revenue benchmarks, and financial comparisons of various SaaS companies to illustrate operational performance and growth.


