Download to read offline
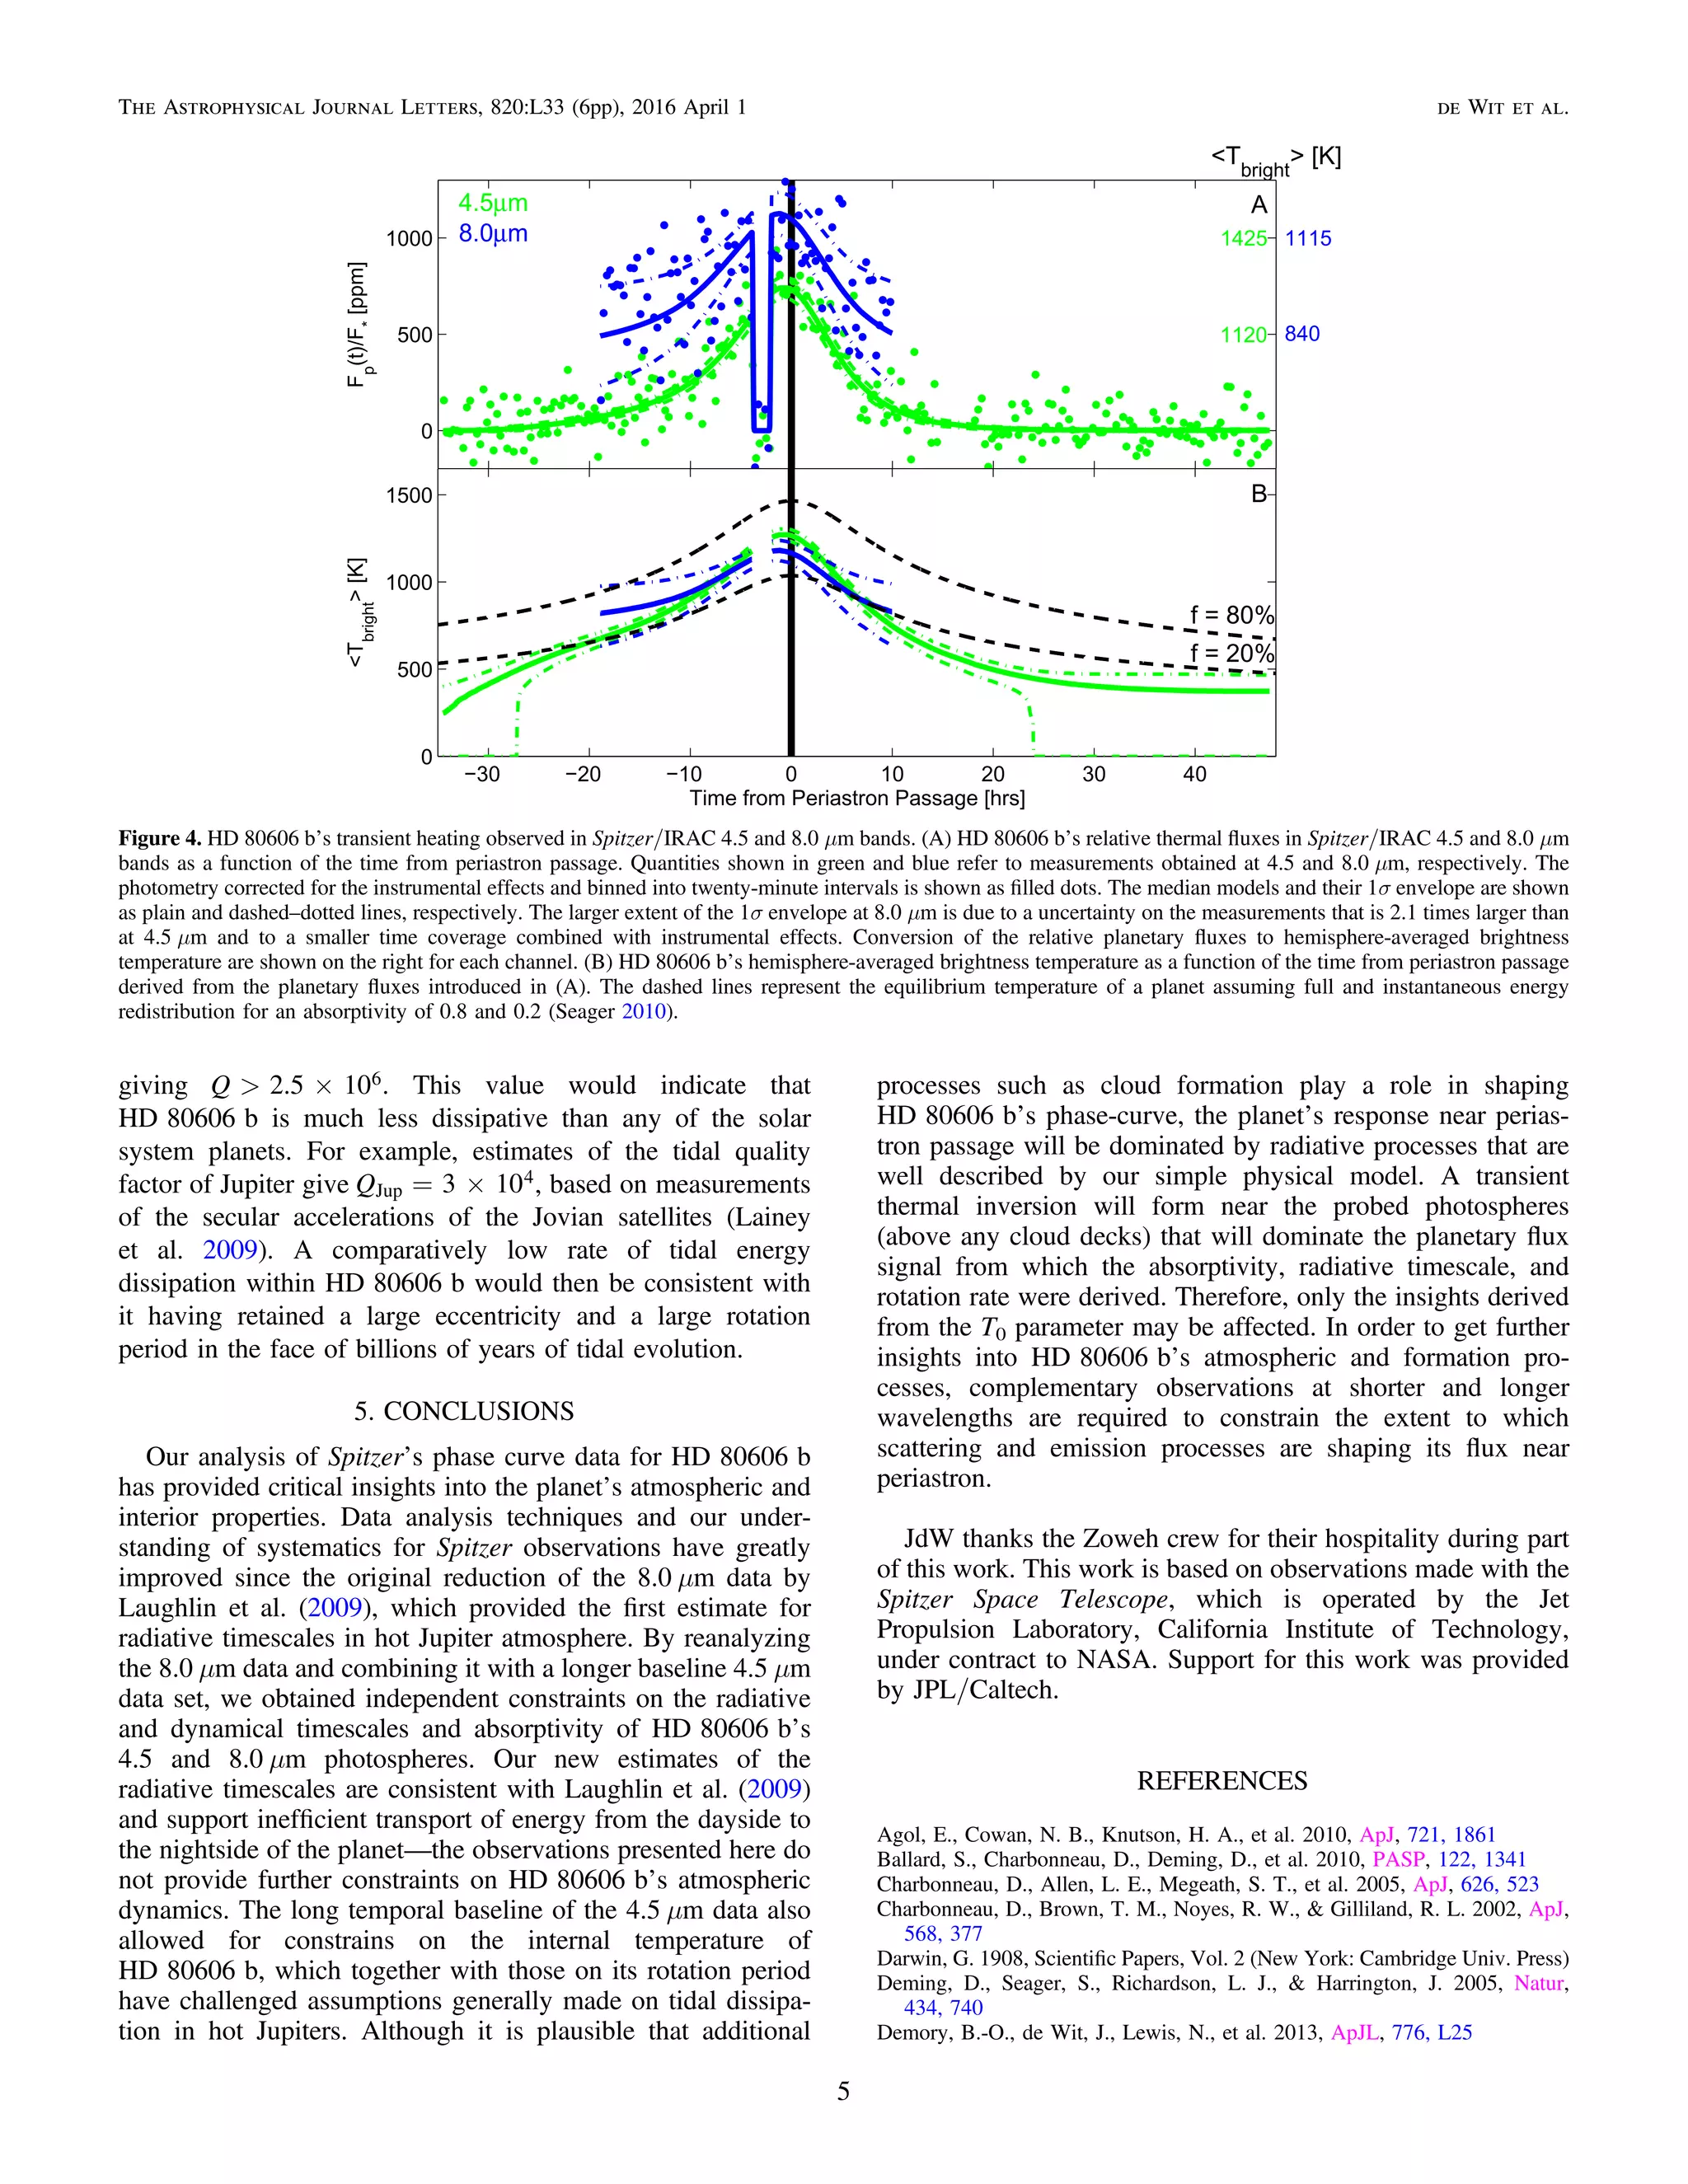

The study examines the atmosphere of the eccentric exoplanet HD 80606 b using multi-day photometric observations from the Spitzer Space Telescope. The findings reveal that the planet's atmosphere heats rapidly during its periastron passage, absorbing roughly 20% of incoming stellar flux and exhibiting a rotation period longer than predicted. This research contributes to understanding the atmospheric dynamics and properties of hot Jupiters, which remain poorly understood despite two decades of study.


