- Fossil fuels like oil, gas and coal still dominate global energy supply, though their shares are declining as renewable sources like solar and wind are growing quickly. Oil and gas are growing steadily while coal suffers a sharp decline.
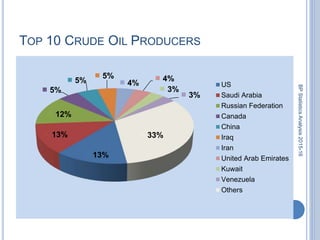
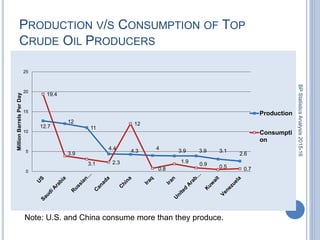
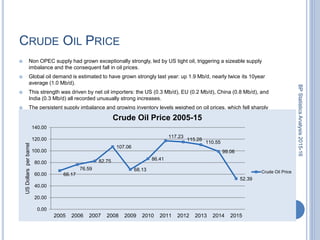
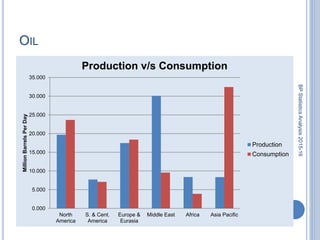
- The US and China are the top producers and consumers of oil, gas and coal. US and China consume more than they produce. Global demand for oil grew strongly in 2015 while supply remained high, keeping prices low.
- Natural gas consumption reached an all-time high in 2015 led by growing US production. Coal consumption declined sharply in 2015 due to declines in the US and China. Nuclear and hydroelectric output grew modestly while renewables like solar and wind grew substantially.