Downloaded 24 times
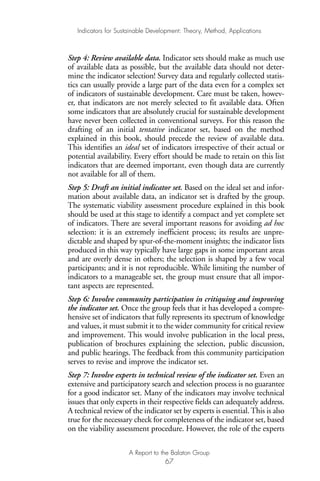
![17 H. Bossel, Earth at a crossroads: Paths to a sustainable future. (Cambridge:
Cambridge University Press, 1998) [German: Globale Wende – Wege zu einem
gesellschaftlichen und ökologischen Strukturwandel. Droemer-Knaur, Munich,
1998].
18 For a comprehensive database of indicator initiatives and publications, see L.
Pinter and P. Hardi, Performance measurement for sustainable development: A
compendium of experts, initiatives and publications. Winnipeg: International
Institute for Sustainable Development, 1995; and Moldan, Billharz and
Matravers,1997.
19 Bossel 1998, p. 38-40.
20 H. R. Maturana and F. J. Varela, 1987 (1984), The tree of knowledge: The bio-
logical roots of human understanding, (Shambhala: New Science Library,
1984). In his social systems theory, Luhmann (Baraldi et al. 1997) applies the
term also to cognitive and communicative processes.
21 For example, P. M. DeRusso, R. J. Roy and C. M. Close, State variables for
engineers, (New York: Wiley, 1965);
J. W. Forrester, Principles of systems, (Cambridge: Wright-Allen Press, 1968);
D. G., Luenberger, Introduction to dynamic system: Theory, models, applica-
tions, (New York: John Wiley., 1979); and
L. Padulo and M. A. Arbib, Systems theory: A unified state-space approach to
continuous and discrete systems, (Philadelphia: Saunders, 1974).
22 For example, Luhmann’s social systems theory, see Baraldi et al. 1997.
23 Webster’s 1962.
24 Webster’s 1962.
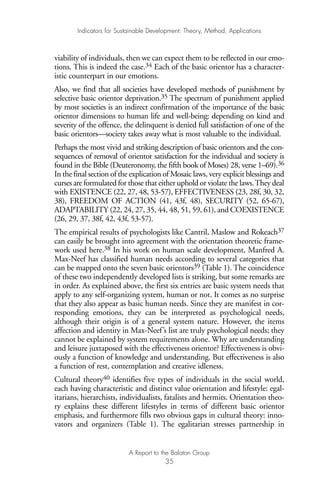
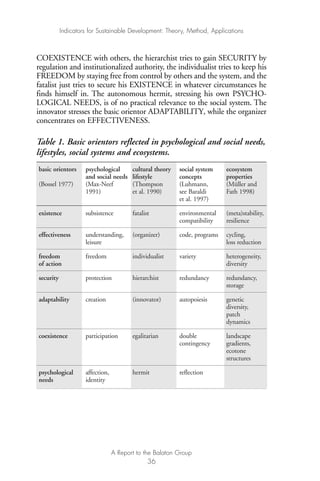
25 H. Bossel, “Orientors of nonroutine behaviour.” In H. Bossel (ed.), Concepts
and tools of computer-assisted policy analysis, (Basel: Birkhäuser, 1977), 227-265;
Bossel, “Viability and sustainability: Matching development goals to
resource constraints.” Futures, vol. 19, no. 2, 114-128, 1987; and
Bossel, Modeling and simulation, (Wellesley MA: A K Peters and Wiesbaden:
Vieweg, 1994).
26 Double contingency in terms of Luhmann’s theory of social systems (Baraldi
et al. 1997).
27 For example Bossel 1977; Bossel 1994.
Indicators for Sustainable Development: Theory, Method, Applications
A Report to the Balaton Group
113
Ind for SD - Balaton 12/21/98 4:20 PM Page 113](https://image.slidesharecdn.com/bossel-130816025050-phpapp02/85/Bossel-126-320.jpg)


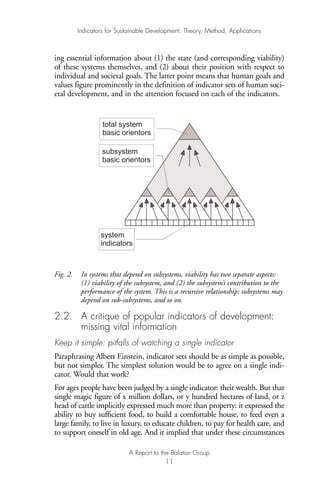
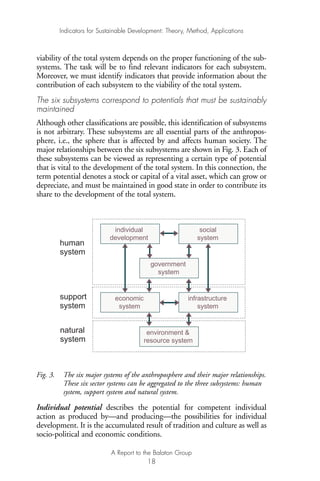
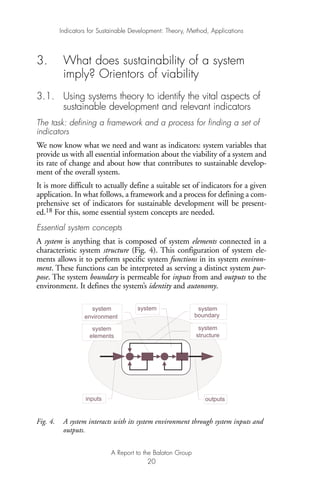
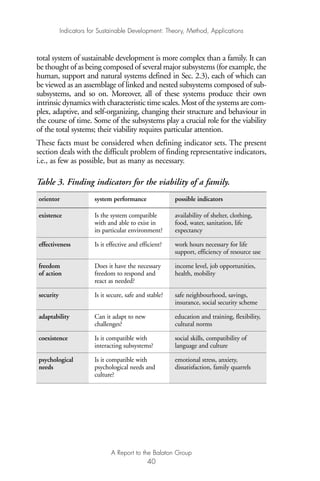
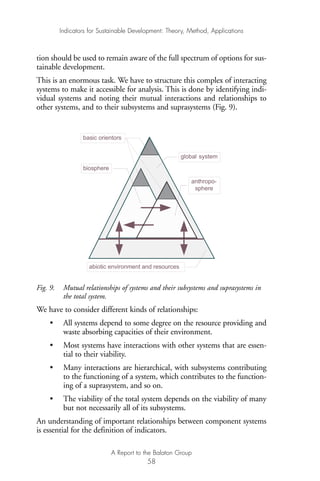
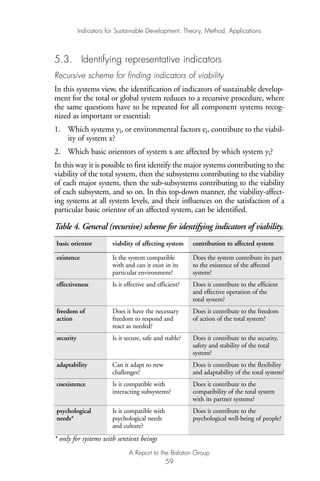
This document presents a theory and methodology for developing indicators of sustainable development. It argues that a systems approach is needed to identify appropriate indicators. The key aspects are: 1) Sustainable development involves the coevolution of human and natural systems, which can be analyzed as six interacting subsystems. 2) Systems theory concepts like basic orientors (goals) and viability can help define what to measure through indicators. 3) A procedure is outlined to conceptualize the total system, identify representative indicators for each orientor, and potentially quantify indicator performance over time. 4) Examples apply the framework to develop indicator sets for various scales from cities to global regions. The goal is a manageable set of indicators that


