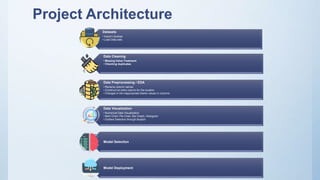
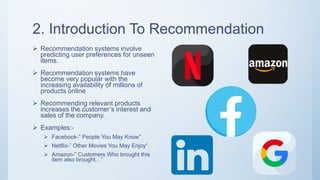
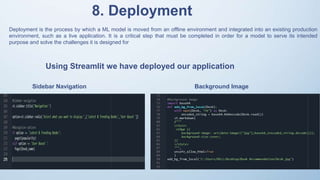
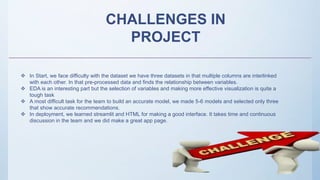
Book
Recommendations
System
Contents
1. Project Architecture
2. Introduction to Recommendation System
3. Data set Details
4. Data preprocessing and Eda
5. Visualization
6. Details about recommendation techniques
7. Model selection
8. Deployment
Project Architecture
Datasets
• Import Libraries
• Load Data-sets
Data Cleaning
• Missing Value Treatment
• Checking duplicates
Data Preprocessing / EDA
• Rename column names
• Construct an extra column for the location
• Changes in the inappropriate blanks values in columns
Data Visualization
• Numerical Data Visualization
• Barh Chart, Pie-Chart, Bar Graph, Histogram
• Outliers Detection through Boxplot
Model Selection
Model Deployment
2. Introduction To Recommendation
 Recommendation systems involve
predicting user preferences for unseen
items.
 Recommendation systems have
become very popular with the
increasing availability of millions of
products online
 Recommending relevant products
increases the customer’s interest and
sales of the company.
 Examples:-
 Facebook-” People You May Know”
 Netflix-” Other Movies You May Enjoy”
 Amazon-” Customers Who brought this
item also brought…”
3. Datasets Details
Book Dataset
• No. of rows:-271360
• No. of columns:-8
Users Dataset
• No. of rows:-278858
• No. of columns:-3
Rating Dataset
• No. of rows:-1149780
• No. of columns:-3
4. Data Preprocessing
In Books Dataset
 Checking of null values and
missing data.
 Removal of two columns of
small image URL and large
image URL.
 Changing column names for
easy recognition.
 In the publisher column
missing value with others.
 In the Year Of Publication
column we have two object
data DK Publishing Inc
replaced this with 2000 and
Gallimard replace it with
2003.
In Users Dataset
 In the Users dataset in the
Age column we find unique
values and with that, we
calculate the mean age.
 In the Location columns, we
have combined information
about the city, state, and
country we split this
information into three different
columns.
In Rating Dataset
 In this data set we check
Book-rating and User-Id are
columns that are numerical
type.
 In the ISBN column we
remove extra characters.
Final Dataset Details
Datasets
• Final Dataset
• After merging
of all three
preprocessed
datasets
Rows And
Columns
• 50815 Rows
• 8 Columns
No. Of Unique
User-ID
• 95513
Null Values
• Total null
values of all
3 datasets
are6
Data Types
• Int(32) 1
columns
• Object 8
columns
After applying preprocessing on all three datasets. We merge all and made the final data set for
visualization and model building.
5. Visualization
 Outliers
 There are many outliers in age columns
 Outliers are treated with mean values.
 Graphical representation of top
10 books
 In Histogram represents
the Year Of Publication
• From 1990 to 2005 we saw
there are many publishers.
 Top 7 Publishers With the
Most Books
 Top 7 Countries With the Most
Users
 Divide the complete dataset based on implicit and explicit
ratings.
• In the Explicit dataset we get a rating above zero
• In the Implicit dataset we get a rating of zero.
• So we select the Explicit dataset.
• In Explicit rating we find that more people rated above 6 and most of the people rated 8.
 Below Histogram
Represents the age of
users.  Top 15 Highest Reader From Countries
 Top 20 Publisher With The Most Book
• Aged between 30 to 40
most users read books.
6. Recommendation Techniques
6.1 Popularity-Based Recommendation System :-
It is a type of recommendation system which works on the principle of popularity and or anything which is in trend. These
systems check the product, movies, or books that are in trend or are most popular among the users and directly
recommend those.
 Advantage of popularity-based recommendation system
 There is no need for the user’s historical data.
 Disadvantage popularity-based recommendation system
 The system would recommend the same sort of products/books which are solely based on popularity to every other
user.
Popularity-Based Recommendation System Dataframe
6.2 Content-Based Filtering:-
A content-based recommender works with data that the user provides, either explicitly
(rating) or implicitly (clicking on a link). Based on that data, a user profile is generated,
which is then used to make suggestions to the user.
 Advantage of content-based recommendation system
 Able to recommend users with unique tastes.
 Can explain the recommendation.
 Disadvantage of content-based recommendation system
 Data should be in a structured format.
 Unable to use quality judgments from other users.
Content-Base Filtering Result
6.3 Collaborative Filtering:-
Collaborative filtering is used by most recommendation systems to find similar patterns or information of
the users, this technique can filter out items that users like on the basis of the ratings or reactions by
similar users.
 Advantages of collaborative filtering
 Other user scores are used.
 No deterministic result since chance is involved in the system.
 Disadvantages of collaborative filtering
 Needs more data.
 Problems with new users and new products.
Result Of Collaborative Filtering
Deployment is the process by which a ML model is moved from an offline environment and integrated into an existing production
environment, such as a live application. It is a critical step that must be completed in order for a model to serve its intended
purpose and solve the challenges it is designed for
8. Deployment
Using Streamlit we have deployed our application
Sidebar Navigation Background Image
CHALLENGES IN
PROJECT
 In Start, we face difficulty with the dataset we have three datasets in that multiple columns are interlinked
with each other. In that pre-processed data and finds the relationship between variables.
 EDA is an interesting part but the selection of variables and making more effective visualization is quite a
tough task
 A most difficult task for the team to build an accurate model, we made 5-6 models and selected only three
that show accurate recommendations.
 In deployment, we learned streamlit and HTML for making a good interface. It takes time and continuous
discussion in the team and we did make a great app page.
References
 Pandas documentation link:- https://pandas.pydata.org/docs/getting_started/index.html
 Matplotlib documentation:- https://matplotlib.org/stable/index.html
 Streamlit documentation:- https://docs.streamlit.io/library/get-started/main-concepts
 Kaggle.com
 KNN documentation:- https://scikit-
learn.org/stable/modules/generated/sklearn.neighbors.KNeighborsClassifier.html
bookrecommendations-230615063942-3b1016c9 (1).pdf

bookrecommendations-230615063942-3b1016c9 (1).pdf

  • 1.
  • 2.
    Contents 1. Project Architecture 2.Introduction to Recommendation System 3. Data set Details 4. Data preprocessing and Eda 5. Visualization 6. Details about recommendation techniques 7. Model selection 8. Deployment
  • 3.
    Project Architecture Datasets • ImportLibraries • Load Data-sets Data Cleaning • Missing Value Treatment • Checking duplicates Data Preprocessing / EDA • Rename column names • Construct an extra column for the location • Changes in the inappropriate blanks values in columns Data Visualization • Numerical Data Visualization • Barh Chart, Pie-Chart, Bar Graph, Histogram • Outliers Detection through Boxplot Model Selection Model Deployment
  • 4.
    2. Introduction ToRecommendation  Recommendation systems involve predicting user preferences for unseen items.  Recommendation systems have become very popular with the increasing availability of millions of products online  Recommending relevant products increases the customer’s interest and sales of the company.  Examples:-  Facebook-” People You May Know”  Netflix-” Other Movies You May Enjoy”  Amazon-” Customers Who brought this item also brought…”
  • 5.
    3. Datasets Details BookDataset • No. of rows:-271360 • No. of columns:-8 Users Dataset • No. of rows:-278858 • No. of columns:-3 Rating Dataset • No. of rows:-1149780 • No. of columns:-3
  • 6.
    4. Data Preprocessing InBooks Dataset  Checking of null values and missing data.  Removal of two columns of small image URL and large image URL.  Changing column names for easy recognition.  In the publisher column missing value with others.  In the Year Of Publication column we have two object data DK Publishing Inc replaced this with 2000 and Gallimard replace it with 2003. In Users Dataset  In the Users dataset in the Age column we find unique values and with that, we calculate the mean age.  In the Location columns, we have combined information about the city, state, and country we split this information into three different columns. In Rating Dataset  In this data set we check Book-rating and User-Id are columns that are numerical type.  In the ISBN column we remove extra characters.
  • 7.
    Final Dataset Details Datasets •Final Dataset • After merging of all three preprocessed datasets Rows And Columns • 50815 Rows • 8 Columns No. Of Unique User-ID • 95513 Null Values • Total null values of all 3 datasets are6 Data Types • Int(32) 1 columns • Object 8 columns After applying preprocessing on all three datasets. We merge all and made the final data set for visualization and model building.
  • 8.
    5. Visualization  Outliers There are many outliers in age columns  Outliers are treated with mean values.  Graphical representation of top 10 books  In Histogram represents the Year Of Publication • From 1990 to 2005 we saw there are many publishers.
  • 9.
     Top 7Publishers With the Most Books  Top 7 Countries With the Most Users  Divide the complete dataset based on implicit and explicit ratings. • In the Explicit dataset we get a rating above zero • In the Implicit dataset we get a rating of zero. • So we select the Explicit dataset. • In Explicit rating we find that more people rated above 6 and most of the people rated 8.
  • 10.
     Below Histogram Representsthe age of users.  Top 15 Highest Reader From Countries  Top 20 Publisher With The Most Book • Aged between 30 to 40 most users read books.
  • 11.
    6. Recommendation Techniques 6.1Popularity-Based Recommendation System :- It is a type of recommendation system which works on the principle of popularity and or anything which is in trend. These systems check the product, movies, or books that are in trend or are most popular among the users and directly recommend those.  Advantage of popularity-based recommendation system  There is no need for the user’s historical data.  Disadvantage popularity-based recommendation system  The system would recommend the same sort of products/books which are solely based on popularity to every other user.
  • 12.
  • 13.
    6.2 Content-Based Filtering:- Acontent-based recommender works with data that the user provides, either explicitly (rating) or implicitly (clicking on a link). Based on that data, a user profile is generated, which is then used to make suggestions to the user.  Advantage of content-based recommendation system  Able to recommend users with unique tastes.  Can explain the recommendation.  Disadvantage of content-based recommendation system  Data should be in a structured format.  Unable to use quality judgments from other users.
  • 14.
  • 15.
    6.3 Collaborative Filtering:- Collaborativefiltering is used by most recommendation systems to find similar patterns or information of the users, this technique can filter out items that users like on the basis of the ratings or reactions by similar users.  Advantages of collaborative filtering  Other user scores are used.  No deterministic result since chance is involved in the system.  Disadvantages of collaborative filtering  Needs more data.  Problems with new users and new products.
  • 16.
  • 17.
    Deployment is theprocess by which a ML model is moved from an offline environment and integrated into an existing production environment, such as a live application. It is a critical step that must be completed in order for a model to serve its intended purpose and solve the challenges it is designed for 8. Deployment Using Streamlit we have deployed our application Sidebar Navigation Background Image
  • 19.
    CHALLENGES IN PROJECT  InStart, we face difficulty with the dataset we have three datasets in that multiple columns are interlinked with each other. In that pre-processed data and finds the relationship between variables.  EDA is an interesting part but the selection of variables and making more effective visualization is quite a tough task  A most difficult task for the team to build an accurate model, we made 5-6 models and selected only three that show accurate recommendations.  In deployment, we learned streamlit and HTML for making a good interface. It takes time and continuous discussion in the team and we did make a great app page.
  • 20.
    References  Pandas documentationlink:- https://pandas.pydata.org/docs/getting_started/index.html  Matplotlib documentation:- https://matplotlib.org/stable/index.html  Streamlit documentation:- https://docs.streamlit.io/library/get-started/main-concepts  Kaggle.com  KNN documentation:- https://scikit- learn.org/stable/modules/generated/sklearn.neighbors.KNeighborsClassifier.html