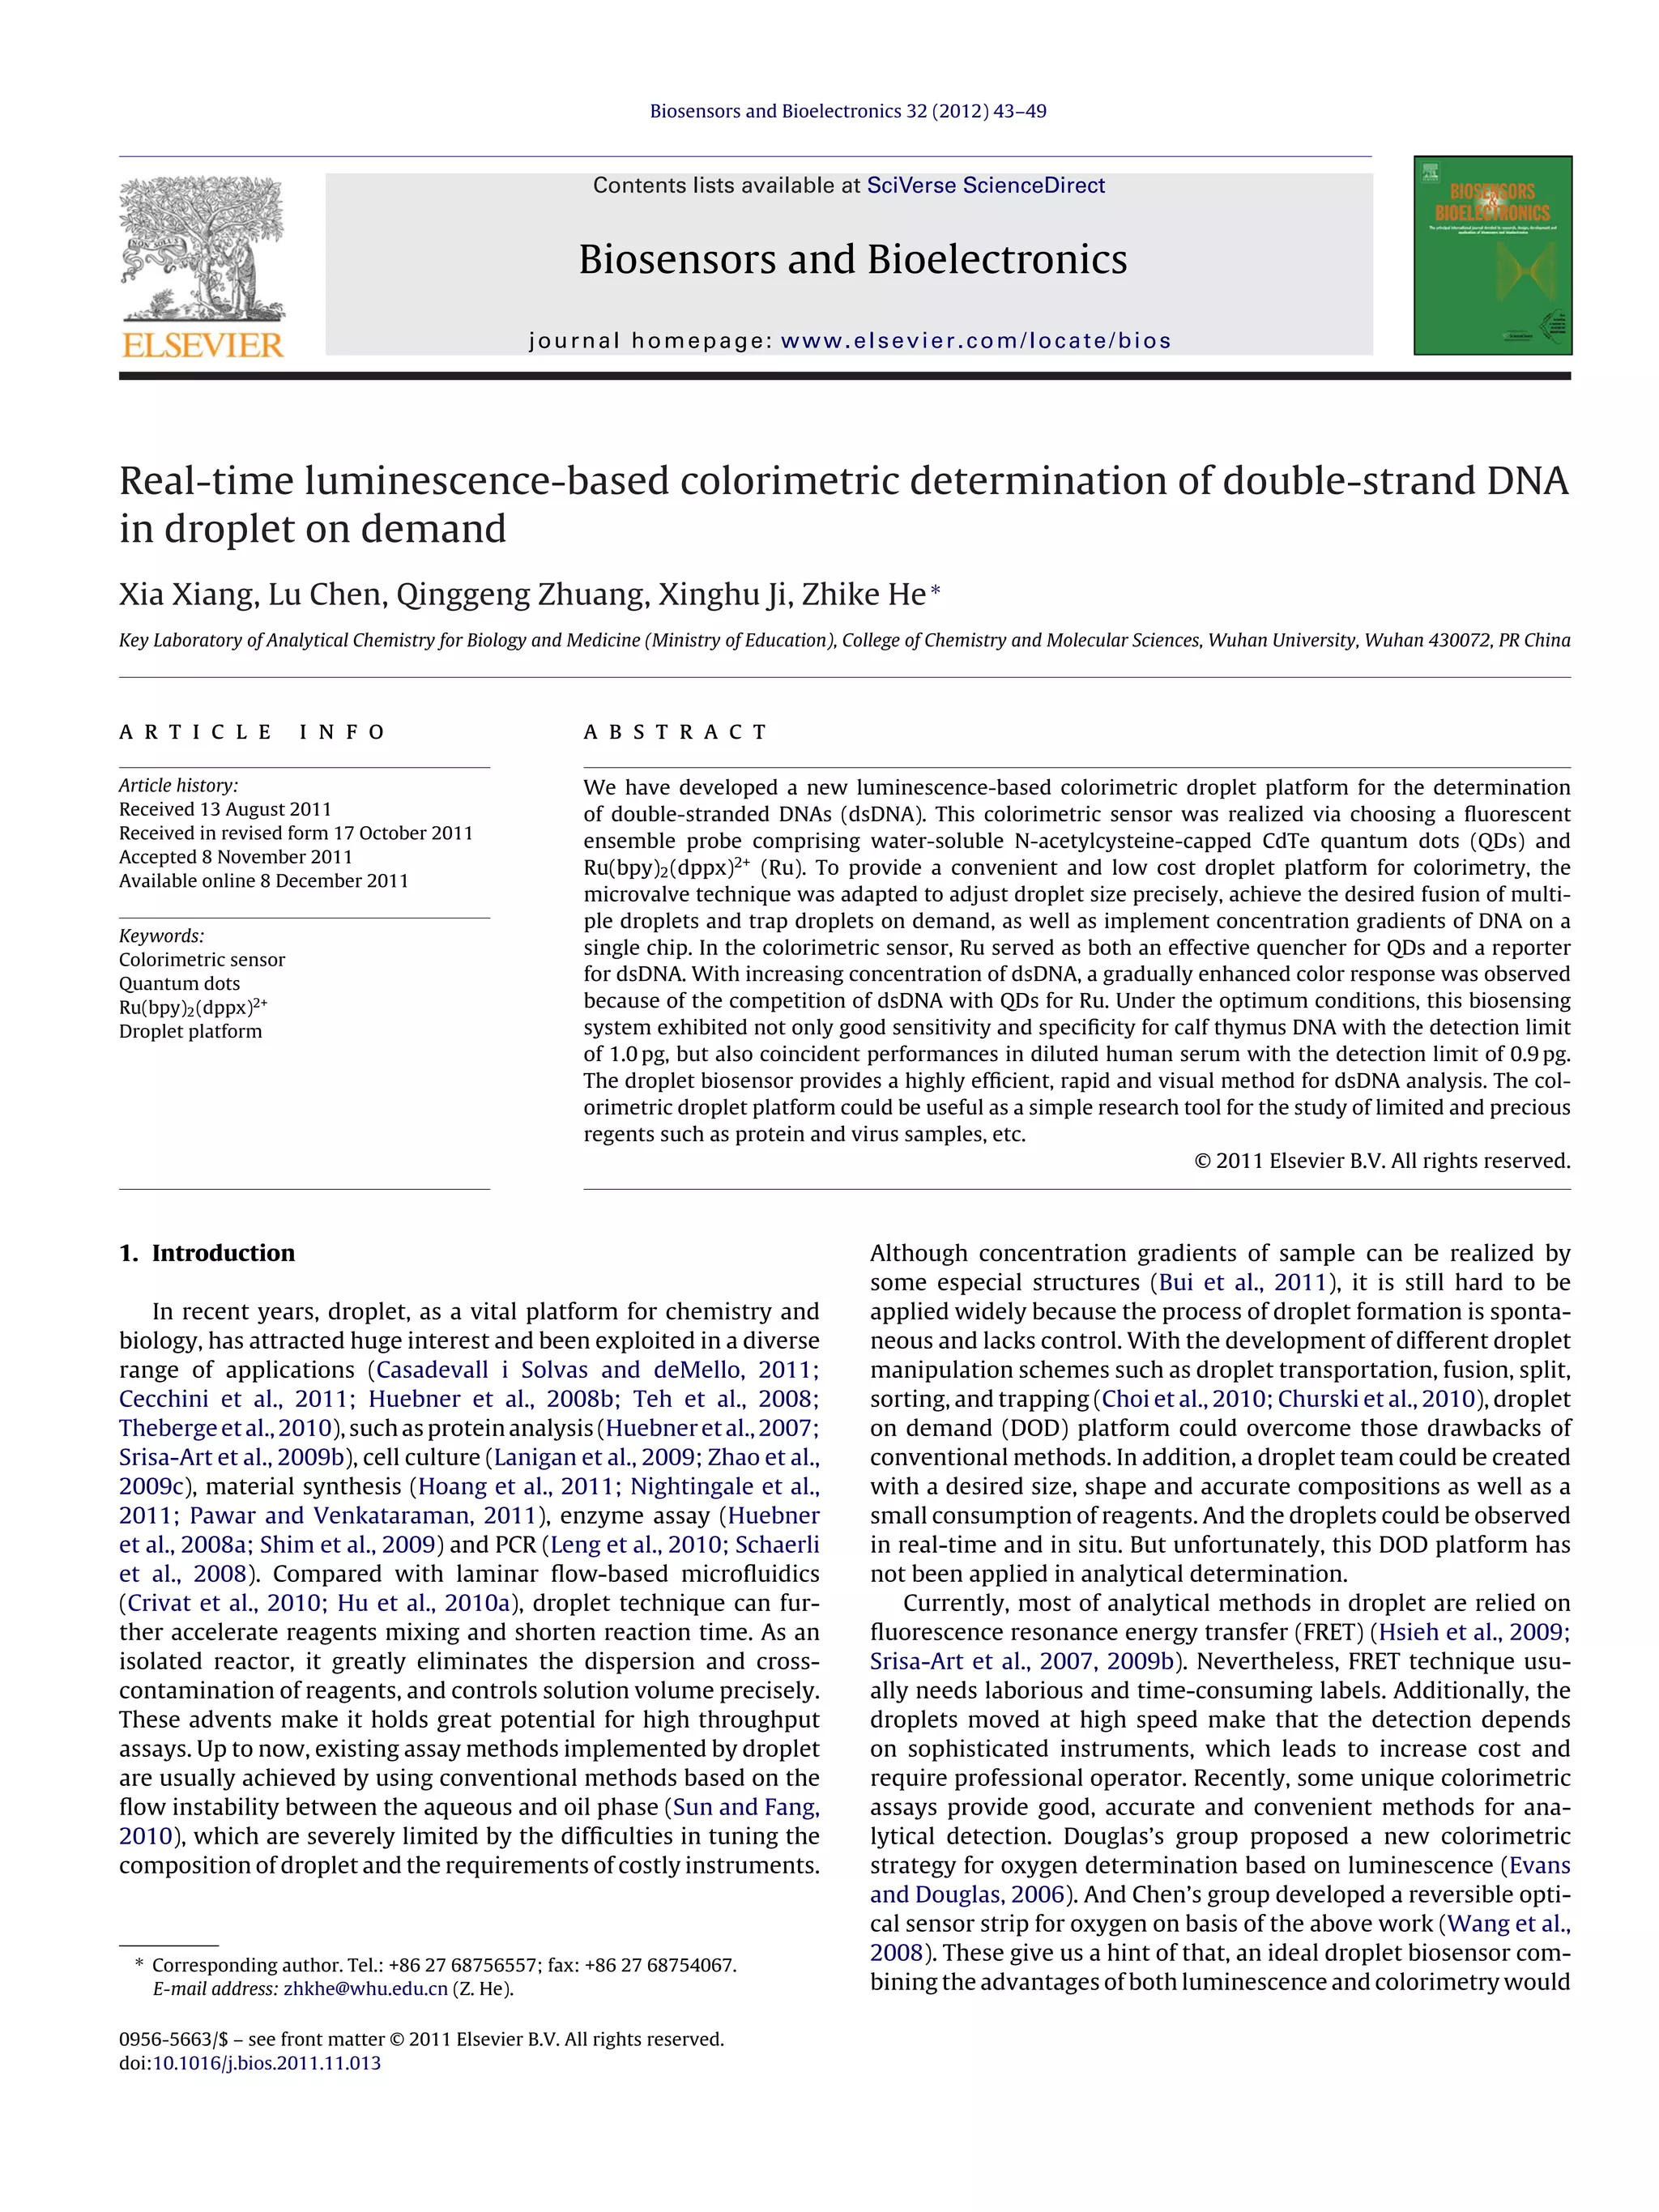
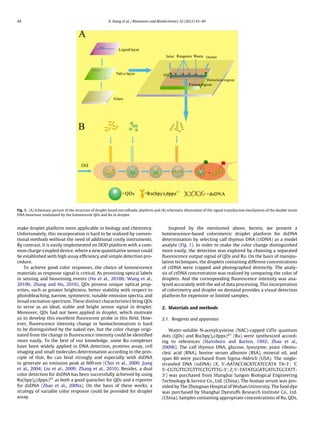
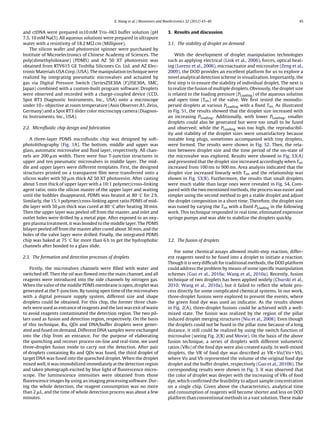
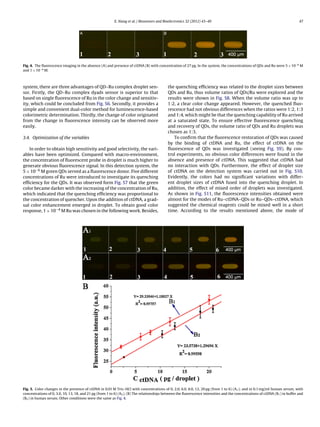
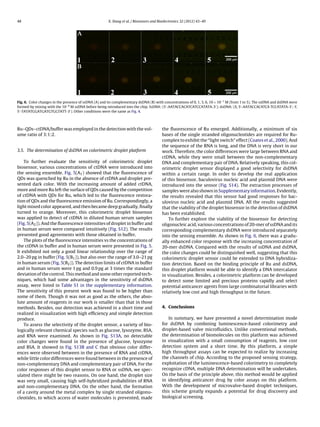
Biosensors and Bioelectronics 32 (2012) 43–49
Contents lists available at SciVerse ScienceDirect
Biosensors and Bioelectronics
journal homepage: www.elsevier.com/locate/bios
Real-time luminescence-based colorimetric determination of double-strand DNA
in droplet on demand
Xia Xiang, Lu Chen, Qinggeng Zhuang, Xinghu Ji, Zhike He∗
Key Laboratory of Analytical Chemistry for Biology and Medicine (Ministry of Education), College of Chemistry and Molecular Sciences, Wuhan University, Wuhan 430072, PR China
a r t i c l e i n f o
Article history:
Received 13 August 2011
Received in revised form 17 October 2011
Accepted 8 November 2011
Available online 8 December 2011
Keywords:
Colorimetric sensor
Quantum dots
Ru(bpy)2(dppx)2+
Droplet platform
a b s t r a c t
We have developed a new luminescence-based colorimetric droplet platform for the determination
of double-stranded DNAs (dsDNA). This colorimetric sensor was realized via choosing a fluorescent
ensemble probe comprising water-soluble N-acetylcysteine-capped CdTe quantum dots (QDs) and
Ru(bpy)2(dppx)2+
(Ru). To provide a convenient and low cost droplet platform for colorimetry, the
microvalve technique was adapted to adjust droplet size precisely, achieve the desired fusion of multi-
ple droplets and trap droplets on demand, as well as implement concentration gradients of DNA on a
single chip. In the colorimetric sensor, Ru served as both an effective quencher for QDs and a reporter
for dsDNA. With increasing concentration of dsDNA, a gradually enhanced color response was observed
because of the competition of dsDNA with QDs for Ru. Under the optimum conditions, this biosensing
system exhibited not only good sensitivity and specificity for calf thymus DNA with the detection limit
of 1.0 pg, but also coincident performances in diluted human serum with the detection limit of 0.9 pg.
The droplet biosensor provides a highly efficient, rapid and visual method for dsDNA analysis. The col-
orimetric droplet platform could be useful as a simple research tool for the study of limited and precious
regents such as protein and virus samples, etc.
© 2011 Elsevier B.V. All rights reserved.
1. Introduction
In recent years, droplet, as a vital platform for chemistry and
biology, has attracted huge interest and been exploited in a diverse
range of applications (Casadevall i Solvas and deMello, 2011;
Cecchini et al., 2011; Huebner et al., 2008b; Teh et al., 2008;
Theberge et al., 2010), such as protein analysis (Huebner et al., 2007;
Srisa-Art et al., 2009b), cell culture (Lanigan et al., 2009; Zhao et al.,
2009c), material synthesis (Hoang et al., 2011; Nightingale et al.,
2011; Pawar and Venkataraman, 2011), enzyme assay (Huebner
et al., 2008a; Shim et al., 2009) and PCR (Leng et al., 2010; Schaerli
et al., 2008). Compared with laminar flow-based microfluidics
(Crivat et al., 2010; Hu et al., 2010a), droplet technique can fur-
ther accelerate reagents mixing and shorten reaction time. As an
isolated reactor, it greatly eliminates the dispersion and cross-
contamination of reagents, and controls solution volume precisely.
These advents make it holds great potential for high throughput
assays. Up to now, existing assay methods implemented by droplet
are usually achieved by using conventional methods based on the
flow instability between the aqueous and oil phase (Sun and Fang,
2010), which are severely limited by the difficulties in tuning the
composition of droplet and the requirements of costly instruments.
∗ Corresponding author. Tel.: +86 27 68756557; fax: +86 27 68754067.
E-mail address: zhkhe@whu.edu.cn (Z. He).
Although concentration gradients of sample can be realized by
some especial structures (Bui et al., 2011), it is still hard to be
applied widely because the process of droplet formation is sponta-
neous and lacks control. With the development of different droplet
manipulation schemes such as droplet transportation, fusion, split,
sorting, and trapping (Choi et al., 2010; Churski et al., 2010), droplet
on demand (DOD) platform could overcome those drawbacks of
conventional methods. In addition, a droplet team could be created
with a desired size, shape and accurate compositions as well as a
small consumption of reagents. And the droplets could be observed
in real-time and in situ. But unfortunately, this DOD platform has
not been applied in analytical determination.
Currently, most of analytical methods in droplet are relied on
fluorescence resonance energy transfer (FRET) (Hsieh et al., 2009;
Srisa-Art et al., 2007, 2009b). Nevertheless, FRET technique usu-
ally needs laborious and time-consuming labels. Additionally, the
droplets moved at high speed make that the detection depends
on sophisticated instruments, which leads to increase cost and
require professional operator. Recently, some unique colorimetric
assays provide good, accurate and convenient methods for ana-
lytical detection. Douglas’s group proposed a new colorimetric
strategy for oxygen determination based on luminescence (Evans
and Douglas, 2006). And Chen’s group developed a reversible opti-
cal sensor strip for oxygen on basis of the above work (Wang et al.,
2008). These give us a hint of that, an ideal droplet biosensor com-
bining the advantages of both luminescence and colorimetry would
0956-5663/$ – see front matter © 2011 Elsevier B.V. All rights reserved.
doi:10.1016/j.bios.2011.11.013
44 X. Xiang et al. / Biosensors and Bioelectronics 32 (2012) 43–49
Fig. 1. (A) Schematic picture of the structure of droplet based microfluidic platform and (B) schematic illustration of the signal transduction mechanism of the double strain
DNA biosensor modulated by the luminescent QDs and Ru in droplet.
make droplet platform more applicable in biology and chemistry.
Unfortunately, this incorporation is hard to be realized by conven-
tional methods without the need of additional costly instruments.
By contrast, it is easily implemented on DOD platform with a com-
mon charge-coupled device, where a new quantitative sensor could
be established with high assay efficiency and simple detection pro-
cedure.
To achieve good color responses, the choice of luminescence
materials as response signal is critical. As promising optical labels
in sensing and biosensing events (Hu et al., 2010b; Wang et al.,
2010b; Zhang and Hu, 2010), QDs possess unique optical prop-
erties, such as greater brightness, better stability with respect to
photobleaching, narrow, symmetric, tunable emission spectra, and
broad excitation spectrum. These distinct characteristics bring QDs
to serve as an ideal, stable and bright sensor signal in droplet.
Moreover, QDs had not been applied in droplet, which motivate
us to develop this excellent fluorescent probe in this field. How-
ever, fluorescence intensity change in homochromatism is hard
to be distinguished by the naked eye, but the color change origi-
nated from the change in fluorescence intensity could be identified
more easily. To the best of our knowledge, some Ru complexes
have been widely applied in DNA detection, proteins assay, cell
imaging and small molecules determination according to the prin-
ciple of that, Ru can bind strongly and especially with dsDNA
to generate an emission peak at 609 nm (Choi et al., 2009; Jiang
et al., 2004; Liu et al., 2009; Zhang et al., 2010). Besides, a dual
color detection for dsDNA has been successfully achieved by using
Ru(bpy)2(dppx)2+ as both a good quencher for QDs and a reporter
for dsDNA (Zhao et al., 2009a). On the basis of these works, a
strategy of variable color response could be provided for droplet
assay.
Inspired by the mentioned above, herein, we present a
luminescence-based colorimetric droplet platform for dsDNA
determination by selecting calf thymus DNA (ctDNA) as a model
analyte (Fig. 1). In order to make the color change distinguished
more easily, the detection was explored by choosing a separated
fluorescence output signal of QDs and Ru. On the basis of manipu-
lation techniques, the droplets containing different concentrations
of ctDNA were trapped and photographed distinctly. The analy-
sis of ctDNA concentration was realized by comparing the color of
droplets. And the corresponding fluorescence intensity was ana-
lyzed accurately with the aid of data processing. This incorporation
of colorimetry and droplet on demand provides a visual detection
platform for expensive or limited samples.
2. Materials and methods
2.1. Reagents and apparatus
Water-soluble N-acetylcysteine (NAC)-capped CdTe quantum
dots (QDs) and Ru(bpy)2(dppx)2+ (Ru) were synthesized accord-
ing to references (Hartshorn and Barton, 1992; Zhao et al.,
2009b). The calf thymus DNA, glucose, lysozyme, yeast ribonu-
cleic acid (RNA), bovine serum albumin (BSA), mineral oil, and
span 80 were purchased from Sigma–Aldrich (USA). The single-
stranded DNA (ssDNA) (X, 5 -AATACCACATCATCCATA TA-3 ; Y,
5 -CGTGTTGTGTTTCCTGTTTG-3 ; Z, 5 -TATATGGATGATGTGGTATT-
3 ) was purchased from Shanghai Sangon Biological Engineering
Technology & Service Co., Ltd. (China). The human serum was pro-
vided by The Zhongnan Hospital of Wuhan University. The food dye
was purchased by Shanghai Dyestuffs Research Institute Co., Ltd.
(China). Samples containing appropriate concentrations of Ru, QDs,
X. Xiang et al. / Biosensors and Bioelectronics 32 (2012) 43–49 45
and ctDNA were prepared in10 mM Tris–HCl buffer solution (pH
7.5, 10 mM NaCl). All aqueous solutions were prepared in ultrapure
water with a resistivity of 18.2 M cm (Millipore).
The silicon wafer and photoresist spinner were purchased by
Institute of Microelectronics of Chinese Academy of Sciences. The
poly(dimethylsiloxane) (PDMS) and AZ 50 XT photoresist was
obtained from RTV615 GE Toshiba Silicones Co. Ltd. and AZ Elec-
tronic Materials USA Corp. (USA). The manipulation technique were
realized by integrating pneumatic microvalves and actuated by
gas via Digital Pressure Switch (SeriesZSE30A (F)/ISE30A, SMC,
Japan) combined with a custom-built program software. Droplets
were observed and recorded with a charge-coupled device (CCD,
Spot RT3 Diagnostic Instruments, Inc., USA) onto a microscope
under 10× objective at room temperature (Axio Observer.A1, Zeiss,
Germany) and a Spot RT3 slider color microscopy camera (Diagnos-
tic Instruments, Inc., USA).
2.2. Microfluidic chip design and fabrication
A three-layer PDMS microfluidic chip was designed by soft-
photolithography (Fig. 1A). The bottom, middle and upper was
glass, automatic microvalve and fluid layer, respectively. All chan-
nels are 200 ␮m width. There were four T-junction structures in
upper and ten pneumatic microvalves in middle layer. The mid-
dle and upper layers were different templates. First, the designed
structures printed on a transparent film were transferred onto a
silicon wafer with 50 ␮m thick AZ 50 XT photoresist. After casting
about 5 mm thick of upper layer with a 10:1 polymer/cross-linking
agent ratio, onto the silicon master of the upper layer and waiting
until the bubbles disappeared, PDMS was heated at 80 ◦C for 2 h.
Similarly, the 15:1 polymer/cross-linking agent ratio PDMS of mid-
dle layer with 50 ␮m thick was cured at 80 ◦C after heating 30 min.
Then the upper layer was peeled off from the master, and inlet and
outlet holes were drilled by a metal pipe. After exposed to an oxy-
gen plasma treatment, it was bonded to the middle layer. The PDMS
bilayer peeled off from the master after cured about 30 min, and the
holes of the valve layer were drilled. Finally, the integrated PDMS
chip was baked at 75 ◦C for more than 6 h to get the hydrophobic
channels after bonded to a glass slide.
2.3. The formation and detection processes of droplets
Firstly, the microvalves channels were filled with water and
switched off. Then the oil was flowed into the main channel, and all
reagents were introduced into the side channels by nitrogen gas.
When the valve of the middle PDMS membrane is open, droplet was
generated at the T-junction. By tuning open time of the microvalves
with a digital pressure supply system, different size and shape
droplets could be obtained. For this chip, the former three chan-
nels were used as entrance of reagents and the last was exit of waste
to avoid reagents contaminated the detection region. The two pil-
lars used as fusion and detection region, respectively. On the basis
of this technique, Ru, QDs and DNA/buffer droplets were gener-
ated and fused on demand. Different DNA samples were exchanged
into the chip from an entrance. For the purpose of elaborating
the quenching and recover process on-line and real-time, we used
three-droplet fusion mode to carry out the detection. After pair
of droplets containing Ru and QDs was fused, the third droplet of
target DNA was fused into the quenched droplet. When the droplet
mixed well, it was immobilized immediately at the detection region
and taken photograph excited by blue light of fluorescence micro-
scope. The luminescence intensities were obtained from those
fluorescence images by using an imaging processing software. Dur-
ing the whole detection, the reagent consumption was no more
than 2 ␮L, and the time of whole detection process was about a few
minutes.
3. Results and discussion
3.1. The stability of droplet on demand
With the development of droplet manipulation technologies
such as applying electrical (Link et al., 2006), forces, optical heat-
ing (Lorenz et al., 2006), microactuator and microvalve (Zeng et al.,
2009), the DOD provides an excellent platform for us to explore a
novel analytical detection scheme in visualization. Importantly, the
first step is to ensure the stability of individual droplet. The next is
to realize the fusion of multiple droplets. Obviously, the droplet size
is related to the loading pressure (PLoading) of the aqueous solution
and open time (Ton) of the valve. We first tested the monodis-
persed droplets at various PLoading with a fixed Ton. As illustrated
in Fig. S1, the results showed that the droplet size increased with
an increasing PLoading. Additionally, with lower PLoading, smaller
droplets could also be generated but were too small to be fused
and observed; while the PLoading was too high, the reproducibil-
ity and stability of the droplet sizes were unsatisfactory because
instable long plugs, sometimes accompanied with tiny droplets,
were formed. The results were shown in Fig. S2. Then, the rela-
tion between droplet size and the time period of the on-state of
the microvalve was explored. Results were showed in Fig. S3(A)
and presented that the droplet size increased accordingly when Ton
increased from 100 ms to 900 ms. Area analysis indicated that the
droplet size increased linearly with Ton and the relationship was
shown in Fig. S3(B). Furthermore, the results that small droplets
were much stable than large ones were revealed in Fig. S4. Com-
pared with the two mentioned methods, the process was easier and
simpler using the second method to get a stable droplet and adjust
the droplet composition in a short time. Therefore, the droplet size
was tuned by varying the Ton with a fixed PLoading in the following
work. This technique responded in real time, eliminated expensive
syringe pumps and was able to stabilize the droplets quickly.
3.2. The fusion of droplets
For some chemical assays allowed multi-step reaction, differ-
ent reagents need to be fused into a droplet to initiate a reaction.
Though it is very difficult for traditional methods, the DOD platform
could address the problem by means of some specific manipulation
schemes (Guo et al., 2010a; Wang et al., 2010a). Recently, fusion
technique of two droplets has been applied widely (Churski et al.,
2010; Wang et al., 2010a), but it failed to reflect the whole pro-
cess directly for some complicated chemical systems. In our work,
three-droplet fusions were explored to present the events, where
the green food dye was used an indicator. As the results shown
in Fig. 2(A), three-droplet fusions could be achieved with a well-
mixed state. The fusion was realized by the region of the pillar
induced droplet merging structures (Niu et al., 2008). Even though
the droplets could not be fused in the pillar zone because of a long
distance, it still could be realized by using the switch function of
microvalve (seeing Fig. 2(B) and Movie). On the basis of the above
fusion technique, a series of droplets with different volumetric
ratios (VRs) of the food dye were also created easily. In well-mixed
droplets, the VR of food dye was described as VR = Vo/(Vo + Vb),
where Vo and Vb represented the volume of the original food dye
droplet and the buffer droplet, respectively (Guo et al., 2010b). The
corresponding results were shown in Fig. 3. It was observed that
the color of droplet was deeper with the increasing of VRs of food
dye, which confirmed the feasibility to adjust sample concentration
on a single chip. Given above the characteristics, analytical time
and consumption of reagents will become shorter and less on DOD
platform than conventional methods in a vast solution. These make
46 X. Xiang et al. / Biosensors and Bioelectronics 32 (2012) 43–49
Fig. 2. (A) Microvalve controlled fusion of three droplets: the first droplet was dye while others were buffer. From 1 to 5 showed the fusion process between the first droplet
and second, and then it fused into the third one as a well-mixed one and (B) the fusion process of droplet pairs by adjusting the switch of valve in the fusing zone.
DOD platform holds great potential in high throughput assays with
high efficiency.
3.3. The principle of luminescence-based colorimetric
determination for dsDNA in droplet
There is no doubt that droplet techniques have widespread
applications in high throughput DNA hybridization analysis (Hsieh
et al., 2009; Srisa-Art et al., 2009a). As previously mentioned, those
traditional droplet protocols for biomolecule analysis are limited by
multiple compositions assays on a single chip and the requirement
of costly detection equipment. In order to develop the applications
of droplet, an incorporation of visual method and DOD platform
could provide a new way for biomolecule determination. Herein,
we presented a luminescence-based colorimetric droplet platform
for dsDNA determination to evaluate the possibility by using two
separate output fluorescent signals of QDs and Ru. The scheme is
illustrated in Fig. 1(B), in which the green luminescent QDs with an
emissive peak at 553 nm (Fig. S5) were purposely chosen to obtain
obvious fluorescence and color responses. In this sensor platform,
Ru could be served a quencher for QDs and a reporter for dsDNA. In
the absence of dsDNA, the electrostatic interaction makes Ru close
to QDs and suppress efficiently its fluorescence. As a result, a dark
green appears in droplet. With the addition of dsDNA, the quench-
ing process is prevented because of the competition of dsDNA with
QDs for Ru. Meanwhile, the luminescence of QDs is restored and a
red fluorescence of Ru is emitted, causing the droplet in a mixed
color. On the basis of this mechanism, a colorimetric strategy for
dsDNA can be established in droplet relying on our design logic.
Then, the experiments were carried out by selecting ctDNA as a
model analyte and the results were shown in Fig. 4. In the absence
of ctDNA, Ru was mixed with QDs, and a dark color was observed.
When ctDNA droplet was fused into the quenched droplet of
QDs–Ru, an obvious orange color appeared in the three parallel
controls. The results revealed that the detection of dsDNA could
be realized in droplet by comparing droplet color. In this visual
Fig. 3. Creation of concentration gradient of green food dye in droplet: the VRs from A to D were 9%, 19%, 38% and 58%, respectively.
X. Xiang et al. / Biosensors and Bioelectronics 32 (2012) 43–49 47
Fig. 4. The fluorescence imaging in the absence (A) and presence of ctDNA (B) with concentration of 27 pg. In the system, the concentrations of QDs and Ru were 5 × 10⁻⁶
M
and 1 × 10⁻⁴
M.
system, there are three advantages of QD–Ru complex droplet sen-
sor. Firstly, the QD–Ru complex dyads sensor is superior to that
based on single fluorescence of Ru in the color change and sensitiv-
ity, which could be concluded from Fig. S6. Secondly, it provides a
simple and convenient dual-color method for luminescence-based
colorimetric determination. Thirdly, the change of color originated
from the change in fluorescence intensity can be observed more
easily.
3.4. Optimization of the variables
In order to obtain high sensitivity and good selectivity, the vari-
ables have been optimized. Compared with macro-environment,
the concentration of fluorescent probe in droplet is much higher to
generate obvious fluorescence signal. In this detection system, the
5 × 10⁻⁶ M green QDs served as a fluorescence donor. Five different
concentrations of Ru were introduced to investigate its quenching
efficiency for the QDs. It was observed form Fig. S7 that the green
color became darker with the increasing of the concentration of Ru,
which indicated that the quenching efficiency was proportional to
the concentration of quencher. Upon the addition of ctDNA, a grad-
ual color enhancement emerged in droplet. To obtain good color
response, 1 × 10⁻⁴ M Ru was chosen in the following work. Besides,
the quenching efficiency was related to the droplet sizes between
QDs and Ru, thus volume ratios of QDs/Ru were explored and the
results were shown in Fig. S8. When the volume ratio was up to
1:2, a clear color change appeared. However, the quenched fluo-
rescence had not obvious differences when the ratios were 1:2, 1:3
and 1:4, which might be that the quenching capability of Ru arrived
at a saturated state. To ensure effective fluorescence quenching
and recovery of QDs, the volume ratio of QDs and Ru droplets was
chosen as 1:3.
To confirm that the fluorescence restoration of QDs was caused
by the binding of ctDNA and Ru, the effect of ctDNA on the
fluorescence of QDs was investigated (seeing Fig. S9). By con-
trol experiments, no obvious color differences were found in the
absence and presence of ctDNA. This suggested that ctDNA had
no interaction with QDs. Furthermore, the effect of droplet size
of ctDNA on the detection system was carried out in Fig. S10.
Evidently, the colors had no significant variations with differ-
ent droplet sizes of ctDNA fused into the quenching droplet. In
addition, the effect of mixed order of droplets was investigated.
As shown in Fig. S11, the fluorescence intensities obtained were
almost for the modes of Ru–ctDNA–QDs or Ru–QDs–ctDNA, which
suggested the chemical reagents could be mixed well in a short
time. According to the results mentioned above, the mode of
Fig. 5. Color changes in the presence of ctDNA in 0.01 M Tris–HCl with concentrations of 0, 2.0, 6.0, 8.0, 12, 20 pg (from 1 to 6) (A1); and in 0.1 mg/ml human serum, with
concentrations of 0, 3.0, 10, 13, 18, and 21 pg (from 1 to 6) (A2). (B) The relationships between the fluorescence intensities and the concentrations of ctDNA (B1) in buffer and
(B2) in human serum. Other conditions were the same as Fig. 4.
48 X. Xiang et al. / Biosensors and Bioelectronics 32 (2012) 43–49
Fig. 6. Color changes in the presence of ssDNA (A) and its complementary dsDNA (B) with concentrations of 0, 1, 3, 6, 10 × 10−7
M (from 1 to 5). The ssDNA and dsDNA were
formed by mixing with the 10−6
M ssDNA before being introduced into the chip. SsDNA: (5 -AATACCACATCATCCATATA-3 ); dsDNA: (X, 5 -AATACCACATCA TCCATATA-3 ; Y,
5 -TATATGGATGATGTGGTATT-3 ). Other conditions were the same as Fig. 4.
Ru–QDs–ctDNA/buffer was employed in the detection with the vol-
ume ratio of 3:1:2.
3.5. The determination of dsDNA on colorimetric droplet platform
To further evaluate the sensitivity of colorimetric droplet
biosensor, various concentrations of ctDNA were introduced into
the sensing ensemble. Fig. 5(A1) showed that the fluorescence of
QDs was quenched by Ru in the absence of ctDNA and droplet pre-
sented dark color. With the increasing amount of added ctDNA,
more and more Ru left the surface of QDs caused by the competition
of ctDNA with QDs for Ru, which led to the fluorescence restora-
tion of QDs and the fluorescence emission of Ru. Correspondingly, a
light mixed color appeared, and then became deep gradually, finally
turned to orange. Moreover, this colorimetric droplet biosensor
was applied to detect of ctDNA in diluted human serum samples
(Fig. 5(A2)). And the fluorescence intensities of droplet in buffer and
in human serum were compared intuitively (Fig. S12). The results
presented good agreements with those obtained in buffer.
The plots of the fluorescence intensities vs the concentrations of
the ctDNA in buffer and in human serum were presented in Fig. 5.
It exhibited not only a good linear relationship over the range of
2.0–20 pg in buffer (Fig. 5(B1)), but also over the range of 3.0–21 pg
in human serum (Fig. 5(B2)). The detection limits of ctDNA in buffer
and in human serum were 1 pg and 0.9 pg at 3 times the standard
deviation of the control. This method and some other reported tech-
niques, which had some advantages in the sensitivity of dsDNA
assay, were listed in Table S1 in the supplementary information.
The sensitivity of this present work was found to be higher than
some of them. Though it was not as good as the others, the abso-
lute amount of reagents in our work is smaller than that in those
methods. Besides, our detection was achieved in a short time and
realized in visualization with high efficiency and simple detection
produce.
To assess the selectivity of the droplet sensor, a variety of bio-
logically relevant chemical species such as glucose, lysozyme, BSA,
and RNA were examined. As shown in Fig. S13A, no detectable
color changes were found in the presence of glucose, lysozyme
and BSA. It showed in Fig. S13B and C that obvious color differ-
ences were observed between in the presence of RNA and ctDNA,
while little color differences were found between in the presence of
non-complementary DNA and complementary pair of DNA. For the
color responses of this droplet sensor to RNA or ssDNA, we spec-
ulated there might be two reasons. On one hand, the droplet size
was very small, causing high self-hybridized probabilities of RNA
and non-complementary DNA. On the other hand, the formation
of a cavity around the metal complex by single stranded oligonu-
cleotides, to which access of water molecules is prevented, made
the fluorescence of Ru emerged. Additionally, a minimum of six
bases of the single stranded oligonucleotides are required for Ru-
complex to exhibit the “light switch” effect (Coates et al., 2000). And
the sequence of the RNA is long, and the DNA is very short in our
work. Therefore, the color differences were large between RNA and
ctDNA, while they were small between the non-complementary
DNA and complementary pair of DNA. Relatively speaking, this col-
orimetric droplet sensor displayed a good selectivity for dsDNA
within a certain range. In order to develop the real application
of this biosensor, baculovirus nucleic acid and plasmid DNA were
introduced into the sensor (Fig. S14). The extraction processes of
samples were also shown in Supplementary information. Evidently,
the results revealed that this sensor had good responses for bac-
ulovirus nucleic acid and plasmid DNA. All the results suggested
that the viability of the droplet biosensor in the detection of dsDNA
has been established.
To further explore the viability of the biosensor for detecting
oligonucleic acid, various concentrations of 20-mer of ssDNA and its
corresponding complementary dsDNA were introduced separately
into the sensing ensemble. As shown in Fig. 6, there was a gradu-
ally enhanced color response with the increasing concentration of
20-mer dsDNA. Compared with the results of ssDNA and dsDNA,
the color changes could be distinguished well, suggesting that this
colorimetric droplet sensor could be extended to DNA hybridiza-
tion detection. Based on the binding principle of Ru and dsDNA,
this droplet platform would be able to identify a DNA intercalator
in visualization. Besides, a colorimetric platform can be developed
to detect some limited and precious proteins rapidly and select
potential anticancer agents from large combinatorial libraries with
relatively low cost and high throughput in the future.
4. Conclusions
In summary, we have presented a novel determination mode
for dsDNA by combining luminescence-based colorimetry and
droplet-based valve microfluidics. Unlike conventional methods,
the determination of biomolecules on this platform was achieved
in visualization with a small consumption of reagents, low cost
detection system and a short time. By this platform, a simple
high throughput assays can be expected to realize by increasing
the channels of chip. According to the proposed sensing strategy,
exploitation of the luminescence-based colorimetry to completely
recognize cDNA, multiple DNA determination will be undertaken.
On the basis of the principle above, this method would be applied
in identifying anticancer drug by color assays on this platform.
With the development of microvalve-based droplet techniques,
this scheme greatly expands a potential for drug discovery and
biological screening.
X. Xiang et al. / Biosensors and Bioelectronics 32 (2012) 43–49 49
Acknowledgements
We would like to thank Prof. Weihua Huang for his help to
our experiments and Fang Zheng kindly provides human serum
for us. We thank Dr. Xueying Wang for kindly guiding with pro-
cess of software. This work was supported by the National Science
Foundation of China (21075093), the Science Fund for Creative
Research Groups of NSFC (20921062), the National Key Scientific
Program-Nanoscience and Nanotechnology (2011CB933600) and
973 Program (2007CB714507).
Appendix A. Supplementary data
Supplementary data associated with this article can be found, in
the online version, at doi:10.1016/j.bios.2011.11.013.
References
Bui, M.P.N., Li, C.A., Han, K.N., Choo, J., Lee, E.K., Seong, G.H., 2011. Anal. Chem. 83,
1603–1608.
Casadevall i Solvas, X., deMello, A., 2011. Chem. Commun. 47, 1936–1942.
Cecchini, M.P., Hong, J., Lim, C., Choo, J., Albrecht, T., Demello, A.J., Edel, J.B., 2011.
Anal. Chem. 83, 3076–3081.
Choi, J.H., Lee, S.K., Lim, J.M., Yang, S.M., Yi, G.R., 2010. Lab Chip 10, 456–461.
Choi, M.S., Yoon, M., Baeg, J.O., Kim, J., 2009. Chem. Commun., 7419–7421.
Churski, K., Korczyk, P., Garstecki, P., 2010. Lab Chip 10, 816–818.
Coates, C.G., McGarvey, J.J., Callaghan, P.L., Coletti, M., Hamilton, J.G., 2000. J. Phys.
Chem. B 105, 730–735.
Crivat, G., Da Silva, S.M., Reyes, D.R., Locascio, L.E., Gaitan, M., Rosenzweig, N., Rosen-
zweig, Z., 2010. J. Am. Chem. Soc. 132, 1460–1461.
Evans, R.C., Douglas, P., 2006. Anal. Chem. 78, 5645–5652.
Guo, F., Ji, X.H., Liu, K., He, R.X., Zhao, L.B., Guo, Z.X., Liu, W., Guo, S.S., Zhao, X.Z.,
2010a. Appl. Phys. Lett. 96, 193701.
Guo, F., Liu, K., Ji, X.H., Ding, H.J., Zhang, M., Zeng, Q.A., Liu, W., Guo, S.S., Zhao, X.Z.,
2010b. Appl. Phys. Lett., 97.
Hartshorn, R.M., Barton, J.K., 1992. J. Am. Chem. Soc. 114, 5919–5925.
Hoang, P.H., Nguyen, C.T., Perumal, J., Kim, D.P., 2011. Lab Chip 11, 329–335.
Hsieh, A.T.H., Pan, P.J.H., Lee, A.P., 2009. Microfluid. Nanofluid. 6, 391–401.
Hu, M., He, Y., Song, S.P., Yan, J.A., Lu, H.T., Weng, L.X., Wang, L.H., Fan, C.H., 2010a.
Chem. Commun. 46, 6126–6128.
Hu, M., Yan, J., He, Y., Lu, H.T., Weng, L.X., Song, S.P., Fan, C.H., Wang, L.H., 2010b. ACS
Nano 4, 488–494.
Huebner, A., Olguin, L.F., Bratton, D., Whyte, G., Huck, W.T.S., de Mello, A.J., Edel, J.B.,
Abell, C., Hollfelder, F., 2008a. Anal. Chem. 80, 3890–3896.
Huebner, A., Sharma, S., Srisa-Art, M., Hollfelder, F., Edel, J.B., Demello, A.J., 2008b.
Lab Chip 8, 1244–1254.
Huebner, A., Srisa-Art, M., Holt, D., Abell, C., Hollfelder, F., Demello, A.J., Edel, J.B.,
2007. Chem. Commun., 1218–1220.
Jiang, Y.X., Fang, X.H., Bai, C.L., 2004. Anal. Chem. 76, 5230–5235.
Lanigan, P.M.P., Ninkovic, T., Chan, K., de Mello, A.J., Willison, K.R., Klug, D.R., Templer,
R.H., Neil, M.A.A., Ces, O., 2009. Lab Chip 9, 1096–1101.
Leng, X.F., Zhang, W.H., Wang, C.M., Cui, L.A., Yang, C.J., 2010. Lab Chip 10, 2841–2843.
Link, D.R., Grasland-Mongrain, E., Duri, A., Sarrazin, F., Cheng, Z.D., Cristobal, G.,
Marquez, M., Weitz, D.A., 2006. Angew. Chem. Int. Ed. 45, 2556–2560.
Liu, L., Li, X.X., Hou, S., Xue, Y.L., Yao, Y., Ma, Y.Z., Feng, X.Z., He, S., Lu, Y., Wang, Y.M.,
Zeng, X.S., 2009. Chem. Commun., 6759–6761.
Lorenz, R.M., Edgar, J.S., Jeffries, G.D.M., Chiu, D.T., 2006. Anal. Chem. 78, 6433–6439.
Nightingale, A.M., Krishnadasan, S.H., Berhanu, D., Niu, X., Drury, C., McIntyre, R.,
Valsami-Jones, E., deMello, J.C., 2011. Lab Chip 11, 1221–1227.
Niu, X., Gulati, S., Edel, J.B., deMello, A.J., 2008. Lab Chip 8, 1837–1841.
Pawar, A.A., Venkataraman, C., 2011. Aerosol. Sci. Technol. 45, 811–820.
Schaerli, Y., Wootton, R.C., Robinson, T., Stein, V., Dunsby, C., Neil, M.A.A., French,
P.M.W., deMello, A.J., Abell, C., Hollfelder, F., 2008. Anal. Chem. 81, 302–306.
Shim, J.U., Olguin, L.F., Whyte, G., Scott, D., Babtie, A., Abell, C., Huck, W.T.S.,
Hollfelder, F., 2009. J. Am. Chem. Soc. 131, 15251–15256.
Srisa-Art, M., deMello, A.J., Edel, J.B., 2007. Anal. Chem. 79, 6682–6689.
Srisa-Art, M., deMello, A.J., Edel, J.B., 2009a. Chem. Commun., 6548–6550.
Srisa-Art, M., Kang, D.K., Hong, J., Park, H., Leatherbarrow, R.J., Edel, J.B., Chang, S.I.,
deMello, A.J., 2009b. ChemBioChem 10, 1605–1611.
Sun, M., Fang, Q., 2010. Lab Chip 10, 2864–2868.
Teh, S.Y., Lin, R., Hung, L.H., Lee, A.P., 2008. Lab Chip 8, 198–220.
Theberge, A.B., Courtois, F., Schaerli, Y., Fischlechner, M., Abell, C., Hollfelder, F., Huck,
W.T.S., 2010. Angew. Chem. Int. Ed. 49, 5846–5868.
Wang, W., Yang, C., Liu, Y.S., Li, C.M., 2010a. Lab Chip 10, 559–562.
Wang, X., Lou, X.H., Wang, Y., Guo, Q.C., Fang, Z., Zhong, X.H., Mao, H.J., Jin, Q.H., Wu,
L., Zhao, H., Zhao, J.L., 2010b. Biosens. Bioelectron. 25, 1934–1940.
Wang, X.D., Chen, X., Xie, Z.X., Wang, X.R., 2008. Angew. Chem. Int. Ed. 47,
7450–7453.
Zeng, S.J., Li, B.W., Su, X.O., Qin, J.H., Lin, B.C., 2009. Lab Chip 9, 1340–1343.
Zhang, C.Y., Hu, J., 2010. Anal. Chem. 82, 1921–1927.
Zhang, X.R., Li, Y., Su, H.R., Zhang, S.S., 2010. Biosens. Bioelectron. 25, 1338–1343.
Zhao, D., Chan, W.H., He, Z.K., Qiu, T., 2009a. Anal. Chem. 81, 3537–3543.
Zhao, D., He, Z.K., Chan, W.H., Choi, M.M.F., 2009b. J. Phys. Chem. C 113, 1293–1300.
Zhao, L.B., Pan, L., Zhang, K., Guo, S.S., Liu, W., Wang, Y., Chen, Y., Zhao, X.Z., Chan,
H.L.W., 2009c. Lab Chip 9, 2981–2986.

Biosensors and Bioelectronics 2012

  • 1.
    Biosensors and Bioelectronics32 (2012) 43–49 Contents lists available at SciVerse ScienceDirect Biosensors and Bioelectronics journal homepage: www.elsevier.com/locate/bios Real-time luminescence-based colorimetric determination of double-strand DNA in droplet on demand Xia Xiang, Lu Chen, Qinggeng Zhuang, Xinghu Ji, Zhike He∗ Key Laboratory of Analytical Chemistry for Biology and Medicine (Ministry of Education), College of Chemistry and Molecular Sciences, Wuhan University, Wuhan 430072, PR China a r t i c l e i n f o Article history: Received 13 August 2011 Received in revised form 17 October 2011 Accepted 8 November 2011 Available online 8 December 2011 Keywords: Colorimetric sensor Quantum dots Ru(bpy)2(dppx)2+ Droplet platform a b s t r a c t We have developed a new luminescence-based colorimetric droplet platform for the determination of double-stranded DNAs (dsDNA). This colorimetric sensor was realized via choosing a fluorescent ensemble probe comprising water-soluble N-acetylcysteine-capped CdTe quantum dots (QDs) and Ru(bpy)2(dppx)2+ (Ru). To provide a convenient and low cost droplet platform for colorimetry, the microvalve technique was adapted to adjust droplet size precisely, achieve the desired fusion of multi- ple droplets and trap droplets on demand, as well as implement concentration gradients of DNA on a single chip. In the colorimetric sensor, Ru served as both an effective quencher for QDs and a reporter for dsDNA. With increasing concentration of dsDNA, a gradually enhanced color response was observed because of the competition of dsDNA with QDs for Ru. Under the optimum conditions, this biosensing system exhibited not only good sensitivity and specificity for calf thymus DNA with the detection limit of 1.0 pg, but also coincident performances in diluted human serum with the detection limit of 0.9 pg. The droplet biosensor provides a highly efficient, rapid and visual method for dsDNA analysis. The col- orimetric droplet platform could be useful as a simple research tool for the study of limited and precious regents such as protein and virus samples, etc. © 2011 Elsevier B.V. All rights reserved. 1. Introduction In recent years, droplet, as a vital platform for chemistry and biology, has attracted huge interest and been exploited in a diverse range of applications (Casadevall i Solvas and deMello, 2011; Cecchini et al., 2011; Huebner et al., 2008b; Teh et al., 2008; Theberge et al., 2010), such as protein analysis (Huebner et al., 2007; Srisa-Art et al., 2009b), cell culture (Lanigan et al., 2009; Zhao et al., 2009c), material synthesis (Hoang et al., 2011; Nightingale et al., 2011; Pawar and Venkataraman, 2011), enzyme assay (Huebner et al., 2008a; Shim et al., 2009) and PCR (Leng et al., 2010; Schaerli et al., 2008). Compared with laminar flow-based microfluidics (Crivat et al., 2010; Hu et al., 2010a), droplet technique can fur- ther accelerate reagents mixing and shorten reaction time. As an isolated reactor, it greatly eliminates the dispersion and cross- contamination of reagents, and controls solution volume precisely. These advents make it holds great potential for high throughput assays. Up to now, existing assay methods implemented by droplet are usually achieved by using conventional methods based on the flow instability between the aqueous and oil phase (Sun and Fang, 2010), which are severely limited by the difficulties in tuning the composition of droplet and the requirements of costly instruments. ∗ Corresponding author. Tel.: +86 27 68756557; fax: +86 27 68754067. E-mail address: zhkhe@whu.edu.cn (Z. He). Although concentration gradients of sample can be realized by some especial structures (Bui et al., 2011), it is still hard to be applied widely because the process of droplet formation is sponta- neous and lacks control. With the development of different droplet manipulation schemes such as droplet transportation, fusion, split, sorting, and trapping (Choi et al., 2010; Churski et al., 2010), droplet on demand (DOD) platform could overcome those drawbacks of conventional methods. In addition, a droplet team could be created with a desired size, shape and accurate compositions as well as a small consumption of reagents. And the droplets could be observed in real-time and in situ. But unfortunately, this DOD platform has not been applied in analytical determination. Currently, most of analytical methods in droplet are relied on fluorescence resonance energy transfer (FRET) (Hsieh et al., 2009; Srisa-Art et al., 2007, 2009b). Nevertheless, FRET technique usu- ally needs laborious and time-consuming labels. Additionally, the droplets moved at high speed make that the detection depends on sophisticated instruments, which leads to increase cost and require professional operator. Recently, some unique colorimetric assays provide good, accurate and convenient methods for ana- lytical detection. Douglas’s group proposed a new colorimetric strategy for oxygen determination based on luminescence (Evans and Douglas, 2006). And Chen’s group developed a reversible opti- cal sensor strip for oxygen on basis of the above work (Wang et al., 2008). These give us a hint of that, an ideal droplet biosensor com- bining the advantages of both luminescence and colorimetry would 0956-5663/$ – see front matter © 2011 Elsevier B.V. All rights reserved. doi:10.1016/j.bios.2011.11.013
  • 2.
    44 X. Xianget al. / Biosensors and Bioelectronics 32 (2012) 43–49 Fig. 1. (A) Schematic picture of the structure of droplet based microfluidic platform and (B) schematic illustration of the signal transduction mechanism of the double strain DNA biosensor modulated by the luminescent QDs and Ru in droplet. make droplet platform more applicable in biology and chemistry. Unfortunately, this incorporation is hard to be realized by conven- tional methods without the need of additional costly instruments. By contrast, it is easily implemented on DOD platform with a com- mon charge-coupled device, where a new quantitative sensor could be established with high assay efficiency and simple detection pro- cedure. To achieve good color responses, the choice of luminescence materials as response signal is critical. As promising optical labels in sensing and biosensing events (Hu et al., 2010b; Wang et al., 2010b; Zhang and Hu, 2010), QDs possess unique optical prop- erties, such as greater brightness, better stability with respect to photobleaching, narrow, symmetric, tunable emission spectra, and broad excitation spectrum. These distinct characteristics bring QDs to serve as an ideal, stable and bright sensor signal in droplet. Moreover, QDs had not been applied in droplet, which motivate us to develop this excellent fluorescent probe in this field. How- ever, fluorescence intensity change in homochromatism is hard to be distinguished by the naked eye, but the color change origi- nated from the change in fluorescence intensity could be identified more easily. To the best of our knowledge, some Ru complexes have been widely applied in DNA detection, proteins assay, cell imaging and small molecules determination according to the prin- ciple of that, Ru can bind strongly and especially with dsDNA to generate an emission peak at 609 nm (Choi et al., 2009; Jiang et al., 2004; Liu et al., 2009; Zhang et al., 2010). Besides, a dual color detection for dsDNA has been successfully achieved by using Ru(bpy)2(dppx)2+ as both a good quencher for QDs and a reporter for dsDNA (Zhao et al., 2009a). On the basis of these works, a strategy of variable color response could be provided for droplet assay. Inspired by the mentioned above, herein, we present a luminescence-based colorimetric droplet platform for dsDNA determination by selecting calf thymus DNA (ctDNA) as a model analyte (Fig. 1). In order to make the color change distinguished more easily, the detection was explored by choosing a separated fluorescence output signal of QDs and Ru. On the basis of manipu- lation techniques, the droplets containing different concentrations of ctDNA were trapped and photographed distinctly. The analy- sis of ctDNA concentration was realized by comparing the color of droplets. And the corresponding fluorescence intensity was ana- lyzed accurately with the aid of data processing. This incorporation of colorimetry and droplet on demand provides a visual detection platform for expensive or limited samples. 2. Materials and methods 2.1. Reagents and apparatus Water-soluble N-acetylcysteine (NAC)-capped CdTe quantum dots (QDs) and Ru(bpy)2(dppx)2+ (Ru) were synthesized accord- ing to references (Hartshorn and Barton, 1992; Zhao et al., 2009b). The calf thymus DNA, glucose, lysozyme, yeast ribonu- cleic acid (RNA), bovine serum albumin (BSA), mineral oil, and span 80 were purchased from Sigma–Aldrich (USA). The single- stranded DNA (ssDNA) (X, 5 -AATACCACATCATCCATA TA-3 ; Y, 5 -CGTGTTGTGTTTCCTGTTTG-3 ; Z, 5 -TATATGGATGATGTGGTATT- 3 ) was purchased from Shanghai Sangon Biological Engineering Technology & Service Co., Ltd. (China). The human serum was pro- vided by The Zhongnan Hospital of Wuhan University. The food dye was purchased by Shanghai Dyestuffs Research Institute Co., Ltd. (China). Samples containing appropriate concentrations of Ru, QDs,
  • 3.
    X. Xiang etal. / Biosensors and Bioelectronics 32 (2012) 43–49 45 and ctDNA were prepared in10 mM Tris–HCl buffer solution (pH 7.5, 10 mM NaCl). All aqueous solutions were prepared in ultrapure water with a resistivity of 18.2 M cm (Millipore). The silicon wafer and photoresist spinner were purchased by Institute of Microelectronics of Chinese Academy of Sciences. The poly(dimethylsiloxane) (PDMS) and AZ 50 XT photoresist was obtained from RTV615 GE Toshiba Silicones Co. Ltd. and AZ Elec- tronic Materials USA Corp. (USA). The manipulation technique were realized by integrating pneumatic microvalves and actuated by gas via Digital Pressure Switch (SeriesZSE30A (F)/ISE30A, SMC, Japan) combined with a custom-built program software. Droplets were observed and recorded with a charge-coupled device (CCD, Spot RT3 Diagnostic Instruments, Inc., USA) onto a microscope under 10× objective at room temperature (Axio Observer.A1, Zeiss, Germany) and a Spot RT3 slider color microscopy camera (Diagnos- tic Instruments, Inc., USA). 2.2. Microfluidic chip design and fabrication A three-layer PDMS microfluidic chip was designed by soft- photolithography (Fig. 1A). The bottom, middle and upper was glass, automatic microvalve and fluid layer, respectively. All chan- nels are 200 ␮m width. There were four T-junction structures in upper and ten pneumatic microvalves in middle layer. The mid- dle and upper layers were different templates. First, the designed structures printed on a transparent film were transferred onto a silicon wafer with 50 ␮m thick AZ 50 XT photoresist. After casting about 5 mm thick of upper layer with a 10:1 polymer/cross-linking agent ratio, onto the silicon master of the upper layer and waiting until the bubbles disappeared, PDMS was heated at 80 ◦C for 2 h. Similarly, the 15:1 polymer/cross-linking agent ratio PDMS of mid- dle layer with 50 ␮m thick was cured at 80 ◦C after heating 30 min. Then the upper layer was peeled off from the master, and inlet and outlet holes were drilled by a metal pipe. After exposed to an oxy- gen plasma treatment, it was bonded to the middle layer. The PDMS bilayer peeled off from the master after cured about 30 min, and the holes of the valve layer were drilled. Finally, the integrated PDMS chip was baked at 75 ◦C for more than 6 h to get the hydrophobic channels after bonded to a glass slide. 2.3. The formation and detection processes of droplets Firstly, the microvalves channels were filled with water and switched off. Then the oil was flowed into the main channel, and all reagents were introduced into the side channels by nitrogen gas. When the valve of the middle PDMS membrane is open, droplet was generated at the T-junction. By tuning open time of the microvalves with a digital pressure supply system, different size and shape droplets could be obtained. For this chip, the former three chan- nels were used as entrance of reagents and the last was exit of waste to avoid reagents contaminated the detection region. The two pil- lars used as fusion and detection region, respectively. On the basis of this technique, Ru, QDs and DNA/buffer droplets were gener- ated and fused on demand. Different DNA samples were exchanged into the chip from an entrance. For the purpose of elaborating the quenching and recover process on-line and real-time, we used three-droplet fusion mode to carry out the detection. After pair of droplets containing Ru and QDs was fused, the third droplet of target DNA was fused into the quenched droplet. When the droplet mixed well, it was immobilized immediately at the detection region and taken photograph excited by blue light of fluorescence micro- scope. The luminescence intensities were obtained from those fluorescence images by using an imaging processing software. Dur- ing the whole detection, the reagent consumption was no more than 2 ␮L, and the time of whole detection process was about a few minutes. 3. Results and discussion 3.1. The stability of droplet on demand With the development of droplet manipulation technologies such as applying electrical (Link et al., 2006), forces, optical heat- ing (Lorenz et al., 2006), microactuator and microvalve (Zeng et al., 2009), the DOD provides an excellent platform for us to explore a novel analytical detection scheme in visualization. Importantly, the first step is to ensure the stability of individual droplet. The next is to realize the fusion of multiple droplets. Obviously, the droplet size is related to the loading pressure (PLoading) of the aqueous solution and open time (Ton) of the valve. We first tested the monodis- persed droplets at various PLoading with a fixed Ton. As illustrated in Fig. S1, the results showed that the droplet size increased with an increasing PLoading. Additionally, with lower PLoading, smaller droplets could also be generated but were too small to be fused and observed; while the PLoading was too high, the reproducibil- ity and stability of the droplet sizes were unsatisfactory because instable long plugs, sometimes accompanied with tiny droplets, were formed. The results were shown in Fig. S2. Then, the rela- tion between droplet size and the time period of the on-state of the microvalve was explored. Results were showed in Fig. S3(A) and presented that the droplet size increased accordingly when Ton increased from 100 ms to 900 ms. Area analysis indicated that the droplet size increased linearly with Ton and the relationship was shown in Fig. S3(B). Furthermore, the results that small droplets were much stable than large ones were revealed in Fig. S4. Com- pared with the two mentioned methods, the process was easier and simpler using the second method to get a stable droplet and adjust the droplet composition in a short time. Therefore, the droplet size was tuned by varying the Ton with a fixed PLoading in the following work. This technique responded in real time, eliminated expensive syringe pumps and was able to stabilize the droplets quickly. 3.2. The fusion of droplets For some chemical assays allowed multi-step reaction, differ- ent reagents need to be fused into a droplet to initiate a reaction. Though it is very difficult for traditional methods, the DOD platform could address the problem by means of some specific manipulation schemes (Guo et al., 2010a; Wang et al., 2010a). Recently, fusion technique of two droplets has been applied widely (Churski et al., 2010; Wang et al., 2010a), but it failed to reflect the whole pro- cess directly for some complicated chemical systems. In our work, three-droplet fusions were explored to present the events, where the green food dye was used an indicator. As the results shown in Fig. 2(A), three-droplet fusions could be achieved with a well- mixed state. The fusion was realized by the region of the pillar induced droplet merging structures (Niu et al., 2008). Even though the droplets could not be fused in the pillar zone because of a long distance, it still could be realized by using the switch function of microvalve (seeing Fig. 2(B) and Movie). On the basis of the above fusion technique, a series of droplets with different volumetric ratios (VRs) of the food dye were also created easily. In well-mixed droplets, the VR of food dye was described as VR = Vo/(Vo + Vb), where Vo and Vb represented the volume of the original food dye droplet and the buffer droplet, respectively (Guo et al., 2010b). The corresponding results were shown in Fig. 3. It was observed that the color of droplet was deeper with the increasing of VRs of food dye, which confirmed the feasibility to adjust sample concentration on a single chip. Given above the characteristics, analytical time and consumption of reagents will become shorter and less on DOD platform than conventional methods in a vast solution. These make
  • 4.
    46 X. Xianget al. / Biosensors and Bioelectronics 32 (2012) 43–49 Fig. 2. (A) Microvalve controlled fusion of three droplets: the first droplet was dye while others were buffer. From 1 to 5 showed the fusion process between the first droplet and second, and then it fused into the third one as a well-mixed one and (B) the fusion process of droplet pairs by adjusting the switch of valve in the fusing zone. DOD platform holds great potential in high throughput assays with high efficiency. 3.3. The principle of luminescence-based colorimetric determination for dsDNA in droplet There is no doubt that droplet techniques have widespread applications in high throughput DNA hybridization analysis (Hsieh et al., 2009; Srisa-Art et al., 2009a). As previously mentioned, those traditional droplet protocols for biomolecule analysis are limited by multiple compositions assays on a single chip and the requirement of costly detection equipment. In order to develop the applications of droplet, an incorporation of visual method and DOD platform could provide a new way for biomolecule determination. Herein, we presented a luminescence-based colorimetric droplet platform for dsDNA determination to evaluate the possibility by using two separate output fluorescent signals of QDs and Ru. The scheme is illustrated in Fig. 1(B), in which the green luminescent QDs with an emissive peak at 553 nm (Fig. S5) were purposely chosen to obtain obvious fluorescence and color responses. In this sensor platform, Ru could be served a quencher for QDs and a reporter for dsDNA. In the absence of dsDNA, the electrostatic interaction makes Ru close to QDs and suppress efficiently its fluorescence. As a result, a dark green appears in droplet. With the addition of dsDNA, the quench- ing process is prevented because of the competition of dsDNA with QDs for Ru. Meanwhile, the luminescence of QDs is restored and a red fluorescence of Ru is emitted, causing the droplet in a mixed color. On the basis of this mechanism, a colorimetric strategy for dsDNA can be established in droplet relying on our design logic. Then, the experiments were carried out by selecting ctDNA as a model analyte and the results were shown in Fig. 4. In the absence of ctDNA, Ru was mixed with QDs, and a dark color was observed. When ctDNA droplet was fused into the quenched droplet of QDs–Ru, an obvious orange color appeared in the three parallel controls. The results revealed that the detection of dsDNA could be realized in droplet by comparing droplet color. In this visual Fig. 3. Creation of concentration gradient of green food dye in droplet: the VRs from A to D were 9%, 19%, 38% and 58%, respectively.
  • 5.
    X. Xiang etal. / Biosensors and Bioelectronics 32 (2012) 43–49 47 Fig. 4. The fluorescence imaging in the absence (A) and presence of ctDNA (B) with concentration of 27 pg. In the system, the concentrations of QDs and Ru were 5 × 10⁻⁶ M and 1 × 10⁻⁴ M. system, there are three advantages of QD–Ru complex droplet sen- sor. Firstly, the QD–Ru complex dyads sensor is superior to that based on single fluorescence of Ru in the color change and sensitiv- ity, which could be concluded from Fig. S6. Secondly, it provides a simple and convenient dual-color method for luminescence-based colorimetric determination. Thirdly, the change of color originated from the change in fluorescence intensity can be observed more easily. 3.4. Optimization of the variables In order to obtain high sensitivity and good selectivity, the vari- ables have been optimized. Compared with macro-environment, the concentration of fluorescent probe in droplet is much higher to generate obvious fluorescence signal. In this detection system, the 5 × 10⁻⁶ M green QDs served as a fluorescence donor. Five different concentrations of Ru were introduced to investigate its quenching efficiency for the QDs. It was observed form Fig. S7 that the green color became darker with the increasing of the concentration of Ru, which indicated that the quenching efficiency was proportional to the concentration of quencher. Upon the addition of ctDNA, a grad- ual color enhancement emerged in droplet. To obtain good color response, 1 × 10⁻⁴ M Ru was chosen in the following work. Besides, the quenching efficiency was related to the droplet sizes between QDs and Ru, thus volume ratios of QDs/Ru were explored and the results were shown in Fig. S8. When the volume ratio was up to 1:2, a clear color change appeared. However, the quenched fluo- rescence had not obvious differences when the ratios were 1:2, 1:3 and 1:4, which might be that the quenching capability of Ru arrived at a saturated state. To ensure effective fluorescence quenching and recovery of QDs, the volume ratio of QDs and Ru droplets was chosen as 1:3. To confirm that the fluorescence restoration of QDs was caused by the binding of ctDNA and Ru, the effect of ctDNA on the fluorescence of QDs was investigated (seeing Fig. S9). By con- trol experiments, no obvious color differences were found in the absence and presence of ctDNA. This suggested that ctDNA had no interaction with QDs. Furthermore, the effect of droplet size of ctDNA on the detection system was carried out in Fig. S10. Evidently, the colors had no significant variations with differ- ent droplet sizes of ctDNA fused into the quenching droplet. In addition, the effect of mixed order of droplets was investigated. As shown in Fig. S11, the fluorescence intensities obtained were almost for the modes of Ru–ctDNA–QDs or Ru–QDs–ctDNA, which suggested the chemical reagents could be mixed well in a short time. According to the results mentioned above, the mode of Fig. 5. Color changes in the presence of ctDNA in 0.01 M Tris–HCl with concentrations of 0, 2.0, 6.0, 8.0, 12, 20 pg (from 1 to 6) (A1); and in 0.1 mg/ml human serum, with concentrations of 0, 3.0, 10, 13, 18, and 21 pg (from 1 to 6) (A2). (B) The relationships between the fluorescence intensities and the concentrations of ctDNA (B1) in buffer and (B2) in human serum. Other conditions were the same as Fig. 4.
  • 6.
    48 X. Xianget al. / Biosensors and Bioelectronics 32 (2012) 43–49 Fig. 6. Color changes in the presence of ssDNA (A) and its complementary dsDNA (B) with concentrations of 0, 1, 3, 6, 10 × 10−7 M (from 1 to 5). The ssDNA and dsDNA were formed by mixing with the 10−6 M ssDNA before being introduced into the chip. SsDNA: (5 -AATACCACATCATCCATATA-3 ); dsDNA: (X, 5 -AATACCACATCA TCCATATA-3 ; Y, 5 -TATATGGATGATGTGGTATT-3 ). Other conditions were the same as Fig. 4. Ru–QDs–ctDNA/buffer was employed in the detection with the vol- ume ratio of 3:1:2. 3.5. The determination of dsDNA on colorimetric droplet platform To further evaluate the sensitivity of colorimetric droplet biosensor, various concentrations of ctDNA were introduced into the sensing ensemble. Fig. 5(A1) showed that the fluorescence of QDs was quenched by Ru in the absence of ctDNA and droplet pre- sented dark color. With the increasing amount of added ctDNA, more and more Ru left the surface of QDs caused by the competition of ctDNA with QDs for Ru, which led to the fluorescence restora- tion of QDs and the fluorescence emission of Ru. Correspondingly, a light mixed color appeared, and then became deep gradually, finally turned to orange. Moreover, this colorimetric droplet biosensor was applied to detect of ctDNA in diluted human serum samples (Fig. 5(A2)). And the fluorescence intensities of droplet in buffer and in human serum were compared intuitively (Fig. S12). The results presented good agreements with those obtained in buffer. The plots of the fluorescence intensities vs the concentrations of the ctDNA in buffer and in human serum were presented in Fig. 5. It exhibited not only a good linear relationship over the range of 2.0–20 pg in buffer (Fig. 5(B1)), but also over the range of 3.0–21 pg in human serum (Fig. 5(B2)). The detection limits of ctDNA in buffer and in human serum were 1 pg and 0.9 pg at 3 times the standard deviation of the control. This method and some other reported tech- niques, which had some advantages in the sensitivity of dsDNA assay, were listed in Table S1 in the supplementary information. The sensitivity of this present work was found to be higher than some of them. Though it was not as good as the others, the abso- lute amount of reagents in our work is smaller than that in those methods. Besides, our detection was achieved in a short time and realized in visualization with high efficiency and simple detection produce. To assess the selectivity of the droplet sensor, a variety of bio- logically relevant chemical species such as glucose, lysozyme, BSA, and RNA were examined. As shown in Fig. S13A, no detectable color changes were found in the presence of glucose, lysozyme and BSA. It showed in Fig. S13B and C that obvious color differ- ences were observed between in the presence of RNA and ctDNA, while little color differences were found between in the presence of non-complementary DNA and complementary pair of DNA. For the color responses of this droplet sensor to RNA or ssDNA, we spec- ulated there might be two reasons. On one hand, the droplet size was very small, causing high self-hybridized probabilities of RNA and non-complementary DNA. On the other hand, the formation of a cavity around the metal complex by single stranded oligonu- cleotides, to which access of water molecules is prevented, made the fluorescence of Ru emerged. Additionally, a minimum of six bases of the single stranded oligonucleotides are required for Ru- complex to exhibit the “light switch” effect (Coates et al., 2000). And the sequence of the RNA is long, and the DNA is very short in our work. Therefore, the color differences were large between RNA and ctDNA, while they were small between the non-complementary DNA and complementary pair of DNA. Relatively speaking, this col- orimetric droplet sensor displayed a good selectivity for dsDNA within a certain range. In order to develop the real application of this biosensor, baculovirus nucleic acid and plasmid DNA were introduced into the sensor (Fig. S14). The extraction processes of samples were also shown in Supplementary information. Evidently, the results revealed that this sensor had good responses for bac- ulovirus nucleic acid and plasmid DNA. All the results suggested that the viability of the droplet biosensor in the detection of dsDNA has been established. To further explore the viability of the biosensor for detecting oligonucleic acid, various concentrations of 20-mer of ssDNA and its corresponding complementary dsDNA were introduced separately into the sensing ensemble. As shown in Fig. 6, there was a gradu- ally enhanced color response with the increasing concentration of 20-mer dsDNA. Compared with the results of ssDNA and dsDNA, the color changes could be distinguished well, suggesting that this colorimetric droplet sensor could be extended to DNA hybridiza- tion detection. Based on the binding principle of Ru and dsDNA, this droplet platform would be able to identify a DNA intercalator in visualization. Besides, a colorimetric platform can be developed to detect some limited and precious proteins rapidly and select potential anticancer agents from large combinatorial libraries with relatively low cost and high throughput in the future. 4. Conclusions In summary, we have presented a novel determination mode for dsDNA by combining luminescence-based colorimetry and droplet-based valve microfluidics. Unlike conventional methods, the determination of biomolecules on this platform was achieved in visualization with a small consumption of reagents, low cost detection system and a short time. By this platform, a simple high throughput assays can be expected to realize by increasing the channels of chip. According to the proposed sensing strategy, exploitation of the luminescence-based colorimetry to completely recognize cDNA, multiple DNA determination will be undertaken. On the basis of the principle above, this method would be applied in identifying anticancer drug by color assays on this platform. With the development of microvalve-based droplet techniques, this scheme greatly expands a potential for drug discovery and biological screening.
  • 7.
    X. Xiang etal. / Biosensors and Bioelectronics 32 (2012) 43–49 49 Acknowledgements We would like to thank Prof. Weihua Huang for his help to our experiments and Fang Zheng kindly provides human serum for us. We thank Dr. Xueying Wang for kindly guiding with pro- cess of software. This work was supported by the National Science Foundation of China (21075093), the Science Fund for Creative Research Groups of NSFC (20921062), the National Key Scientific Program-Nanoscience and Nanotechnology (2011CB933600) and 973 Program (2007CB714507). Appendix A. Supplementary data Supplementary data associated with this article can be found, in the online version, at doi:10.1016/j.bios.2011.11.013. References Bui, M.P.N., Li, C.A., Han, K.N., Choo, J., Lee, E.K., Seong, G.H., 2011. Anal. Chem. 83, 1603–1608. Casadevall i Solvas, X., deMello, A., 2011. Chem. Commun. 47, 1936–1942. Cecchini, M.P., Hong, J., Lim, C., Choo, J., Albrecht, T., Demello, A.J., Edel, J.B., 2011. Anal. Chem. 83, 3076–3081. Choi, J.H., Lee, S.K., Lim, J.M., Yang, S.M., Yi, G.R., 2010. Lab Chip 10, 456–461. Choi, M.S., Yoon, M., Baeg, J.O., Kim, J., 2009. Chem. Commun., 7419–7421. Churski, K., Korczyk, P., Garstecki, P., 2010. Lab Chip 10, 816–818. Coates, C.G., McGarvey, J.J., Callaghan, P.L., Coletti, M., Hamilton, J.G., 2000. J. Phys. Chem. B 105, 730–735. Crivat, G., Da Silva, S.M., Reyes, D.R., Locascio, L.E., Gaitan, M., Rosenzweig, N., Rosen- zweig, Z., 2010. J. Am. Chem. Soc. 132, 1460–1461. Evans, R.C., Douglas, P., 2006. Anal. Chem. 78, 5645–5652. Guo, F., Ji, X.H., Liu, K., He, R.X., Zhao, L.B., Guo, Z.X., Liu, W., Guo, S.S., Zhao, X.Z., 2010a. Appl. Phys. Lett. 96, 193701. Guo, F., Liu, K., Ji, X.H., Ding, H.J., Zhang, M., Zeng, Q.A., Liu, W., Guo, S.S., Zhao, X.Z., 2010b. Appl. Phys. Lett., 97. Hartshorn, R.M., Barton, J.K., 1992. J. Am. Chem. Soc. 114, 5919–5925. Hoang, P.H., Nguyen, C.T., Perumal, J., Kim, D.P., 2011. Lab Chip 11, 329–335. Hsieh, A.T.H., Pan, P.J.H., Lee, A.P., 2009. Microfluid. Nanofluid. 6, 391–401. Hu, M., He, Y., Song, S.P., Yan, J.A., Lu, H.T., Weng, L.X., Wang, L.H., Fan, C.H., 2010a. Chem. Commun. 46, 6126–6128. Hu, M., Yan, J., He, Y., Lu, H.T., Weng, L.X., Song, S.P., Fan, C.H., Wang, L.H., 2010b. ACS Nano 4, 488–494. Huebner, A., Olguin, L.F., Bratton, D., Whyte, G., Huck, W.T.S., de Mello, A.J., Edel, J.B., Abell, C., Hollfelder, F., 2008a. Anal. Chem. 80, 3890–3896. Huebner, A., Sharma, S., Srisa-Art, M., Hollfelder, F., Edel, J.B., Demello, A.J., 2008b. Lab Chip 8, 1244–1254. Huebner, A., Srisa-Art, M., Holt, D., Abell, C., Hollfelder, F., Demello, A.J., Edel, J.B., 2007. Chem. Commun., 1218–1220. Jiang, Y.X., Fang, X.H., Bai, C.L., 2004. Anal. Chem. 76, 5230–5235. Lanigan, P.M.P., Ninkovic, T., Chan, K., de Mello, A.J., Willison, K.R., Klug, D.R., Templer, R.H., Neil, M.A.A., Ces, O., 2009. Lab Chip 9, 1096–1101. Leng, X.F., Zhang, W.H., Wang, C.M., Cui, L.A., Yang, C.J., 2010. Lab Chip 10, 2841–2843. Link, D.R., Grasland-Mongrain, E., Duri, A., Sarrazin, F., Cheng, Z.D., Cristobal, G., Marquez, M., Weitz, D.A., 2006. Angew. Chem. Int. Ed. 45, 2556–2560. Liu, L., Li, X.X., Hou, S., Xue, Y.L., Yao, Y., Ma, Y.Z., Feng, X.Z., He, S., Lu, Y., Wang, Y.M., Zeng, X.S., 2009. Chem. Commun., 6759–6761. Lorenz, R.M., Edgar, J.S., Jeffries, G.D.M., Chiu, D.T., 2006. Anal. Chem. 78, 6433–6439. Nightingale, A.M., Krishnadasan, S.H., Berhanu, D., Niu, X., Drury, C., McIntyre, R., Valsami-Jones, E., deMello, J.C., 2011. Lab Chip 11, 1221–1227. Niu, X., Gulati, S., Edel, J.B., deMello, A.J., 2008. Lab Chip 8, 1837–1841. Pawar, A.A., Venkataraman, C., 2011. Aerosol. Sci. Technol. 45, 811–820. Schaerli, Y., Wootton, R.C., Robinson, T., Stein, V., Dunsby, C., Neil, M.A.A., French, P.M.W., deMello, A.J., Abell, C., Hollfelder, F., 2008. Anal. Chem. 81, 302–306. Shim, J.U., Olguin, L.F., Whyte, G., Scott, D., Babtie, A., Abell, C., Huck, W.T.S., Hollfelder, F., 2009. J. Am. Chem. Soc. 131, 15251–15256. Srisa-Art, M., deMello, A.J., Edel, J.B., 2007. Anal. Chem. 79, 6682–6689. Srisa-Art, M., deMello, A.J., Edel, J.B., 2009a. Chem. Commun., 6548–6550. Srisa-Art, M., Kang, D.K., Hong, J., Park, H., Leatherbarrow, R.J., Edel, J.B., Chang, S.I., deMello, A.J., 2009b. ChemBioChem 10, 1605–1611. Sun, M., Fang, Q., 2010. Lab Chip 10, 2864–2868. Teh, S.Y., Lin, R., Hung, L.H., Lee, A.P., 2008. Lab Chip 8, 198–220. Theberge, A.B., Courtois, F., Schaerli, Y., Fischlechner, M., Abell, C., Hollfelder, F., Huck, W.T.S., 2010. Angew. Chem. Int. Ed. 49, 5846–5868. Wang, W., Yang, C., Liu, Y.S., Li, C.M., 2010a. Lab Chip 10, 559–562. Wang, X., Lou, X.H., Wang, Y., Guo, Q.C., Fang, Z., Zhong, X.H., Mao, H.J., Jin, Q.H., Wu, L., Zhao, H., Zhao, J.L., 2010b. Biosens. Bioelectron. 25, 1934–1940. Wang, X.D., Chen, X., Xie, Z.X., Wang, X.R., 2008. Angew. Chem. Int. Ed. 47, 7450–7453. Zeng, S.J., Li, B.W., Su, X.O., Qin, J.H., Lin, B.C., 2009. Lab Chip 9, 1340–1343. Zhang, C.Y., Hu, J., 2010. Anal. Chem. 82, 1921–1927. Zhang, X.R., Li, Y., Su, H.R., Zhang, S.S., 2010. Biosens. Bioelectron. 25, 1338–1343. Zhao, D., Chan, W.H., He, Z.K., Qiu, T., 2009a. Anal. Chem. 81, 3537–3543. Zhao, D., He, Z.K., Chan, W.H., Choi, M.M.F., 2009b. J. Phys. Chem. C 113, 1293–1300. Zhao, L.B., Pan, L., Zhang, K., Guo, S.S., Liu, W., Wang, Y., Chen, Y., Zhao, X.Z., Chan, H.L.W., 2009c. Lab Chip 9, 2981–2986.