Download to read offline
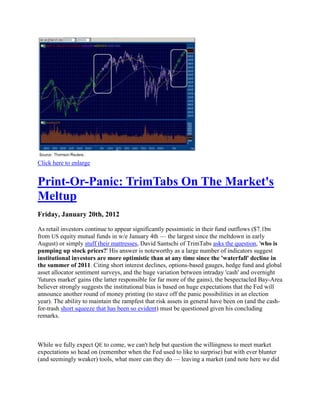
![previously been sold. At this stage larger profits were the rule. At this point the advance had
become so extensive that attempts were being made to find the ―top‖ of the market move such
that the public was executing short-sales, which almost always ended badly.
Finally, in the mature stage of the bull market, the recently active and speculative accounts
would tend not to over-trade or try to pick ―tops‖ using short-sales, but would resolve to buy and
hold. So many times previously they had sold only to see their stocks dance higher, leaving them
frustrated and angry. The customer who months ago had been eager to take a few points profit on
100 shares of stock would, at this stage, not take a 30-point profit on 1,000 shares of the same
stock now that it had doubled in price. In fact, when the stock market finally broke down, even
below where the accounts bought their original stock positions, they would actually buy more
shares. They would not sell;, rather the tendency at this mature stage of the bull market and the
public‘s mindset was to buy the breakdowns and look for bargains in stocks.
The book‘s author concluded that the public‘s investing methods had undergone a pronounced,
and obvious, unintentional change with the progression of the bull market from one stage to
another; a psychological phenomena that causes the great majority of investors to do the exact
opposite of what they should do! As stated in the book, ―The collective operations of the active
speculative accounts must be wrong in principal [such that] the method that would prove prof-
itable in the long run must be reversed of that followed by the consistently unsuccessful.‖
Not much has changed from 1917 and 2012, just the players, not the emotions of fear, hope, and
greed; or, supply versus demand, as we potentially near the maturing stage of this current bull
market. Of course stocks can still travel higher in a maturing bull market, but at this stage we
should keep Don Guyon‘s insight about maturing ―bulls‖ in mind. Verily, this week celebrates
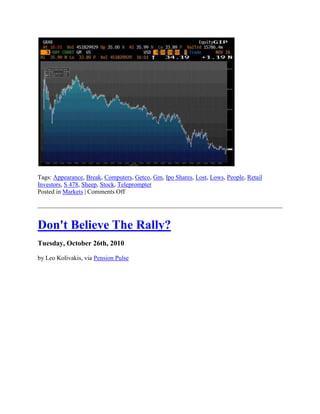
the third year of the Bull Run, which began on March 9, 2009 and we were bullish. With the
S&P 500 (SPX/1369.63) up more than 100% since the March 2009 ―lows‖ it makes this one of
the longest bull markets ever. As the invaluable Bespoke Investment Group writes:
―Going all the way back to 1928, the current bull market ranks as the ninth longest ever. Even
more impressive is the fact that of the nine bull markets that lasted longer, none saw a gain of
100% during their first three years. Based on the history of prior bulls that have hit the three-year
mark, year four has also been positive.‖
Now, recall those negative nabobs that told us late last year the first half of 2012 would be really
bad? W-R-O-N-G, for the SPX is off to its ninth best start of the year, while the NASDAQ
(COMPQ/2976.19) is off to its best start ever! In seven out of the past ten ―best starts,‖ the SPX
was higher at year-end, which is why I keep chanting, ―You can be cautious, but don‘t get bear-
ish.‖ Accompanying the rally has been improving economic statistics and last week was no
exception. Indeed, of the 20 economic reports released last week, 15 were better than estimated.
Meanwhile, earnings reports for 4Q11 have come in better than expected, causing the ratio of net
earnings revisions for the S&P 1500 to improve. Then too, the employment situation reports con-
tinued to improve. Of course, such an environment has led to increased consumer confidence
punctuated by the February‘s Consumer Confidence report that was reported ahead of estimates
at 70.8, versus 63.0, for its best reading in a year. And that optimism makes me nervous.](https://image.slidesharecdn.com/big-120325071326-phpapp01/85/Big-2-320.jpg)
![Commodities in Portfolio Construction (Lee)
Tuesday, March 29th, 2011
Commodities in Portfolio Construction
by Alfred Lee, CFA, DMS
Vice President & Investment Strategist
BMO ETFs & Global Structured Investments
BMO Asset Management Inc.
alfred.lee[at]bmo.com
Monthly Strategy Report March 2011
Over the last decade, commodity and commodity-related investments have gained significant
popularity with both institutional and retail investors. Given their sizable returns over the last ten
years, historical low correlation to traditional asset classes and emerging markets soaking up
much of the supply, it should not come as much of a surprise. Coming out of the credit crisis,
major central banks around the globe, most notably the U.S. Federal Reserve (Fed), were focused
on reflating the global economy.
The co-ordinated easy monetary policies, government stimulus measures along with quantitative
easing were largely a positive for broad commodities which tend to be used as a hedge against
declining currency values and particularly a falling U.S. dollar. Essentially, investors benefited
from merely having exposure to a broad basket of commodity and commodity related
investments.
With global stimulus and the second instalment of quantitative easing1 (QE2) moving further
into the rear-view, the reflation trade should be less of a driver in global commodity prices going
forward, especially considering the Fed is anticipated by some to remove QE2 stimulus this sum-
mer. Independent supply and demand fundamentals as a result should play a more important role
in driving commodity prices going forward. In addition, with political turmoil in the Middle East
and now the unfortunate tsunami in Japan, these issues will have different macro factors on the
varying commodity sub-groups.
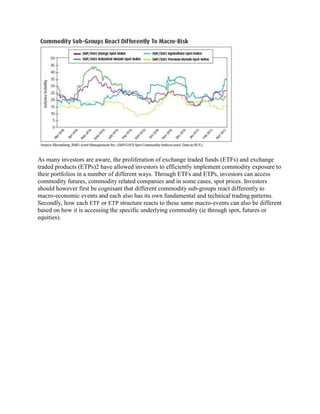
Commodity Differentiation
With that in mind, investors may want to consider commodity differentiation at this point in their
portfolio construction process. As global economic fundamentals slowly improve, correlation
between assets and within assets such as commodities should naturally decrease (as detailed in
the correlation matrices on the following page) in an economic thawing process. Moreover, as
previously mentioned, the negative headlines will have varying impacts and ramifications on
each of the commodity groups. Investors should therefore focus on commodities that have the
best risk-adjusted returns and those which will further optimize their overall portfolio.](https://image.slidesharecdn.com/big-120325071326-phpapp01/85/Big-9-320.jpg)
![Statistics released today by the Shanghai Gold Exchange show that China‘s gold imports have
jumped over 460 percent in just the first ten months of this year. Through October, China‘s gold
imports totaled 209 tons of gold, up from just 45 tons in 2009.
And they‘re not done yet. Historically, the fourth quarter is when China imports the largest
amount of gold so we could see much higher figures when all is said and done.
The import figures were released as a part of a presentation from Shanghai Gold Exchange
Chairman Shen Xiangrong. Chinese inflation worries have picked up steam as the year has pro-
gressed and Shen said ―uncertainties in domestic and global economies, and increasing anticipa-
tion of inflation [in China], have made gold as a hedging tool very popular‖ as investors look for
a store of value, according to several news reports.
Shen added that 70–80 percent of the imported gold has been transformed into mini gold bars
which the Financial Times describes as a ―classic product for retail investors.‖
While the figures are astounding, we‘ve been discussing this developing trend for several years.
Since 2000, the gross national income (GNI) per capita on a purchasing power parity basis has
jumped nearly 200 percent in China.
Without a social safety net, efficient retirement savings vehicles and a limited number of invest-
ment options, these wealthier citizens are turning to the metal that they began using as a currency
more than 4,000 years ago.
We believe the figures released today reflect long-term gold demand and are not short-term in
nature.
Horizons AlphaPro Launches Canada‘s First
Actively Managed Preferred Share ETF
Monday, November 22nd, 2010
Horizons AlphaPro Launches Canada's First Actively Managed Preferred Share ETF](https://image.slidesharecdn.com/big-120325071326-phpapp01/85/Big-23-320.jpg)
!["We're not seeing any sort of growth other than stimulus," says Joseph Saluzzi, co-founder of
Themis Trading. "That is a very disturbing thing — the constant stimulus that keeps on coming
that really does nothing other than barely keep you above [breakeven] on the GDP print."
In addition, Saluzzi says investors are rightfully worried about a market dominated by "high-
speed guys just chasing each other up and down the price ladder."
Unsafe at High Speeds
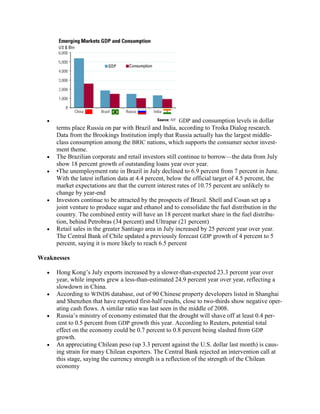
As has been widely reported, high-frequency trading routinely accounts for more than 50% of
daily U.S. equity trading volume and regularly approaches 70%.
Saluzzi isn't opposed to high-frequency trading per se, calling it a "byproduct of the market
structure," as detailed in the accompanying video. But he believes that structure is broken, thanks
to rules promoting computer-driven trading, most notably Reg NMS.
As a result of regulatory changes and new technology, events like the May 6 ‗flash crash' "will
happen again," he says. "There's not a doubt in my mind."
Many retail investors feel the same way, another reason for the mistrust of the rally and why
about $65 billion of the equity fund outflows this year have occurred in the five months since the
"flash crash".
So are high frequency trading (HFT) platforms accounting for 70% of the daily trading volume?
I'm not sure if it's that high but I have no doubt that today's stock market is primarily driven by
multi-million dollar computers developed by large hedge funds and big banks' prop desks.
But what's the best way to beat high frequency trading? Take a long-run view on a stock, a sec-
tor, or an asset class. You're never going to beat the computers day trading but you can make
money in these markets by understanding the weakness of these HFT platforms. For example, if
you hold shares of a solid company and the price plunges on high volume for no real valid rea-
son, chances are some HFT is going on in that company. My advice is to add to your positions on
those dips and just hold on. If you get cute, placing tight stop losses, you're going get burned.
Just like anything else, computers have advantages and disadvantages.
[Note: Keep an eye on Citigroup ©, a favorite target of HFTs, and Research in Motion (RIMM).
Both stocks are primed to break out from these levels. I prefer RIMM.]
What worries me more is what Saluzzi says on how volatility is impacting the IPO market. But
the facts don't back up his claims. In fact, according to Renaissance Capital, $23 billion was
raised in the global IPO market last week, making it the biggest week this year and signaling a
revival in investor interest for this class of equities:
The Hong Kong offering of AIA, a carveout of AIG's Asia Pacific life-insurance business, raised
$17.8 billion, making it the fifth-largest IPO on record. Also Taiwan's TPK Holdings has a $200
million IPO; the firm is the supplier of the touch-screen technology behind Apple's iPad.](https://image.slidesharecdn.com/big-120325071326-phpapp01/85/Big-28-320.jpg)

![―When data contradicts theory in a discipline like physics, there is excitement amongst scientists
[…]. When data contradicts theory in finance, there is dismissal.‖
Robert Arnott
Active management in the equity field is a notoriously difficult art. In fact so difficult that more
and more investors give up and go passive instead. If you can‘t beat them, join them. In the US
alone, retail investors have withdrawn about $350 billion from active equity managers in the past
two years and instead pumped $500 billion into passive investment vehicles (mostly ETFs).
Retail investors are not alone. Sovereign wealth funds, endowments and pension funds are all
allocating ever larger amounts to passive instruments. By one estimate, some $4 trillion worth of
actively managed assets will switch to passive management over the next 5 years(1).
Behind this flight to armchair investing lies a growing realisation that the majority of active man-
agers will never consistently beat the index. Newly published research from Standard & Poors(2)
suggests that for the five year period ending 31 December, 2009, only 39% of active large cap
managers outperformed the S&P500. In mid– and small-cap, the problem was even more pro-
nounced with only 23% and 33% outperforming the respective benchmarks.
It all began with Harry Markowitz, Eugene Fama and the efficient market hypothesis, developed
back in the 1950s. A decade later, when William Sharpe published his work on the capital asset
pricing model (CAPM) on the basis of Markowitz‘s and Fama‘s earlier work, it gradually became
accepted that it is near impossible for most mortals to outperform the market (Warren Buffett is
obviously not a mere mortal). Hence the foundation for passive investing, index funds and ETFs
was laid.
The irony of all of this of course is that ultimately the growth of passive investments will create
anomalies and inefficiencies. Stock prices will be driven more by inclusion/exclusion in the
indices than by the intrinsic value. For stock pickers, such an environment is likely to create
enormous opportunities. But we are not there yet. For the time being, in the equity arena, index
products are likely to continue to outperform the majority of active managers.
So why do most active equity managers underperform? Many a research paper has been written
on this subject, and I am not particularly keen to add to an already long list. I think it is far more
interesting to look for solutions, so I shall answer the question only superficially. The most obvi-
ous reason is cost. Between management fees, performance fees (sometimes), trading costs, cus-
tody and admin fees, active managers often start the year being behind by 2% or more. Not easy.
However, cost alone does not explain the difference between active and passive managers; if it
did, active managers would consistently underperform and that is not the case. ‗Herding‘ is
another reason. We are all prone to it. Herding manifests itself in a number of different ways. For
example, investors tend to fall in love with the same investment ideas, which can drive valua-
tions up in the short to medium term but cause over-crowding longer term and ultimately lead to
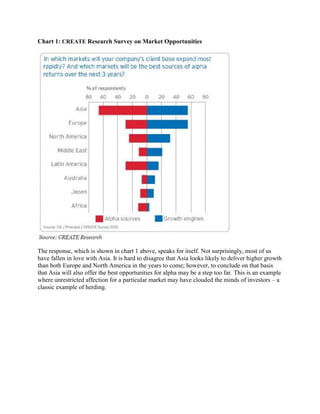
a collapse in valuations (think dotcom). In the survey conducted by CREATE Research, asset
managers from all over the world were asked which markets would be expected to grow the
fastest and which would offer the best opportunities for alpha going forward.](https://image.slidesharecdn.com/big-120325071326-phpapp01/85/Big-35-320.jpg)

The document summarizes an article by Jeffrey Saut discussing the behavior of retail investors over the course of bull markets. It notes that retail investors tend to sell stocks too early after price increases, repurchase the same stocks at even higher prices, and hold on too long during market declines. The article cites a 1917 book that documented this behavior and concludes it still persists today. It warns that with the current bull market in its mature stage, retail investors following these typical patterns could see their stocks continue rising in the short term but face losses if the market declines.