Jse myhtbusters july 2014
•
0 likes•315 views

The investment duo of Mark and Michele bravely tackle the popular Investment Myths head on. Need to know if a trading myth is true or false? Call the Investment Mythbusters! Inspired by the popular TV series with a surprisingly similar name, Vunani Private Clients' Investment Managers Mark Weetman and Michele Santangelo have devoted themselves to combining elements of science, statistics, investment theory and some good old-fashioned luck to determine if popular investment beliefs are true or false.

Recommended
More Related Content
What's hot
What's hot (20)
Similar to Jse myhtbusters july 2014
Similar to Jse myhtbusters july 2014 (20)
Recently uploaded
Recently uploaded (20)
Jse myhtbusters july 2014
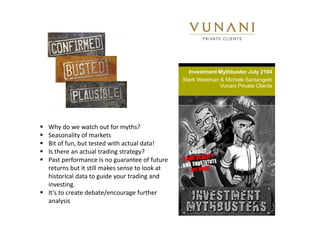
- 1. Investment Mythbuster July 2104 Mark Weetman & Michele Santangelo Vunani Private Clients Why do we watch out for myths? Seasonality of markets Bit of fun, but tested with actual data! Is there an actual trading strategy? Past performance is no guarantee of future returns but it still makes sense to look at historical data to guide your trading and investing. It’s to create debate/encourage further analysis
- 2. As Goes January, So Goes The Year! Will the Santa Clause rally bring you the financial present you deserve Turbo Tuesdays on the S&P. What has happened to Doctor Copper? Sell in May strategy
- 3. As Goes January so goes the Year
- 4. The January Effect – The Myth If the market rises in January, the rest of the year will be positive as well. Some optimists also predict that if the first week of the year is positive, then January itself will show an increase. The experiment is taking January returns and comparing them the average/total returns return of the following 11 months. The January effect has only been able to correctly predict the rest of the years performance 55.6% of the time. The correlation between the two is only 0.19. Not the kind of accurate predictor we would have expected.
- 5. The January Effect – The Myth
- 6. The Santa Claus Rally
- 7. The Santa Claus Rally – The Myth Also known as the “December Effect” A Santa Claus rally is a rise in share prices in the month of December, generally seen over the final week of trading prior to the new year. Black Friday 18 December 2013 – 3 January 2014
- 8. Reasons for The Santa Claus Rally Upbeat forecasts from retailers around the holiday season Positive holiday cheer turns even the most bearish and pessimistic investors positive. U.S. investors tend to fund retirement accounts at the start of the year. – Traders buying in anticipation of the market inflows. Window dressing – Large investors propping up their positions in order to make their performance look better and possibly increase their performance fees (illegal!).
- 9. Average return for all non-December months since 1896 is 0.5%. For Decembers average return is 1.2%. Since 1950, 18th Dec – Jan 3rd avg. 1.5% Last 20 years, the S&P 500 on average gained 1.79% during the month of December. The S&P 500 has posted negative performance only 4 times December ranks as the 3rd BEST performing month for the US stock market.
- 10. Here are the numbers – TOP40 18 Year December is the best performing month on the JSE, averaging 2.6%
- 11. The Santa Claus Rally
- 13. So here’s what you need to do By the 1st December, If we believe that the Santa Clause rally is on the cards we promise to supply you at least four trading ideas. Last years stock picks …
- 21. Turbo Tuesdays on the S&P500 Always be long the S&P500 on a Tuesday – The Myth
- 23. Investing in the S&P without Tuesday makes a huge difference
- 24. Over the last 10 years S&P rallied the most on Tuesdays. Tuesday is 3 times more profitable than any other day. 10 Year History Monday Tuesday WednesdayThursday Friday SPX -0.010% 0.105% 0.018% 0.026% 0.008% TOP40 0.093% 0.046% 0.075% 0.130% 0.004%
- 25. Turbo Tuesdays is plausible on the S&P but what about the JSE 10 Year History Monday Tuesday WednesdayThursday Friday SPX -0.010% 0.105% 0.018% 0.026% 0.008% TOP40 0.093% 0.046% 0.075% 0.130% 0.004% 32 times more profitable than Friday the worst performing day. 1.4 times more profitable than Monday the second best trading day.
- 26. Dr Copper Myth
- 27. Doctor Copper – The Myth Market lingo for the base metal that is “reputed to have a Ph.D. in economics” because of its ability to predict turning points in the global economy. Because of copper's widespread applications in most sectors of the economy - from homes and factories, to electronics and power generation and transmission - demand for copper is often viewed as a reliable leading indicator of economic health. This demand is reflected in the market price of copper. Generally, rising copper prices suggest strong copper demand and hence a growing global economy, while declining copper prices may indicate sluggish demand and an imminent economic slowdown.
- 28. Rising copper price → Rising copper demand → Growing global economy Investors are cautioned that Doctor Copper is not infallible: Temporary shortage of copper may lead to rising prices even as the global economy is slowing down. A copper glut may cause lower prices despite robust economic growth. Doctor Copper – The Myth
- 29. Turns out when Copper makes a new 2-year low, the S&P 500 doesn’t do too bad. Three months later it is about flat, but a year out it jumps 17%.
- 30. We found no real statistical relationship between copper and the returns on the JSE. Analysis shows only a 0.45 correlation and virtually no short term predictive properties. Note the significant disconnect overt the last 3 years. Doctor Copper – Effect on the JSE
- 32. Myth - Sell in May
- 33. Sell in May – The Myth Much is made each year of the old City adage that it pays to avoid the markets over summer: "Sell in May and go away, don’t come back till St. Leger Day". The idea was that with so many sports-related social events in the summer months - Royal Ascot, Wimbledon, Henley Royal Regatta, Cowes Week, and ending with St. Leger flat race, on September 13 this year - that trading volumes plummet and stock market fortunes wane. Summer holidays – no one at the office Of course in today's globalised markets, this seems at best far-fetched. The actual figures also cast considerable doubt on the theory.
- 34. Sell in May – The Facts on the JSE Jan Feb Mar Apr May Jun Jul Aug Sep Oct Nov Dec Rank ( 1is best performing month) 3 9 6 4 5 12 10 8 11 2 7 1 Return (18Year average) 2.19 0.62 1.30 1.85 1.36 -0.99 0.54 0.65 0.14 2.39 1.00 2.60 May in fact the 5th best performing month up on average 1.36%. May is negative 42.1% of the time. Including 2014. June is negative 63.15% of the time. Had an investor sold every May and bought back during Sep, would have missed out on 1.7% annualized return. Even selling at the end of May and reinvesting in September would have resulted in an investor being 0.09% worse off and even more if you take costs into account.
- 35. Sell in May June to September is the softest period on the JSE. Averaging 0.09% return. The Myth should be sell at the beginning of June and buy back at the end of June.
- 36. Blowing things up – Mythbuster style Blowing things up – Market Crash every 5-7 years
- 37. Blowing things up – Mythbuster style Much talk about market bubbles & potential crashes. The financial system experiences a crisis “every five to seven years,” Chief Executive Officer Jamie Dimon, JPMorgan Chase & Co. Despite concerns about high prices (from people like me), stocks have meandered higher over the past 6 months. And they are now, once again, setting new all-time highs.
- 38. The Fed is now tightening Stocks are expensive
- 39. While researching the views of analysts and market gurus over the last few weeks in preparation for this myth we noticed numerous reports spanning over the last 3 years all saying a crash is immanent. Many of those analysts just re published their research just changing the dates. The potential for a crash or a market correction is certainly possible. Exactly when we don’t know.
- 40. Hedge your equity portfolio using: • Futures • Options Profit from the collapse by shorting shares or Single Stock Futures or eCFDs Buy the dips! The market is the best generator of wealth over the long term Blowing things up – Market Crash every 5-7 years
- 41. As Goes January, So Goes The Year! Will the Santa Clause rally Turbo Tuesdays on the S&P. What has happened to Doctor Copper? Sell in May strategy
- 42. Mark Weetman and Michele Santangelo Vunani Private Clients Mark@vunaniprivateclients.co.za Michele@vunaniprivateclients.co.za 011 384 2914 Questions?