SlideShare a Scribd company logo
1 of 35
Download to read offline
Whitney R. Tilson
Managing Partner

phone: 212 277 5606
WTilson@KaseCapital.com

October 10, 2013
Dear Partner:
Our fund rose 3.9% in September vs. 3.1% for the S&P. For the quarter, it declined 2.3% and is
up 6.3% year to date vs. 5.2% and 19.8%, respectively, for the S&P.
The story in Q3 mirrored the story of the year so far: solid performance among the stocks we
own (our average long is up nearly 30%), offset by the headwinds of cash and the short book.
I’ve been doing a great deal of thinking and been having many discussions with the smartest
people I know in this business about these two headwinds and what, if anything, I should do
differently. I’ve reached a number of conclusions.
Holding cash and long exposure
My biggest mistake since I started managing the fund myself 15 months ago has been
underexposure on the long side. I’ve been holding 20-40% cash during most of this period,
positioning our fund conservatively – practicing the principle of “be fearful when others are
greedy and greedy when others are fearful” – in light of the widespread complacency in the
equity markets and the fact that the major indices have regularly been hitting multi-year or even
all-time highs. I let my concerns about the market affect how I positioned our fund, with the
result that instead of being at my target exposure of 100% long by 30% short, I was typically
closer to 70% long by 30% short, which has been costly in light of the market’s strong upward
move.
Holding such a large amount of cash can make sense for a long-only fund but, when combined
with a substantial short book, is overly conservative in the absence of great conviction that the
market is about to implode. In the nearly 15 years that I’ve been managing money professionally,
I’ve only twice felt this way: in late 1999/early 2000 at the peak of the internet bubble, and in
early 2008 when my research led me to believe that the consequences of the bursting of the
housing bubble would be much worse than nearly anyone believed at that time.
Today, I don’t have this feeling. While there are plenty of things that could upset the current
complacency in the markets – for instance, the current government shutdown continuing;
Congress failing to raise the debt ceiling; unexpected consequences from the recent jump in
interest rates; and/or a sharp economic downturn in Europe, China, Japan, or emerging markets –
my best guess is that the U.S. economy will continue to muddle along, as it has been doing for
the past few years.
As such, going forward I plan to be more disciplined about maintaining my target exposures on
both the long and short sides, but also to, on rare occasions, hold more cash and/or increase the
fund’s short exposure.

Carnegie Hall Tower, 152 West 57th Street, 46th Floor, New York, NY 10019
The fund is currently 86% long and 22% short, both of which I plan to increase in the near
future.
Casting a wider net
I’ve historically invested almost exclusively in American companies that are subject to U.S.
auditing and filing rules and trade on one of the major U.S. exchanges. I have deep experience
here, shareholders are well protected, and I have always been fearful of straying outside my
circle of competence and being the proverbial sucker at the poker table were I to invest
elsewhere.
I think I’ve been too dogmatic about this, however, and over time plan to invest some time and
energy into becoming familiar with foreign companies and markets. I don’t expect to become a
truly global investor anytime soon (if ever), but there are great investment opportunities all over
the world and I think expanding my investment horizons will serve us well over time.
To date, I have many only one investment in a foreign company, Hyundai Motors preferred
stock.
Hyundai Motors preferred stock
I recently established a nearly 2% position in the preferred stock of Hyundai Motors. I can hear
you thinking: “A Korean automaker? What are you thinking???” The simple answer is that this is
an excellent company with bright future prospects, and I was able to purchase it – through the
preferred stock – at a ridiculously cheap price: 3.4x trailing earnings (not EBITDA, but real
earnings).
Over the past 15 years, Hyundai, under the leadership of M. K. Chung (whose family owns more
than 20% of the company), has transformed itself from a third‐tier industry laggard into the
world’s third largest automaker, and has been steadily gaining share, as this chart shows:
Hyundai’s Global Market Share

-2-
Remarkably, the company hasn’t gained share by sacrificing profits – in fact, it has consistently
had the highest profit margins among the largest global automakers, as this chart shows:
Consolidated Operating Margin, 2009-Q2 2013

Ah, but it’s an automaker, so the balance sheet must be a mess, right? Nope. The company has
$20.7 billion in cash (43% of the company’s market cap of $48.3 billion), its debt is tied to its
finance arm and more than offset by associated assets, and there are no long-tailed pension and
healthcare liabilities that crippled the U.S. automakers (“net defined benefit liabilities” are a
mere $906 million).
Even without adjusting for the excess cash, the company has generated a high-teens to low-20%
return on equity for a number of years.
To summarize, this is a good business (albeit in an admittedly lousy industry) that has done very
well in recent years – and the stock has responded, rising more than 6x from its late-2008 lows.
Nevertheless, today it trades at a mere 8.4x trailing earnings – and pays a small 0.8% dividend to
boot. That’s cheap and I might be tempted to buy it – but not when I can instead own it through
Hyundai’s Series 3 preferred shares, which trade at a 59% discount to the common stock,
meaning we own it today at 3.4x earnings (and will receive a 2% dividend as well).
Korean preferred shares
Korean preferred shares came into existence in the mid-1980s thanks to a favorable law that
allowed Korean companies, many of which are run by families that didn’t wish to dilute their
control, to issue equity in the form of preferred shares, which typically had the same economic
rights as the common stock, but few or no voting rights. Nearly 150 companies issued preferred
shares before the law was changed long ago.
For many years, the preferred shares traded at around a 20% discount to their associated common
stocks, but during the panic of the Asian financial crisis in 1997, they traded down to more than a

-3-
70% discount and, since then, have traded at a 40-70% discount. The current discount is around
60%.
I can find no good reason for such a large discount, especially in light of the fact that the Korean
market is steadily becoming more shareholder friendly. Obviously, some discount is warranted,
but as this chart shows, the preferred stock discount in Korea far exceeds that of other countries:
Preferred Stock’s Discount By Country

I believe that this is one of those market anomalies in which something is mispriced primarily
because it’s always been mispriced. I have no idea when this discount will close, but my
experience, to paraphrase Ben Graham, is that while in the short run the market is a voting
machine, in the long run it’s a weighing machine. As Korea continues to become more investor
friendly, I think the preferred share discount is likely to close over time, which gives me a
second way to win on this investment (the first being that Hyundai continues to do well and its
common stock rises over time).
A final thought: I take some comfort investing in Korea after reading this transcript of a Q&A
Buffett did in April 2009 with University of Kansas students:
[Buffett then pulled out the 2004 Korean Stock Guide compiled by Citigroup]. My broker at
Citigroup told me to look through this Korean version of the Moody’s guide. He said it would
look just like 1951. He was right. I began flipping through the pages and found a lot of good
companies trading at very low multiples. In 5-6 hours I put together a small portfolio of 20-25
stocks – about $100 million total. One example was DaeHan Flour Mills. It has a 25% market
share in wheat flour in South Korea . Book value was 206,000 Won and the company had
201,000 Won in marketable securities and was trading at 2x earnings. The market is clearly not
efficient all the time. There are certain opportunities that can make you fabulously rich.

Shorting
I have two strong feelings about shorting right now:

-4-
1) It’s a horrible business, it’s cost all of us dearly over the past 4½ years, I wish I’d never
heard of it, and every bone in my body wants to cover every stock I’m short and never
short another stock again; and
2) In my nearly 15-year career of professional investing, the only other times that have been
as target-rich in terms of juicy, obvious shorts are late 1999/early 2000 and late
2007/early 2008 (and we all know how those ended…).
So which feeling am I going to follow? The latter. Not because I am unreasonable, stubborn and
a glutton for punishment, but because I am convinced that I can make a lot of money on the short
side going forward.
The only other time in my investing career in which I seriously considered covering every short
and becoming a long-only manager was October 2007. At that time, I went through my short
book, stock by stock, and said, “OK, am I willing to cover MBIA at $70? Hell no, not a single
share! Allied Capital at $30? Hell no, not a single share! Farmer Mac at $30? Hell no, not a
single share!” And on it went… I couldn’t bring myself to cover a single share of any stock I was
short – they were all “trembling-with-greed” shorts. And that’s exactly how I feel today.
Let me be clear: I have no illusions about what a tough business shorting is. In most years, in
fact, I expect that it will detract slightly from our returns. But that’s a price I’m willing to pay for
a number of reasons:
1) Having a short book allows me to invest more aggressively on the long side, both in terms of
overall portfolio positioning, individual position sizes, and willingness to take risks in certain
stocks. Here are some examples of what I mean:


I wouldn’t be comfortable taking our fund’s exposure up to 100% in the current market if it didn’t
have meaningful long exposure;



I wouldn’t have held onto my position in Netflix as it’s risen from just above $50 to more than
$300 over the past year if our fund wasn’t short a number of similarly volatile, speculative stocks;



I wouldn’t hold such a large position in Howard Hughes (9.5%), another huge winner for us, if
our fund weren’t short St. Joe, which is also closely tied to the real estate/housing market; and



I’m not sure I would feel comfortable owning economically sensitive stocks like Hertz and Avis
if our fund weren’t short many stocks that I expect would do very poorly if the economy
weakens.

2) A short book typically pays off just when you need it, during severe market declines,
providing cash to invest on the long side when it’s most attractive. This is exactly what happened
in 2008 and early 2009. After inflicting losses as the market rose from early 2003 through
October 2007 (the same length of time as the current bull market), our substantial short book
cushioned the downturn – our fund was down approximately half the market in 2008 – and
allowed me to invest aggressively on the long side, which translated into big gains after the
market bottomed in March 2009.
-5-
3) I sleep better at night with insurance. At the beginning of every year, I write a check for
homeowner’s insurance and at the end of the year, when my apartment hasn’t suffered from a
flood or fire, my insurance expires worthless and I have to buy it again. Is it a mistake to buy
insurance that turns out to be worthless almost every year? Of course not.
I suspect most people wouldn’t quarrel with buying cheap insurance – but it hasn’t been cheap!
Over the past 15 months, losses on the short side have offset most of the fund’s gains on the long
side, despite long exposure being at least twice as large as short exposure. In other words, our
fund’s short book has performed unusually badly.
So is the problem that I’m simply uniquely bad at shorting (in which case, I should just stick to
the long side)? I think not. I know, talk to, and read the investor letters of dozens of valueoriented long-short fund managers like me and pretty much to a person they report carnage in
their short books. One can see this reflected in the HFRX Equity Hedge Fund Index, which was
up 6.7% year to date through September – less than half the return of the S&P 500, due largely to
losses on the short side I have no doubt.
In the past year, I’ve seen more pain inflicted upon short sellers than at any point since the
internet bubble in 1999 and early 2000. One 20+ year veteran said it well when he told me:
I don’t have the antidote to your pain. We’ve been bludgeoned by this melt-up as well. It’s
unbelievably unpleasant.
I’ve never seen such widespread capitulation among seasoned short sellers. Many are out of
business.
This stretch is worse than the internet bubble for me. It’s constant pain across my entire short
book, whereas the internet was isolated to one industry – and then you got relief when the bubble
burst.

So while it’s been painful, this is the kind of environment, I believe, in which those with the
courage to maintain a short book will be well rewarded.
Adjustments to my short strategy
This isn’t to say that there isn’t room for improvement. There is. Specifically, I plan to make the
following adjustments:
1) Smaller positions. Over the last 15 months, I’ve been managing the fund’s short book
identically to its long book in terms of the number of positions – about a dozen exceptionallyhigh-conviction positions – but roughly half the size. Thus, the average long position has been
around 5-6% whereas the average short was in the 2-3% range.
I’ve learned the hard way the perils of sizing too many short positions above 2%. Every five or
ten years, the market goes through periods like the current one in which overvalued stocks can
become even more overvalued, rising 50-100% or more, which causes a lot of pain and
sometimes forces me to cover some of the positions to manage risk.

-6-
Going forward, I plan to size new short positions around 1% rather than 2%, which I expect will
enable our fund to better weather the market’s periodic bouts of foolishness.
This means, of course, that the fund’s short book will be comprised of more positions, but I
believe I can manage this, especially in light of today’s incredibly target-rich environment.
2) Better match the fund’s long and short positions. A meaningful percentage of the fund’s long
exposure over the past year has been in large-cap stocks like Berkshire Hathaway, AIG,
Citigroup and Goldman Sachs, whereas the short positions have tended to be in smaller, more
volatile, heavily shorted, battleground stocks. These stocks tend to be the most overvalued and
have the potential to fall the furthest – often, I believe, 100% – but they can also rise the most
during periods of excess liquidity and complacency. (It hasn’t been a complete mismatch, as the
fund’s long book has some similarly volatile stocks like Netflix, Spark Networks, and Deckers,
all of which have performed beautifully.)
Going forward I plan to better balance the fund’s long and short positions by having a wider mix
of stocks on the short side. Among my three favorite types of shorts, fads, frauds and failures,
I’ve had too many of the first two and not enough of the letter – what one friend called “reverse
compounders.” A good example in our short book today is St. Joe, a stock I’ve written
extensively about in past letters, where very little is happening and I see minimal value beyond
the timberland.
3) Be more patient. I’ve been reasonably successful over the years in being able to identify
hugely overvalued stocks, but have been less successful in getting the timing right. I find that I
can frequently correctly foresee what’s going to happen a year or two in the future – but am often
amazed at how the market – especially this market – ignores huge red flags at certain companies
and runs their stocks up further in the short term. I’ve certainly gained a greater appreciation for
the power of short-term stock price momentum and am going to make more of an effort to be
patient, stay out of the way of freight trains on the way up, and make money shorting these types
of stocks on the way down. Allow me to illustrate this with two examples.
First, I’ve recently cut our fund’s short position in World Acceptance, which I discussed at
length in my Q2 letter, from a bit over 2% to 0.5% – not because I’ve lost any degree of
conviction in investment thesis, but rather because I recognize that it might take some time,
perhaps even years, for regulators to act to rein in this company. In the meantime, exploiting the
vast majority of its customers is a heck of a good business, so I expect the company will continue
to grow – and its share price will continue to rise – so I’ll patiently wait with a toe-hold position
until there’s clear evidence that regulators are taking action and only then size up the position.
Sure, I’ll miss the peak and the stock might be down 10-20% before I act with conviction, but I
think the downside here is 70-100%.
Another example of the need for me to be more patient is Green Mountain Coffee Roasters,
where I’ve twice been too early. Here is the stock chart over the past five years:

-7-
I shorted the stock much too early in 2010, took a lot of pain as it skyrocketed during most of
2011, and then made it all back and then some as it collapsed in late 2011 and early 2012. But I
would have made more if I’d waited until after the company missed expectations and lowered
guidance to short it. Even though the stock had fallen 20% at that point, it was still a great short
because the momentum was broken yet the valuation remained extreme (it ultimately ended up
collapsing by more than 80%).
I then covered the position and waited to see if I might get another opportunity to short it, as the
two patents that gave the company monopolistic pricing and market share for its K-cups expired
in September 2012. My research led me to believe that numerous competitors would then enter
the market and both take market share and force Green Mountain to reduce pricing, severely
impacting Green Mountain’s profitability, especially since it’s a high-cost producer.
Sure enough, the stock more than doubled off its lows and I reestablished the short position from
January through April of this year at prices ranging from $40 to $55 – and got run over as the
stock rocketed to nearly $90 by the end of August (it has since pulled back to around $67).
My mistake earlier this year was that, while I was confident that new competitors would emerge
soon after Green Mountain’s patent expired, they had not yet done so to any material degree.
Thus, the company was able to report a couple of strong quarters, pooh-pooh competitive threats,
and give rosy guidance, which led to the stock doubling. Shame on me for not recognizing that it
would take time for competitors to ramp up K-cup production and win shelf space among the
nation’s retailers.
But today, the evidence is clear that a competitive tsunami is hitting Green Mountain. As you can
see in this chart, competitors already have approximately 20% of the market and are gaining
more than one percentage point per month (as shown by the green line):
-8-
Nielsen Single Serve Data ($ Market Share)
100%

80%

60%

40%

20%

0%
Jul-09 Nov-09 Mar-10 Jul-10 Nov-10 Mar-11 Jul-11 Nov-11 Mar-12 Jul-12 Nov-12 Mar-13 Jul-13
GMCR Owned

GMCR Licensed

Non-Licensed

The latest Neilsen data out yesterday revealed even worse news: K-cup unit sales for Green
Mountain owned and licensed brands rose a mere 4.5% year-over-year in September while
average pricing fell 3.3%, resulting in tepid 1.1% dollar sales growth – all terrible numbers that
are far below the company’s guidance and analyst estimates, so it’s not surprising that the stock
fell 7% yesterday (and it’s down again today on news that Whole Foods is now selling private
label K-cups).
Some savvy investors are starting to realize what is happening, as the stock is now down 25%
from its recent high, but most investors and analysts still appear to be in the dark – and Green
Mountain is, of course, trying to keep them there: at its analyst day last month, it presented a
slide with old data showing that non-licensed K-cups had only 8% of the market.
Another important data point is a recent survey of buyers and store managers at leading retailers
nationwide. A majority of the respondents said that while K-cup sales are still rising, “GMCR KCup growth rates decelerated, compared with early 2013, and GMCR lost market share.” Here
are some quotes:



“Green Mountain’s rate of growth is decelerating because there is so much more competition out
there, and private label is giving them a run for their money. Everyone is getting into the [pods]
business.”
“The K-Cup people are coming out of the woodwork. In a way, it reminds me of craft beers – lots
of local brands. It is open season right now.”



“They’re all discounting now, trying to compete with each other and with private label.”



“We pulled a couple of Green Mountain ads because we did not want to go out there at $6.99
after the competition’s $4.99 ad.”

-9-


“Discounting is much more aggressive now due to competition; that’s what is driving the prices.
Green Mountain hasn’t been as aggressive and that’s why they’re in so much trouble right now.”

A small anecdote that supports my thesis – this is what I saw when I visited Costco yesterday:

Costco is selling four brands of K-cups: (from left to right) Starbucks, Green Mountain,
Newman’s Own, and Kirkland. Starbucks and Newman’s Own are both licensees of Green
Mountain, whereas Kirkland is the Costco store brand, so in terms of shelf space, the nonlicensed brand has 25% share. I don’t know actual sales of course, but note the pricing: at first
glance, it appears to be identical: $37.99/box for each brand. But look closer: the Kirkland box
has 100 K-cups whereas the others only have 80 – in other words, Green Mountain’s K-cups are
25% more expensive. In this hyper-competitive world, I don’t think that kind of price
discrepancy is sustainable.
I think it is highly likely that Green Mountain and its licensees continue to lose unit market share
at a rapid rate and will be forced to continue cutting pricing as well, which will severely impact

-10-
Green Mountain’s earnings – and its richly valued stock, currently trading at 24x trailing
earnings.
As an added bonus, the numbers Green Mountain is reporting don’t make sense to me, which
makes me suspicious that, at the very least, the company has too much inventory and/or is
stuffing the channel, which I discuss in an article I published a few weeks ago, Green Mountain
Coffee: One Of My Favorite Shorts (see Appendix A).
In summary, while I was too early in getting back into the GMCR short, I’m convinced that the
stock is a fantastic short today and hence it’s among my largest at 2.2%.
K12
I gave a detailed presentation on why K12 was our fund’s largest short position at the Value
Investing Congress three weeks ago (I emailed you the slides the following day; the latest
version is posted here). At the time, the stock was at $35.15. In the following weeks, the stock
trickled down to around $28 – and then the company gave weak guidance after the close on
Tuesday and the stock crashed 38% yesterday to $17.60, down by nearly half since I went public
with my concerns.
Here is page 8 of my presentation, which summarizes my investment thesis:
•

K12’s aggressive student recruitment has led to dismal academic results by students and sky-high
dropout rates, in some cases more than 50% annually
•

I wouldn’t be short K12 if it were carefully targeting students who were likely to benefit from its
schools – typically those who have a high degree of self-motivation and strong parental commitment
 But K12 is instead doing the opposite; numerous former employees say that K12 accepts any
student and actually targets at-risk students, who are least likely to succeed in an online school

•

There have been so many regulatory issues and accusations of malfeasance that I’m convinced
the problems are endemic
• Enrollment violations, uncertified teachers, illegally siphoning profits from nonprofit entities
• States (and the IRS) are waking up to what K12 is doing and the company is coming under
increased scrutiny, which is beginning to impair K12’s growth – and I believe this trend will
accelerate
• K12’s founder, Knowledge Universe, distributed its entire stake to its investors earlier this month
• Yet the stock, trading at nearly 50x trailing earnings, is priced as if K12 will continue to grow at
high rates for the foreseeable future and also improve on its persistently low margins and free
cash flow
Like subprime lending and for-profit colleges, the business makes sense on a small scale but, fueled
by lax regulation and easy government money, the sector, led by K12, has run amok

For more on K12, see my article, An Analysis of K12 and Why It Is My Largest Short Position,
published on September 22nd (Appendix B) and the article I just published today, Why I’m Not
Covering My K12 Short (Appendix C).

-11-
Conclusion
Thank you for your confidence and support. If you have any comments or questions, please call
me anytime at (212) 277-5606.
Sincerely yours,

Whitney Tilson
The unaudited return for the Kase Fund versus major benchmarks (including reinvested
dividends) is:
Kase Fund – net
S&P 500
HFRX Equity Hedge Fund
Index

September
3.9%
3.1%
1.4%

Q3
-2.3%
5.2%
n/a

YTD
6.3%
19.8%
6.7%

Since Inception
123.9%
79.4%
n/a

Past performance is not indicative of future results. Please refer to the disclosure section at the end of this letter. The Kase Fund
was launched on 1/1/99.

Kase Fund Performance (Net) Since Inception
200
180
160
140
120
100
(%) 80

60

40
20
0
-20
-40
Jan-99 Jan-00 Jan-01 Jan-02 Jan-03 Jan-04 Jan-05 Jan-06 Jan-07 Jan-08 Jan-09 Jan-10 Jan-11 Jan-12 Jan-13

Kase Fund
Past performance is not indicative of future results.

-12-

S&P 500
Kase Fund Monthly Performance (Net) Since Inception
1999
2000
2001
2002
2003
2004
2005
2006
2007
2008
2009
2010
2011
2012
2013
Kase S&P Kase S&P Kase S&P Kase S&P Kase S&P Kase S&P Kase S&P Kase S&P Kase S&P Kase S&P Kase S&P Kase S&P Kase S&P Kase S&P Kase S&P
Fund 500 Fund 500 Fund 500 Fund 500 Fund 500 Fund 500 Fund 500 Fund 500 Fund 500 Fund 500 Fund 500 Fund 500 Fund 500 Fund 500 Fund 500
January

7.8

4.1

-6.3

-5.0

4.4

3.6

-1.8

-1.5

-5.5

-2.6

4.7

1.8

1.1

-2.4

1.9

2.7

2.4

1.7

1.9

-5.9

-3.6

-1.6

-3.6

-2.8

2.4

12.6

4.5

4.5

5.2

February

-2.9

-3.1

6.2

-1.9

-0.6

-9.2

-1.1

-2.0

2.9

-1.6

7.0

1.5

2.1

2.0

-3.1

0.2

-3.3

-2.1

-6.9

-3.3

-8.9 -10.8 7.3

3.1

4.1

3.4

-0.8

4.3

0.8

1.4

March

4.1

4.0

10.3

9.8

-2.6

-6.4

3.0

3.7

1.4

0.9

3.9

-1.5

3.9

-1.7

3.9

1.3

-0.8

1.1

-2.3

-0.5

2.9

9.0

4.6

6.0

-4.1

0.0

10.9

3.3

1.3

3.8

April

2.1

3.7

-5.1

-3.0

5.1

7.8

-0.2

-6.0 10.5

8.2

2.4

-1.5

0.6

-1.9

2.2

1.4

4.4

4.6

-0.9

4.9

20.1

9.6

-2.1

1.6

1.9

3.0

1.3

-0.6

0.1

1.9

May

-5.7

-2.5

-2.8

-2.0

1.8

0.6

0.0

-0.8

6.6

5.3

-1.4

1.4

-2.6

3.2

1.8

-2.9

2.5

3.3

7.9

1.2

8.1

5.5

-2.6

-8.0

-1.9

-1.1 -13.6 -6.0

2.8

2.3

June

2.2

5.8

4.1

2.4

4.6

-2.4

-7.3

-7.1

2.9

1.3

0.1

1.9

-3.1

0.1

-0.2

0.2

-3.0

-1.5

-1.2

-8.4

-5.0

0.2

4.5

-5.2

-2.4

-1.7

-1.3

July

-0.7

-3.2

-3.6

-1.6

-1.1

-1.0

-5.0

-7.9

2.3

1.7

4.6

-3.4

0.5

3.7

-0.9

0.7

-5.4

-3.0

-2.5

-0.9

6.8

7.6

3.5

7.0

-4.6

August

4.1

-0.4

5.4

6.1

2.5

-6.3

-4.3

0.5

0.4

1.9

-0.9

0.4

-3.2

-1.0

2.9

2.3

1.7

1.5

-3.3

1.3

6.3

3.6

-1.5

September -3.3

-2.7

-7.2

-5.3

-6.1

-8.1

-5.4 -10.9 1.7

-1.0

-1.6

1.1

-1.5

0.8

5.0

2.6

-1.1

3.6

15.9

-9.1

5.9

3.7

1.7

8.9

-9.3

-7.0

October

8.1

6.4

-4.5

-0.3

-0.8

1.9

2.8

6.2

5.6

-0.4

1.5

3.5

-1.6

6.3

3.5

8.2

1.7 -12.5 -16.8 -1.9

-1.8

-1.7

3.8

7.0

10.9

November

2.8

2.0

-1.5

-7.9

2.3

7.6

4.1

5.8

2.2

0.8

0.8

4.0

3.1

3.7

1.9

1.7

-3.6

-4.2

-8.9

-7.1

-1.2

6.0

-1.9

0.0

-0.6

December

9.8

5.9

2.3

0.5

6.5

0.9

-7.4

-5.8

-0.4

5.3

-0.2

3.4

-1.3

0.0

1.4

1.4

-4.3

-0.7

-4.0

1.1

5.5

1.9

0.5

6.7

0.1

YTD
TOTAL

31.0 21.0 -4.5

-9.1 16.5 -11.9 -22.2 -22.1 35.1 28.6 20.6 10.9

2.6

4.9

25.2 15.8 -3.2

8.8

-8.4

0.5

4.1

-1.0

-2.0

0.2

1.4

-0.1

5.1

-4.5 -13.9 -5.4

-7.2

2.3

-5.8

-2.9

0.0

2.6

3.9

3.1

1.6

-1.9

-0.2

-4.5

0.6

1.0

0.1

0.9
6.3

19.8

5.5 -18.1 -37.0 37.1 26.5 10.5 15.1 -24.9 2.1

Past performance is not indicative of future results.
Note: Returns in 2001, 2003, and 2009 reflect the benefit of the high-water mark, assuming an investor at inception.

-13-

-1.7 16.0
Appendix A

Green Mountain Coffee: One Of My Favorite
Shorts

Whitney Tilson
2,017 Followers
September 13, 2013
http://seekingalpha.com/article/1690592-green-mountain-coffee-one-of-my-favorite-shorts
Jesse Eisinger, one of the best investigative journalists around, raises some very good questions
about Green Mountain Coffee (GMCR) and its accounting in his column that ran in the New
York Times earlier this week, Seeking Answers From Green Mountain Coffee, which begins:
Green Mountain Coffee Roasters’ first-ever investor day is Tuesday, and the company is flying
high.
The stock price of the company, which sells coffee machines under the Keurig brand and the little
K-Cups that go in them, has soared more than 260 percent in the last year.
Despite persistent questions, most of Wall Street remains resolutely bullish on Green Mountain,
which has a market value of $12 billion.
In 2010, the company disclosed it was being investigated by the Securities and Exchange
Commission. In 2011, the hedge fund manager David Einhorn, who is betting against Green
Mountain’s stock price, delivered a highly critical 110-slide speech at an investor conference,
raising questions about the company’s future prospects and, more seriously, its bookkeeping. He
followed up a year later with another one.
A class-action lawsuit, which was dismissed, quoted anonymous former employees about
suspicious activities. Green Mountain has said it conducted an internal investigation that cleared
the company.
Green Mountain operates on a razor/razor blade model - selling brewing machines but making its
real money on the K-Cups. It used to disclose exactly how many K-Cups it sold but stopped
doing so in 2010. Instead, it tells investors the year-over-year percentage growth. Wall Street has
dutifully plugged numbers in to estimate the unit sales.

-14-
Last year, Green Mountain faced expirations of the patents that covered its brewing system. Wall
Street has been monitoring whether Green Mountain will lose market share to new private-label
knockoffs. And indeed, a recent Barron’s article suggested that it was losing share faster than
expected.
A recent disclosure from the company’s new chief executive, Brian Kelley, has revived the
questions about sales, as do on-the-ground accounts I have received from former factory and
warehouse workers.
Because Green Mountain’s investor day will give analysts and shareholders unusual access to
company executives, it seems like an opportunity to ask them some hard questions.
Here are a few from me.
*Just how many K-Cups has Green Mountain sold year-to-date and is it less than the Street
understands?...
*How wide is the gap between how many K-Cups the company says it has sold and how many
have ended up in customer’s hands? And why?...
*What explains the unusual movements of Green Mountain inventory described by some former
company workers and associates?...
*What is happening with the SEC.’s investigation of Green Mountain, which the company has
said involves its accounting practices?...

Let’s take a closer look at K-Cups, where the math just doesn’t make sense - and the company
isn’t helping with an explanation. At the analyst day earlier this week (see webcast and 188-slide
presentation here), the company was asked to reconcile this estimate of K-Cups (since, as
Eisinger notes, the company stopped disclosing K-Cup sales in 2010): there are 16 million
brewers, GMCR claims usage (an “attachment rate”) of 1.4 K-Cups per day x 365 days/year,
which results in sales of 8.2 billion K-Cups per year (which doesn’t even count maybe 15-20%
additional consumption away from home).
But GMCR isn’t selling anything close to this number of K-Cups, per both analysts and the
company (see Eisinger’s article), so what gives? My answer: usage is declining. It makes sense
that the people who bought brewers first are likely to be the heaviest users, so the company and
analysts should be modeling declining attachment rates - but of course they’re not.
When Mark Astrachan, the Stifel Nicolaus’ analyst (and the only one with a “sell” rating on the
stock), asked about this at the analyst day, Green Mountain’s CEO Brian Kelley said: “We don’t
multiply it by 365. (inaudible) You’re applying straight math that we don’t do.” (Yes, he really
said that!) When Astrachan tried to follow up, Kelley said: “We’re not going to get into that
here. That’s not the intent and we’re not going to get into the model in that kind of detail here.”
(The “detail” he’s referring to is the attachment rate of the brewers - one of the most important
metrics there is!)

-15-
An even greater concern is that 700-900 million K-Cups can’t be accounted for. Eisinger writes:
That’s a far cry from 5.6 billion. There seems to be a gap in the United States of about 900
million K-Cups.
What’s going on?
Mr. Brandt said the company declined to give its overall sales volume, but said the IRI number
that I was furnished with was too low. He said a company analysis indicated that this portion of
Green Mountain’s sales should be about 2.7 billion, not 2.6 billion.
Still, even if we use the company’s figure of 2.7 billion, total sales in the United States would be
4.9 billion, or about 700 million K-Cups short of what the company has said. That’s a lot of extra
K-Cups sitting in the channel.

Maybe I’m just being paranoid, but I’ve seen this kind of thing before: in many of the China
frauds, companies were booking fake sales, resulting in fake profits. But that leads to a big
problem for the companies: it’s hard to fake all the cash that should be in the bank as a result of
the supposed profits. The solution? Make overpriced/fraudulent acquisitions and/or fake
excessive cap ex to reduce the cash (that was, of course, never there).
Now go back and read David Einhorn’s 110-slide presentation on GMCR at the Value Investing
Congress on Oct. 17, 2011 (posted here) and look at the high-priced acquisitions on pages 50-53
and pages 68-72 on cap ex. Einhorn estimated that $431 million (58%) of GMCR’s 2012 cap ex
was “unexplained” and concluded:




Capital spending is growing much faster than the business
Capital intensity should be getting more efficient as the company achieves scale
The gap is so large and insufficiently explained that it raises questions about what is
being capitalized and casts doubt on the business model

Einhorn gave an update on GMCR in his presentation at the Value Investing Congress on Oct. 2,
2012. He didn’t release the slides, but here are my notes:
GMCR’s cap ex as a percentage of sales was 11.0% in 2011, 13.1% (est.) in 2012, and 9.2%
(guidance) in 2013. Compare this to the 3.3% average in the food products industry, with a range
of 1.0% to 6.3%.
GMCR’s cumulative cap ex from 2007-2012 was $1.043 billion and K-Cup shipments in 2012
were 7.1 billion. Divide these two and you get 14.7 cents of cap ex over six years for each K-Cup
produced in 2012. Einhorn compared this to a competitor, which spent 3.8 cents for each K-Cup
produced (buying the same production equipment as GMCR). Again, massive unexplained cap
ex.
Einhorn then turned to the production capacity that GMCR’s competitors were bringing online
and estimated that they would have enough capacity to take 19% market share by the end of 2012
and 26% by the end of 2013.

-16-
Lastly, Einhorn showed that competitors were already selling K-Cups for 22-39% less than
GMCR was, and highlighted price cuts GMCR had taken that would wipe out nearly all of its
profit.

(Obviously these last two things haven’t occurred yet - but that doesn’t mean they won’t…)
Is GMCR committing massive accounting fraud? I don’t know - and I certainly can’t prove it but there are a number of warning flags, so I sure can’t rule it out. The company could easily put
a lot of these concerns to rest by providing some obvious disclosure - like number of K-Cups
sold - but refuses to (despite providing highly granular disclosure on most other matters), which
makes me all the more suspicious…
The nice thing about GMCR as a short is that I think it’s a good one even if its accounting is
clean because of its very high valuation (29x trailing EPS and 22x FYE 9/14 estimates (if you
believe them)) combined with its patent loss a year ago, which is resulting in a ton of low-cost
competition entering the market (see page 44-48 of Einhorn’s 2011 presentation and my notes
from his 2012 presentation above).
It’s almost never pretty when a company with a monopoly market share and monopolistic pricing
begins to face competition from low-cost generic producers (think what happens when a drug
goes off patent) - but it can take some time for the competition to emerge and impact the
monopolist’s financials, during which time the monopolist can give whatever guidance it wants
(and you can be sure that Wall St. “analysts” won’t question the pie-in-the-sky guidance).
Witness this week’s analyst day…

-17-
Appendix B
An Analysis of K12 and Why It Is My Largest Short Position

Whitney Tilson
2,017 Followers
September 22, 2013
http://seekingalpha.com/article/1707192-an-analysis-of-k12-and-why-it-is-my-largest-shortposition
Last Tuesday at the Value Investing Congress, I gave a 123-slide presentation (posted here)
about my largest short position, K12 (ticker: LRN). In it, I shared the many reasons why I think
the company (and the entire sector) have run amok and why, at 46x earnings, I think the stock is
a fantastic short.
The Bull Case for K12
There are many reasons that explain the bullishness of some investors and nearly all analysts
(seven of the eight who follow the stock have a buy or strong buy on it). First, K12 has grown its
revenue 32% annually over the past decade, as this chart shows:
Revenue ($M)
$900
$800

$700
$600
$500
$400
$300
$200
$100

$0
2004

2005

2006

2007

2008

2009

2010

2011

2012

2013

And analysts are projecting revenue and EPS growth of 16% and 32%, respectively, over the
next 12 months, fueled 10 new schools and enrollment cap expansion of 17,000 new seats. And

-18-
K12 has less than $1 billion in revenue in a market that it says could become as large as $15
billion annually.
It’s also important to note that online schools sector – schools in which students are supposedly
learning by sitting at home all day in front of a computer, interacting with teachers almost
exclusively online – can be an excellent option for certain students – for example, children
whose pace is extremely accelerated, entertainers, solo athletes, teenage mothers who need to
stay home with their babies, victims of bullying, children with cancer, seizure disorders, peanut
allergies, etc.
K12 has a well-regarded curriculum, reports very high parental and student satisfaction, and has
strong political support, especially among Republicans, for giving parents school choice. Finally,
it’s operating in a space, online learning, that has enormous buzz (think MOOCs, etc.).
So what’s not to like? Let me count the ways…
(Note that my critique is specifically of K12, not all online charter schools, for-profit charter
schools or blended learning schools. While I think the online charter school sector has, overall,
run amok, there are a small number of good online schools – and a few students at even the worst
online schools are doing well.)
Weakening Financials and Aggressive Accounting
In my presentation, I show that K12’s profit margins and free cash flows are low and erratic,
days sales outstanding has doubled in the past five years, the company uses aggressive
accounting techniques to inflate reported profits, and K12’s founder, Knowledge Universe,
distributed its entire stake to its investors only a few weeks ago. But I want to draw particular
attention to this chart, which shows that year-over-year revenue growth – critical for a stock
trading at 46x earnings – has been falling sharply over the past two years, and is projected to fall
further in the next year (to 16%):
Year-Over-Year Revenue Growth
50%

40%

30%

20%

10%

0%
Q1 '11 Q2 '11 Q3 '11 Q4 '11 Q1 '12 Q2 '12 Q3 '12 Q4 '12 Q1 '13 Q2 '13 Q3 '13 Q4 '13

-19-
Aggressive Recruitment Leads to Vast Numbers of Students Destined to Fail
While online schools can be an excellent option for certain students, it’s a very small number –
typically those who have a high degree of self-motivation and strong parental commitment. It’s
sort of obvious if you think about it. Do you think you would have learned more during your K12 educational experience if you’d sat at home in front of a computer, or gone to school and had
daily face-to-face interaction with teachers? How many of today’s youth – in a world filled with
500 TV channels, texting, video games, etc. – do you think are better off at home rather than
being at school? Lastly, what do you think the answer is for the most at-risk kids, who typically
come from poor, single-parent households, in which the parent has little time or ability to be the
“parent coach” that’s so critical to online education?
Tom Loveless, an education researcher at the Brookings Institution who did paid consulting for
K12 in its early years, said: “The enthusiasts for cyber learning have overstated the potential.
What they keep forgetting is we’re not talking about college students here. We’re talking about
high schoolers and young kids. The idea that parents go to work and leave their kids in front of a
computer—it’s absurd.”
In short, online schools are only educationally appropriate for a very small number of students,
which means that K12 and its peers need to be highly selective in recruiting students, warning
parents away whose kids are unlikely to succeed at an online school, especially at-risk youth.
So what does K12 do? Exactly the opposite. Since going public in late 2007, numerous former
employees have told me that K12 has adopted a growth-at-any cost mentality in order to support
its richly priced stock. Jeff Shaw, the former Head of School of Ohio Virtual Academy (which
today accounts for 11% of K12’s revenue), told me:
After the IPO, I got discouraged because the company’s priority seemed to shift from academics
to growth – it wasn’t so much about academic achievement but on delivering the promised
enrollment numbers to shareholders.
[K12’s] call centers that were encouraging enrollment and enrolling students who were obviously
ill-suited for learning in a virtual environment. It was apparent to those of us operating schools
that parents weren’t being given the whole story. K12 oversold students’ potential to be
successful and obligated teachers to do things they wouldn’t likely to be able to do.
Eventually, it seemed as though K12’s enrollment strategy was to cast a wide net into the sea of
school choice and keep whatever they caught regardless if the catch was appropriate for virtual
learning or not.
…I am shocked that the stock continues to rise. I think it’s a house of cards that is going to
collapse. It boggles my mind when I read about and hear stories about what’s going on in schools
managed by K12.

Numerous other insiders confirm that what Shaw observed at his school was equally true across
the company (notes from these interviews as well as the entire interview with Shaw are included
in my presentation).

-20-
Deliberately Targeting At-Risk Students
Worst of all, K12 in recent years has been deliberately targeting at-risk students, who are least
likely to succeed at an online school. K12 CEO Ron Packard claims that it’s for noble reasons:
It’s just K12’s culture. We want to help kids. It’s just so ingrained all the way through the
organization about helping as many kids, doing the right thing for kids.

At another time, he said:
We don’t want to be recruiting kids who it’s not right for. That would be a disaster academically.
It would be a disaster for the company economically.

This is nonsense. Luis Huerta, Associate Professor of Education & Public Policy at Teachers
College, Columbia University, who has studied K12 carefully and published reports on virtual
schools, told me:
The virtual providers like K12 are now mostly going after at-risk kids, kids on their last straw – if
they didn’t sign up, many would be dropouts or go back to juvenile court.
K12’s phone banks have figured out a way to target dropouts and special ed kids. They will sign
up anyone – as long as that warm body signs in periodically, K12 can draw enrollment money
from the district.
It isn’t for some noble reason – it’s because these kids demand the least amount of education.
These aren’t kids and parents who will be knocking on K12’s doors saying, “Hey, you need to do
more for my kid.”
K12 and Packard use this as an advertisement, saying they’re doing noble things and wondering
why they’re being criticized. It’s almost comical. It’s so misleading and conniving.

Again, numerous people confirm Huerta’s account. One person told me that online charters
know that “internet advertising leads to lots of students enrolling, but none succeed. Yet online
charters are spending big money on this.”
And a former Employment Consultant wrote the following on the web site, Glassdoor:
They push these quotes and “true stories” about all the children they have helped, but the truth is,
this product is really only good for about 10% of the market that they target. The only success
stories come from homes where there is a large parental support and willingness for the student to
learn. K12 markets to low income families who are oftentimes more interested in a free computer
and staying out of truancy court than anything else. Not only that, but the curriculum (which is
actually very well developed) simply will not work for a low educated family who is having a
hard time getting their child to go to a brick and mortar school, let [alone] apply themselves in a
home based environment. They push enrollments on families where the adult in the home cannot
even read, speak, or write in English, knowing that these students are destined to fail.

-21-
While K12 celebrates how many at-risk students it’s serving, I view it as an educational
catastrophe in light of the these students’ need for intensive, personalized instruction and hence
how inappropriate online education is for most of them.
Low Spending on Teachers, Who Are Harried, Overworked and Unsupported
K12’s online schools spend far less on teacher and administrator salaries than regular schools, as
this chart shows:
Per-Pupil Expenditures for Salaries, 2008-09

Source: Understanding and Improving Full-Time Virtual Schools: A Study of Student Characteristics, School Finance, and School Performance
in Schools Operated by K12 Inc., National Education Policy Center, 7/12.

In light of such low spending, it’s not surprising that many teachers report excessive class sizes
and feeling harried, overworked and unsupported. One teacher I spoke with, who taught English
from 2010-12 at Agora Cyber Charter School, K12’s largest, accounting for 14% of the
company’s total revenues, told me:
It was a horrible experience. Every teacher had the same experience I did.
Before I started, I was told there would be a lot of support, a low student-teacher ratio, and that if
there were students who didn’t show up, they’d take them out and replace them with another. But
they took everybody. There was no teacher to student ratio.
When I started, I was assigned 300 students, which was very, very overwhelming. I would try to
read each of the essays students turned in a try to grade it and spend the appropriate time, but I
was really struggling with that. I couldn’t keep up. I was told to skim over the papers and grade
with a rubric.
For each class, I’d have maybe seven out of 30 students in that particular section attend – and
even among those seven, just because their name was there showing them present doesn’t mean
they were at their computers.
A huge portion of my students never showed up or did anything. I have no clue what happened to
them, though I have no doubt Agora was charging the state for them.

-22-
When it came time to give grades, I was told, whatever I had to do, I had to pass every student.
I would not say there was much learning going on. If students were doing the program like they
were supposed to, it could work – but the majority of students weren’t coming from a family
where a parent would help them. (My notes from the entire interview are in my presentation.)

Again, numerous other former teachers confirm this account.
Horrific Educational Outcomes
In light of K12’s growth-at-any-cost approach, targeting of at-risk students, and low spending on
teachers, one would expect terrible educational outcomes – but they’re even worse than anyone
could imagine.
K12, of course, tries to hide this by producing a slick, colorful 132-page Academic Report
(which you can download here), which claims that for K12’s students in reading, “overall
achievement was 196% of the norm group gain” and in math, “overall achievement was 97% of
the norm group gain.”
These results are virtually meaningless for a number of reasons:
1) K12 measures its students’ academic growth using the Scantron test, which is not a stateadopted exam, but rather simply a diagnostic tool that is used by K12;
2) K12 has yet to allow independent external evaluators to both validate its data collection
efforts and more importantly evaluate its analysis of student achievement data, across all
K12 schools;
3) The Scantron test is given in the home, unsupervised and untimed, making it easy for
students to get help from a parent or the internet;
4) Only approximately 70% of eligible students take the test (likely to be the better
performing ones of course); and
5) K12’s purportedly strong Scantron results stand in stark contrast to K12 students’ dismal
results on state tests.
K12 now admits that the Scantron results can’t be relied on (but that hasn’t prevented the
company from peddling them to shareholders, politicians, regulators, etc.). K12 Executive
Chairman Nathaniel Davis said, “The Scantron tests are optional for K12 students, and about 30
percent decline to take them. That means the company has been comparing a self-selected group
of K12 students to the national norm, which isn’t appropriate.” The company, he said, needs to
find “a more honest assessment” of student progress.
Let’s look at other, independent measures of K12’s educational outcomes. There are various
ways to measure them, so let’s start with percentage of schools making AYP (Adequate Yearly

-23-
Progress) under the No Child Left Behind Act. As this chart shows, barely a quarter of K12’s
schools made AYP vs. more than half of all schools:
Percent of Schools That Met AYP, 2010-11

Source: Understanding and Improving Full-Time Virtual Schools: A Study of Student Characteristics, School Finance, and School Performance
in Schools Operated by K12 Inc., National Education Policy Center, 7/12

The same study also showed that 29 of 36 K12 schools (81%) that were assigned school
performance ratings by state education authorities failed to earn a rating that indicated
satisfactory progress status in 2010-11. Finally, it showed that K12 students trailed state averages
for the states in which K12 operates in both reading and math at every grade level (see charts in
my presentation).
K12 claims that its dismal academic results are because it serves more at-risk students, but this is
questionable for two reasons:
1) Though its proportion of at-risk students has indeed risen in recent years, it’s from a low
base so it’s not clear whether K12 is, in fact, serving a higher proportion of such students
relative to state averages; and
2) Even growth measures show dismal performance.
K12 argues (correctly) that “a more accurate method for measuring student performance is the
progress a student makes over the course of a school year, also known as a “growth measure”, so
let’s look at these results.
Tennessee, which is well known for having a robust system for measuring student growth,
tracked the growth of students in math, reading and science in the 2012-13 school year at all
1,300 elementary and middle schools in the state, including K12’s Tennessee Virtual Academy.
As you can see from this scatter plot of math results, TVA students at the beginning of the school
year are slightly below the state average (x axis), but their academic growth (y axis) is by far the
worst of any school in the state (the results for reading and science are nearly identical, as you
can see in my presentation):

-24-
Math

I think it’s safe to say that there’s almost no learning at all going on at TVA – and I’m not aware
that TVA is much different from K12’s other schools.
In Ohio, home to K12’s second largest school, Ohio Virtual Academy, which accounts for 11%
of K12’s revenues, the state recently reported that the six biggest cyber schools in the state all
got Fs on their state progress reports, with OHVA doing worst of all. The state counts a progress
score of -2 as a complete failure for a school – and OHVA’s score was -27!
Studies of growth metrics in Pennsylvania and Colorado show similar results, which I document
in my presentation.
Lastly, let’s look at graduation rates. As this chart shows, the on-time graduation rate for the K12
schools is 49.1%, compared with a rate of 79.4% for the states in which K12 operates schools:

-25-
Graduation Rate

K12’s Sky-High Student Dropout Rate
Another aspect of K12’s horrific educational outcomes is the sky-high student dropout rate,
which exceeds 50% annually at some schools. K12 has never released this data – it is nowhere to
be found in its 132-page Academic Report, and in a conference call on November 16, 2011, CEO
Ron Packard, while admitting that “[w]e track churn immensely,” said that “we haven’t chosen
to” disclose churn rates to investors. Instead, the company only acknowledges that “online
schools experience relatively high departure rates,” but says that it has “maintained consistent
retention rates over the past five years.” However, on that same conference call, Packer did
reveal that “about 60% of the kids who start with us in September are with us a year later” –
meaning a 40% churn rate!
This is consistent with other data that various researchers and journalists have been able to piece
together on a school-by-school basis. For example, Journalist Roddy Boyd of The Financial
Investigator, in an article entitled, K12: A Corporate Destiny Manifested, collected data for the
2010 school year for four of K12’s largest schools in Pennsylvania, Ohio, California and
Colorado and calculated that student churn ranged from 24-51%. Another study of online schools
in Colorado, of which K12’s is the largest, found that “half the online students wind up leaving
within a year.”
Is K12 Defrauding States Via Lax Enrollment Policies?
In most states, K12 must stop charging states for students if they stop coming to school (i.e.,
signing in) after a certain period of time, but there is significant anecdotal evidence that K12
doesn’t do this. Instead, it manipulates student counts and underreports student truancy and
withdrawals to increase its profits.
A study of 10 online schools in Colorado concluded that “millions of dollars are going to virtual
schools for students who no longer attend online classes.” And in Pennsylvania, an article in the
NY Times reports:
Several current and former staff members said that a lax policy had allowed students to remain on
the rolls even when they failed to log in for days. Officials of the Elizabeth Forward School
District in western Pennsylvania complained that Agora had billed the district for students who
were not attending.

-26-
One of them was a girl who had missed 55 days but was still on the school’s roster, according to
Margaret Boucher, assistant business manager at Elizabeth Forward

My presentation documents numerous similar reports.
K12 Appears to Be Violating State Laws and IRS Regulations Regarding Nonprofits
Of the 42 states (and DC) that permit charter schools, most will only grant charters to nonprofit
501(c)(3) entities, for which the IRS code states: “none of its earnings may inure to any private
shareholder and individual.” This presents a vexing problem for K12, but it gets around this by
signing long-term contracts with local nonprofit entities to provide management and other
services. While this type of arrangement doesn’t technically violate IRS regulations – nonprofits
contact with for-profit businesses all the time – it’s critical that the nonprofit be a truly
independent entity with an independent board of directors looking out solely for the nonprofit
mission of the organization.
This doesn’t appear to be happening with many of the nonprofit charter schools K12 contracts
with. Rather, the relationship is often so rife with conflicts and self-dealing that K12 effectively
controls and operates the schools – and siphons off all of the profits for itself. Consider that:






K12 employees sometimes serve on the board of the nonprofits and, worse yet, are
sometimes involved with their very creation. (One person told me that “Many of these
nonprofit boards are tiny, clueless, dysfunctional, and have K12 employees on them.”)
Contracts are often awarded to K12 without competitive bidding.
K12 usually directly or indirectly employs all key people, including the Treasurer – a
particularly blatant conflict of interest.
K12 often reviews its own billings and then fails to provide the boards with detailed
accounting for its expenditures.
The contract with K12 typically results in the nonprofit entity reporting minimal “profits”
or, often, a loss, which K12 then “forgives” (in its latest 10K, K12 notes that: “We take
responsibility for any operating deficits incurred at most of the Managed Public Schools
we serve.”).

Jeff Shaw of the Ohio Virtual Academy told me:
It was rather obvious to me as Head of School that K12 wasn’t always interested in reducing the
non-profits’ expenses if those savings would impact the bottom line for K12.
K12 assumed control of most of the OHVA budget and a majority of any excess funds was
soaked up by the end of the year, often to the point where the school would show a loss. In this
case, the agreement with K12 required them to issue a credit for management fees so OHVA
would show a small surplus for the fiscal year.
The volunteer governing boards assume a limited role in the school’s overall governance. The
boards tend to put their faith in K12 and count on it to do what is in the school’s best interest. A
Head of School walks a fine line in order to balance the best interests of both parties. In many
cases, the boards know only what K12 wants them to know. It’s like the fox guarding the
henhouse.

-27-
For an in-depth expose of how this works at a K12-affiliated school in Newark, see this article in
the Newark Star-Ledger last week: Newark charter school contract with K12 Inc. shows
influence of for-profit companies in public schools.
In summary, many of these nonprofits are a sham. For all intents and purposes, K12 controls,
operates, and profits from the supposedly nonprofit charter schools, in blatant violation of most
states’ laws and IRS regulations.
The IRS appears to be looking into this (click here). If it acts, the consequences could be dire for
K12.
K12’s Political and Lobbying Prowess
In light of so many red flags around K12, one might ask why states haven’t acted more quickly
and forcefully to rein in the company. There are many answers, but the most important is money
and politics. One person I spoke with told me that in many states, “the Republican legislatures
are bought and paid for” by K12. And the New York Times reported that: “An analysis by the
National Institute on Money in State Politics concluded that K12 and its employees contributed
nearly $500,000 to state political candidates across the country from 2004 to 2010.”
But this vastly understates what K12 is really spending. Consider Pennsylvania, home to K12’s
Agora Cyber Charter School and the nation’s largest online charter school sector, with 16
schools and 35,000 students. The Auditor General has released two scathing reports (click here
and here), calling for a 35% funding cut, because “PA spends about…$3,500 more per student to
educate a child in a cyber charter school compared to the national average, which adds up to
$315 million in annual savings.”
Yet the legislature hasn’t acted. Why? Perhaps it’s because, as the New York Times reported, in
Pennsylvania K12:
Has spent $681,000 on lobbying since 2007. The company also has friends in high places.
Charles Zogby, the state’s budget secretary, had been senior vice president of education and
policy for K12. In a statement, Mr. Zogby said he still owned a small number of K12 shares, but
did not make decisions specifically affecting online schools.

However, increased scrutiny of PA online schools could result from a federal indictment of the
founder and former CEO of Pennsylvania’s largest online charter school, who is alleged to have
stolen nearly $1 million in public money and improperly diverted a total of $8 million to avoid
federal income taxes.
In my presentation, I document similar tales of K12’s political influence in Tennessee, Ohio,
Massachusetts, Idaho and Maine.
K12 Is Encountering Regulatory Problems Across the Country
Despite its political influence, however, K12 is increasingly unable to hide its bad acts and
terrible results, so it’s beginning to encounter more and more regulatory problems across the
country. In Tennessee, for example, after the off-the-charts-bad results noted above, state

-28-
Education Commissioner Kevin Huffman declared the Tennessee Virtual Academy’s results
“unacceptable” and demanded “an immediate turnaround”, and the state turned down K12’s
application to open a second school in the state. And parents are figuring it out as well, as
enrollment has plunged by two thirds.
K12 is also facing scrutiny in Florida and Georgia, where investigations (click here and here)
revealed K12 employees covering up the illegal use of uncertified teachers, and class sizes of up
to 275 students. And in Colorado, K12 is scrambling to launch a new school after getting hit with
a double whammy: the board of the Colorado Virtual Academy has fired K12, and the district
that hosted the school has said it won’t renew COVA’s authorization. Local media (click here
and here) reported that “the school’s 22 percent graduation rate, high student turnover and
questions about COVA’s management company, K12 Inc., originally led district staff to
recommend denying the virtual school’s multiyear charter application.”
Lastly, K12 was denied online schools recently in New Jersey, North Carolina and Maine, which
means that K12 is not opening schools in any new states in the next year.
This is the growth story that justifies a 46x P/E on this stock???
Public Policy Recommendations
States are responding to the online charter school sector having run amok by adopting one or
more of the following changes, none of which are aimed specifically at K12, but all of which
have deleterious consequences for the company:
1) A full moratorium on any new cyber charters and/or cap limits on existing ones.
2) Cut funding to cyber charters to levels below that of bricks-and-mortar charters.
3) Improved accountability systems for all public schools (e.g., every school receives an AF grade).
4) “Default closure provisions” for all charter schools so, for example, if a school is in the
bottom 25% of all charters in the state, it automatically won’t get its charter renewed. Or,
if a school gets an F for two or three consecutive years, it’s automatically closed (though
there’s usually an appeals process). This applies to all charter schools, but would
disproportionately affect the low-performing online schools.
5) Improved practices for charter school authorizers, especially getting rid of rogue
authorizers.
6) Prevent charters from district/authorizer shopping.
I actually think the most elegant solution would be to let online charters pick and choose their
students, and then tie a meaningful portion of what they are paid to each student’s successful
completion of a course and demonstrating proficiency/growth. This would incent schools to help
students succeed and penalize them for enrolling those unlikely to succeed. (Note that states
would have to change their rules to allow this, as most have laws that prevent any charter from
being selective.)
The result would be online charters only serving a small fraction of the students they do now –
which would be a very good thing.

-29-
K12 Needs to Shrink
I don’t believe that K12 should go out of business. As I noted at the beginning of this article, the
company has a strong curriculum and online schools can be appropriate for certain students. But
K12 clearly needs to shrink substantially in order to properly serve students and states/taxpayers
– which is exactly what happened to many for-profit colleges in recent years.
Jeff Shaw of the Ohio Virtual Academy said it well when he told me:
I can’t see how K12 can get significant increases in student academic growth under their current
model. They need to say, “Let’s not focus on growth – let’s first get the academics right and then
look into growing in a controlled fashion so as not to sacrifice student achievement for growth. If
student really achieve, the company will grow for the right reasons.
Why would anyone in their right mind sacrifice student achievement for company growth? Those
of us at the school level sometimes felt as though Ron Packard was charging ahead full speed to
grow, grow, grow and not focusing on long-term sustainability and student achievement.
This kind of thinking hurts students. If you enroll students who clearly are not appropriate for the
virtual school setting, you’re doing that student a terrible disservice. You have sacrificed a real
person for your own economic gain. And I think that’s immoral and unethical.
K12’s managed schools are public schools. Every student has a right to attend, but as education
professionals we have a responsibility to see that students are enrolled in a school most
appropriate for their needs. In the end, it’s the parents and students who make the ultimate
decision regarding what school they attend. Our obligation as professionals is to present them
with the realities of virtual schooling and how this school choice option may or may not be the
best choice. The profit motive should not guide this process – but at K12 it appeared to.

There’s a good case in Colorado of how shrinking a school can lead to better outcomes for
students, as this article documents:
One of Colorado’s oldest online programs, Branson Online School, is also its highest-performing.
But to get there, the school had to cut back.
In 2005, the Branson school district on Colorado’s southeastern border with New Mexico ran the
state’s third-largest online school, enrolling more than 1,000 students. By 2010, the school had
dropped back to sixth in size, enrolling 427 students.
Branson assistant superintendent Judith Stokes, who oversees the online school, said the growth
and lagging scores – combined with a critical 2006 state audit of online programs – prompted the
ranching community’s school board to slow down.
“We had grown very, very rapidly at one time, before the audit, and at that point, we pulled
back,” she said.
Stokes said growth slowed when the school focused on ensuring families understood the online
program before enrolling because, “If you’re looking for easy, it’s not us.”

-30-
In spring 2011, Branson online students beat the statewide average in proficiency in reading and
were six percentage points short in math.

Conclusions and Catalysts
K12 is pursuing a growth-at-any-cost strategy that is harming countless students, likely violating
numerous state and federal laws and regulations, and wasting hundreds of millions of dollars of
taxpayer money every year.
What the company is doing is becoming increasingly well-known so states – and possibly the
IRS – are waking up and thus the company faces increased regulatory risks. The likely result is
that K12 will not only miss its growth projections (analysts project that K12’s revenues and
profits will grow 16% and 32%, respectively, in the next year), but will actually have to shrink
substantially in order to properly serve students (and states/taxpayers).
A possible short-term catalyst is that the company could disappoint when it issues FY 2014
guidance in mid-October and/or when it reports Q1 ‘14 earnings in early November because
growth has been slowing, preliminary enrollment data I’ve seen for a few schools are weak, and
analysts seem to be factoring in rising margins and continued growth in revenue per student, both
of which I think are unlikely.
Trading at 46x trailing earnings and 35x next year’s estimates, K12’s stock is priced for
perfection, yet its future is likely to be far from perfect.
Addendum
Since I made my presentation public last week, I am even more certain that my analysis of K12
is correct thanks to comments like these from people I know:





“I met with Ron Packard years ago and could tell his motivations had little to do with kids,
everything to do with manipulating state regulation to protect his interests. I started digging into
the results, the business model, the organization, and discovered much of what you lay out in
detail in your presentation. As I said, they are terrible and epitomize everything that we should be
working against in the ed-reform movement.”
“I know the company very well and your presentation rings true. They have a well-deserved
terrible reputation.”
“You’re totally right about K12 and, on top of it, they lie all the time. It’s naïve to trust anything
they say. So I’m not sure if their schools can be fixed, at least under the company’s current
leadership. There’s no such thing as a successful online school in the entire country. To be sure, it
works well for some students, but I’d guess only 15% of the ones cyber charters are currently
serving.”

Finally, lest you think I’m just talking my book for a quick trade, it won’t take you long to verify
that’s not how I operate. Agree or disagree with me, my views are based on the company’s
fundamentals and are genuinely held, irrespective of my funds’ position in the stock. Also note
that I am not short K12’s stock because I oppose charter schools, online education, or for-profit
schools. To the contrary, as you can see from my bio, I’m a champion of new models of
education, whether for profit or nonprofit, as long as they work for kids.

-31-
Appendix C
Why I’m Not Covering My K12 Short

Whitney Tilson
2,017 Followers
October 10, 2013
http://seekingalpha.com/article/1738982-why-im-not-covering-my-k12-short
“My momma always said, ‘Life was like a box of chocolates. You never know what you’re
gonna get.’” – Forrest Gump
That line came to mind as I was thinking about the wild turn of events the last few days vis-à-vis
K12. The stock fell 38% yesterday and has been cut in half since I went public with my concerns
about the company (and my funds’ short position) three weeks ago at the Value Investing
Congress (I also wrote about it here on Seeking Alpha; the latest version of my K12 presentation
is posted here).
But let me start the story three days ago: on Monday night, I went to a dinner hosted Mayor
Bloomberg at Gracie Mansion for folks attending the Education Nation conference that was
going on earlier this week in NYC. One of my friends came up to me and said, “You know Ron
Packard [the founder and CEO of K12] is here. Let me introduce you.” In light of what I’ve said
and written very publicly about him and his company in the last three weeks, I feared an ugly
confrontation so I demurred.
But not long afterward, while I was talking to some other friends, she came over with Ron and
introduced us. We shook hands and he said he’d read my presentation and thought I got some
things wrong. I said I’d love to hear what and we started talking. And talking and talking...
Somebody gave a speech – and we kept talking. Then some performers sang – and we moved to
the side of the tent and kept talking. The party ended, everyone left, the crew folded up all the
tables, and the clock struck midnight (3 ½ hours later) – and we kept talking. We figured they
were going to kick us out, so we left and walked a few blocks up to the corner of 88th and Lex –
and kept talking. Finally, at about 12:45am, my worried wife called me and said, “Where are
you?!” I said, “You’re never going to believe who I’m standing here talking to…” So after 4 ½
hours, we both hopped into cabs and went our respective ways.
I have been shorting stocks for over a decade and have gone public with my short thesis on a
handful of occasions and, as a result, have been sued, deposed, subpoenaed and investigated
(there are good reasons why very few short sellers ever speak publicly) – but I can’t recall the
CEO of a company I’m short being willing to engage in a lengthy, frank conversation like Ron
-32-
and I had on Monday. (My only similar experience was when Reed Hastings published a
response in Seeking Alpha to my article in December 2010 in which I detailed why I was short
Netflix at that time; after the stock collapsed, I went long it and still hold it – it’s been one of my
best investments ever.)
I want to respect the privacy of our conversation, so I’m not going to detail what Ron said, but
do want share some of my thoughts.
First, I liked Ron. I found him very personable, I think he honestly believed everything he said to
me, he didn’t get angry or defensive when I pushed him on some pretty tough stuff I’ve heard
and written about K12, and we have a lot in common: early in our careers, he was at McKinsey
and I was at BCG; we’re both interested in stock picking (long and short); and of course we’re
both passionate about improving and reforming education and the role technology can play. I
think Ron is an incredible visionary and entrepreneur, and he’s built an important and innovative
company. I now see that there’s a lot of good in K12.
Before I met Ron, I thought he and the other leaders of K12 were deliberately targeting and
enrolling kids they knew were certain to fail in order to maximize their revenue, run their stock
price up, and make a few more millions for themselves. I no longer believe this about Ron. I
think he wants to do right by kids and that, if given the option of taking a student he knew
wouldn’t be successful at a K12 school, but would be highly profitable for the company, he
wouldn’t want that student. He believes – and I think he’s right – that there’s lots of room for the
company to grow for a long time serving only students who will benefit from a K12 school.
So I don’t think there was ever a meeting at K12 in which the company decided to pursue
maximum growth at any cost, even if it resulted in a lot of kids enrolling who were highly likely
to fail and suffer a major educational setback. Yet even if it wasn’t intended, that’s exactly what
I’m convinced is happening right now for a meaningful percentage of K12’s students (I’ve heard
estimates as high as 85%, based on the very low number of K12 students who are demonstrating
proficiency).
I think that a number years ago (coinciding, not coincidentally, with the company going public in
late 2007), K12, in balancing its desire for growth vs. doing right by kids, let that balance get
way out of whack.
I’ve seen it happen at countless companies – the board and management team get on a treadmill
of scrambling to meet analyst expectations every quarter, they start to think (albeit perhaps
subconsciously) that it’s their job to keep the stock price up, and they start doing all sorts of
unnatural, short-term-oriented, unethical and, in the worst case, illegal things to keep the game
going.
Fueling this is the genuine passion Ron and others at K12 have for online education. They have a
missionary’s zeal to make it available to the world, which is great, but I also think that blinds
them to the reality (as I see it) that a full-time online school is a terrible educational option for
the majority of students, especially at-risk ones. Thus, I think it’s incumbent upon K12 to do its
absolute level best to enroll only those students for whom one of its schools is the best option.

-33-
Ron said that K12 is already taking steps to ensure this (and perhaps the tepid FY 2014 guidance
the company issued last night in part reflects this), but I’m 100% certain that there’s a lot more
that K12 can and should be doing.
So with the stock down so much, am I covering my short? In a word: No. In light of the new
guidance (which, while below expectations, still showed enrollment growth of 5.7% year over
year), I don’t think K12 has come to grips with the reality that it doesn’t just need to slow its
growth, but must actually shrink its enrollment – and not by a little, but by a lot – to weed out the
students who are not appropriate for a full-time online school and thus are not engaging or
succeeding. Instead, my read of K12’s recent press release is that it’s doing what most
companies in this situation do – deny reality, rip the Band Aid off slowly, and prolong the pain.
What K12 really needs to do is come clean with all of its stakeholders (students, parents,
investors, employees, regulators, legislators, etc.) and say something like:
While we didn’t intend to do so, we grew too fast in recent years, resulting in many students
enrolling in K12 schools who shouldn’t have. That’s not only obviously bad for those kids, but is
also bad for us in the long run. Consequently, going forward, we are going to focus 100% on
improving its academic outcomes, both by doing everything we can to ensure that only kids who
are well positioned to succeed in a full-time online school enroll, and also by investing heavily to
better serve our increasing number of at-risk students.

If K12 did this, for sure its revenues and profits would fall in the next year or two and the stock
would get hit (again), but I’m convinced that the company would be far more valuable in the
long run. Look at what’s happened to Netflix’s stock since it stopped trying to be profitable, and
look at Amazon since its inception – it’s basically never been profitable! Investors don’t care
about near-term profits as long as they’re convinced that the company is a growing market leader
that, once it matures, will be highly profitable down the road (sometimes even very far down the
road).
Once K12 takes these steps, I will cover my short – and might even go long the stock!

-34-
The T2 Accredited Fund, LP (dba the Kase Fund) (the “Fund”) commenced operations on January 1,
1999. The Fund’s investment objective is to achieve long-term after-tax capital appreciation
commensurate with moderate risk, primarily by investing with a long-term perspective in a concentrated
portfolio of U.S. stocks. In carrying out the Partnership’s investment objective, the Investment Manager,
T2 Partners Management, LP (dba Kase Capital Management), seeks to buy stocks at a steep discount to
intrinsic value such that there is low risk of capital loss and significant upside potential. The primary
focus of the Investment Manager is on the long-term fortunes of the companies in the Partnership’s
portfolio or which are otherwise followed by the Investment Manager, relative to the prices of their
stocks.
There is no assurance that any securities discussed herein will remain in Fund’s portfolio at the time you
receive this report or that securities sold have not been repurchased. The securities discussed may not
represent the Fund’s entire portfolio and in the aggregate may represent only a small percentage of an
account’s portfolio holdings. The material presented is compiled from sources believed to be reliable and
honest, but accuracy cannot be guaranteed.
It should not be assumed that any of the securities transactions, holdings or sectors discussed were or will
prove to be profitable, or that the investment recommendations or decisions we make in the future will be
profitable or will equal the investment performance of the securities discussed herein. All
recommendations within the preceding 12 months or applicable period are available upon request. Past
results are no guarantee of future results and no representation is made that an investor will or is likely to
achieve results similar to those shown. All investments involve risk including the loss of principal.
Performance results shown are for the Kase Fund and are presented net of all fees, including management
and incentive fees, brokerage commissions, administrative expenses, and other operating expenses of the
Fund. Net performance includes the reinvestment of all dividends, interest, and capital gains.
The fee schedule for the Investment Manager includes a 1.5% annual management fee and a 20%
incentive fee allocation. For periods prior to June 1, 2004 and after July 1, 2012, the Investment
Manager’s fee schedule included a 1% annual management fee and a 20% incentive fee allocation. In
practice, the incentive fee is “earned” on an annual, not monthly, basis or upon a withdrawal from the
Fund. Because some investors may have different fee arrangements and depending on the timing of a
specific investment, net performance for an individual investor may vary from the net performance as
stated herein.
The return of the S&P 500 and other indices are included in the presentation. The volatility of these
indices may be materially different from the volatility in the Fund. In addition, the Fund’s holdings differ
significantly from the securities that comprise the indices. The indices have not been selected to represent
appropriate benchmarks to compare an investor’s performance, but rather are disclosed to allow for
comparison of the investor’s performance to that of certain well-known and widely recognized indices.
You cannot invest directly in these indices.
This document is confidential and may not be distributed without the consent of the Investment Manager
and does not constitute an offer to sell or the solicitation of an offer to purchase any security or
investment product. Any such offer or solicitation may only be made by means of delivery of an approved
confidential offering memorandum.

-35-

More Related Content

What's hot

Michael Lathigee Economic Overview Newsletter
Michael Lathigee Economic Overview NewsletterMichael Lathigee Economic Overview Newsletter
Michael Lathigee Economic Overview Newslettermichaellathigee
 
June 2018 Investment Commentary & Performance
June 2018 Investment Commentary & PerformanceJune 2018 Investment Commentary & Performance
June 2018 Investment Commentary & PerformanceAnthony A. Lombardi, CFA
 
Real Estate Capital Markets Are Alive, If Not Quite Well
Real Estate Capital Markets Are Alive, If Not Quite WellReal Estate Capital Markets Are Alive, If Not Quite Well
Real Estate Capital Markets Are Alive, If Not Quite WellDan Hutchins
 
Michael Durante Western Reserve Spring 2010
Michael Durante Western Reserve Spring 2010Michael Durante Western Reserve Spring 2010
Michael Durante Western Reserve Spring 2010Michael Durante
 
Winter insights q4 2013
Winter insights q4 2013Winter insights q4 2013
Winter insights q4 2013telemuscapital
 
Hyre Weekly Commentary
Hyre Weekly CommentaryHyre Weekly Commentary
Hyre Weekly Commentaryhyrejam
 
Fasanara Capital | Investment Outlook | February 1st 2013
Fasanara Capital | Investment Outlook | February 1st 2013Fasanara Capital | Investment Outlook | February 1st 2013
Fasanara Capital | Investment Outlook | February 1st 2013Fasanara Capital ltd
 
Brent woyat q2 2014 pimg commentary jul2014
Brent woyat q2 2014 pimg commentary jul2014Brent woyat q2 2014 pimg commentary jul2014
Brent woyat q2 2014 pimg commentary jul2014bwoyat
 
The wall street transcript james interview reprinted fr 17 july 2017
The wall street transcript james interview reprinted fr 17 july 2017The wall street transcript james interview reprinted fr 17 july 2017
The wall street transcript james interview reprinted fr 17 july 2017R. James Morton
 
Trading research part2
Trading  research part2Trading  research part2
Trading research part2ianhorner3
 
18-06-18_Money_Overview.pdf
18-06-18_Money_Overview.pdf18-06-18_Money_Overview.pdf
18-06-18_Money_Overview.pdflirabini1977
 
2 william blair global market outlook - december 2013
2 william blair global market outlook - december 20132 william blair global market outlook - december 2013
2 william blair global market outlook - december 2013123jumpad
 
The financial Markets’ Year in Slides and Looking Ahead to 2018
The financial Markets’ Year in Slides and Looking Ahead to 2018The financial Markets’ Year in Slides and Looking Ahead to 2018
The financial Markets’ Year in Slides and Looking Ahead to 2018Matt Topley
 
The wildebeests are feeling frisky 2 10-12
The wildebeests are feeling frisky 2 10-12The wildebeests are feeling frisky 2 10-12
The wildebeests are feeling frisky 2 10-12Jeb Terry Sr
 
Linear note 4 securities
Linear note 4  securitiesLinear note 4  securities
Linear note 4 securitiesDr Marcus Bent
 
(311) corrections are not predictable
(311)   corrections are not predictable(311)   corrections are not predictable
(311) corrections are not predictabletheretirementengineer
 
Government Shutdown Effect on Investors
Government Shutdown Effect on InvestorsGovernment Shutdown Effect on Investors
Government Shutdown Effect on InvestorsDolf Dunn
 

What's hot (18)

Michael Lathigee Economic Overview Newsletter
Michael Lathigee Economic Overview NewsletterMichael Lathigee Economic Overview Newsletter
Michael Lathigee Economic Overview Newsletter
 
June 2018 Investment Commentary & Performance
June 2018 Investment Commentary & PerformanceJune 2018 Investment Commentary & Performance
June 2018 Investment Commentary & Performance
 
Real Estate Capital Markets Are Alive, If Not Quite Well
Real Estate Capital Markets Are Alive, If Not Quite WellReal Estate Capital Markets Are Alive, If Not Quite Well
Real Estate Capital Markets Are Alive, If Not Quite Well
 
Michael Durante Western Reserve Spring 2010
Michael Durante Western Reserve Spring 2010Michael Durante Western Reserve Spring 2010
Michael Durante Western Reserve Spring 2010
 
Technical & Fundamental Analysis of USD/BDT
Technical & Fundamental Analysis of USD/BDTTechnical & Fundamental Analysis of USD/BDT
Technical & Fundamental Analysis of USD/BDT
 
Winter insights q4 2013
Winter insights q4 2013Winter insights q4 2013
Winter insights q4 2013
 
Hyre Weekly Commentary
Hyre Weekly CommentaryHyre Weekly Commentary
Hyre Weekly Commentary
 
Fasanara Capital | Investment Outlook | February 1st 2013
Fasanara Capital | Investment Outlook | February 1st 2013Fasanara Capital | Investment Outlook | February 1st 2013
Fasanara Capital | Investment Outlook | February 1st 2013
 
Brent woyat q2 2014 pimg commentary jul2014
Brent woyat q2 2014 pimg commentary jul2014Brent woyat q2 2014 pimg commentary jul2014
Brent woyat q2 2014 pimg commentary jul2014
 
The wall street transcript james interview reprinted fr 17 july 2017
The wall street transcript james interview reprinted fr 17 july 2017The wall street transcript james interview reprinted fr 17 july 2017
The wall street transcript james interview reprinted fr 17 july 2017
 
Trading research part2
Trading  research part2Trading  research part2
Trading research part2
 
18-06-18_Money_Overview.pdf
18-06-18_Money_Overview.pdf18-06-18_Money_Overview.pdf
18-06-18_Money_Overview.pdf
 
2 william blair global market outlook - december 2013
2 william blair global market outlook - december 20132 william blair global market outlook - december 2013
2 william blair global market outlook - december 2013
 
The financial Markets’ Year in Slides and Looking Ahead to 2018
The financial Markets’ Year in Slides and Looking Ahead to 2018The financial Markets’ Year in Slides and Looking Ahead to 2018
The financial Markets’ Year in Slides and Looking Ahead to 2018
 
The wildebeests are feeling frisky 2 10-12
The wildebeests are feeling frisky 2 10-12The wildebeests are feeling frisky 2 10-12
The wildebeests are feeling frisky 2 10-12
 
Linear note 4 securities
Linear note 4  securitiesLinear note 4  securities
Linear note 4 securities
 
(311) corrections are not predictable
(311)   corrections are not predictable(311)   corrections are not predictable
(311) corrections are not predictable
 
Government Shutdown Effect on Investors
Government Shutdown Effect on InvestorsGovernment Shutdown Effect on Investors
Government Shutdown Effect on Investors
 

Viewers also liked

Skagen global noviembre 14
Skagen global noviembre 14Skagen global noviembre 14
Skagen global noviembre 14Frank Ragol
 
Charles voegele half year report_2011
Charles voegele half year report_2011Charles voegele half year report_2011
Charles voegele half year report_2011Frank Ragol
 
Greenlight full 2011
Greenlight full 2011Greenlight full 2011
Greenlight full 2011Frank Ragol
 
T2 annual letter 2011
T2 annual letter 2011T2 annual letter 2011
T2 annual letter 2011Frank Ragol
 
European conviction octubre 2011
European conviction octubre 2011European conviction octubre 2011
European conviction octubre 2011Frank Ragol
 

Viewers also liked (6)

Hoisington post
Hoisington postHoisington post
Hoisington post
 
Skagen global noviembre 14
Skagen global noviembre 14Skagen global noviembre 14
Skagen global noviembre 14
 
Charles voegele half year report_2011
Charles voegele half year report_2011Charles voegele half year report_2011
Charles voegele half year report_2011
 
Greenlight full 2011
Greenlight full 2011Greenlight full 2011
Greenlight full 2011
 
T2 annual letter 2011
T2 annual letter 2011T2 annual letter 2011
T2 annual letter 2011
 
European conviction octubre 2011
European conviction octubre 2011European conviction octubre 2011
European conviction octubre 2011
 

Similar to Kkase capital quarterlyletter q313-1

September 2010 Economic Outlook
September 2010 Economic OutlookSeptember 2010 Economic Outlook
September 2010 Economic Outlooklvrealestateclub
 
OFIP Q1 2010 - The Great Sideways Market
OFIP Q1 2010 - The Great Sideways MarketOFIP Q1 2010 - The Great Sideways Market
OFIP Q1 2010 - The Great Sideways Marketbwoyat
 
Cardinal Quarterly July 2012
Cardinal Quarterly July 2012Cardinal Quarterly July 2012
Cardinal Quarterly July 2012KimGibson
 
September 2019 Investment Commentary & Performance
September 2019 Investment Commentary & PerformanceSeptember 2019 Investment Commentary & Performance
September 2019 Investment Commentary & PerformanceAnthony A. Lombardi, CFA
 
ICT Corporates: Where To From Here
ICT Corporates: Where To From HereICT Corporates: Where To From Here
ICT Corporates: Where To From HereElton050505
 
Stock Market Greed N Fear
Stock Market   Greed N Fear Stock Market   Greed N Fear
Stock Market Greed N Fear choudhari20
 
Mr. Wood Block 1 slideshow
Mr. Wood Block 1 slideshowMr. Wood Block 1 slideshow
Mr. Wood Block 1 slideshowdoritrenter
 
Michael Western Reserve spring 2010 review
Michael Western Reserve  spring 2010 reviewMichael Western Reserve  spring 2010 review
Michael Western Reserve spring 2010 reviewMichael Durante
 
Michael Durante Western Reserve spring 2010 review
Michael Durante Western Reserve  spring 2010 reviewMichael Durante Western Reserve  spring 2010 review
Michael Durante Western Reserve spring 2010 reviewMichael Durante
 
Tamohara investment newsletter September 2015
Tamohara investment newsletter  September 2015Tamohara investment newsletter  September 2015
Tamohara investment newsletter September 2015tamohara
 
Quarterly report for our investors - Third Quarter 2018
Quarterly report for our investors - Third Quarter 2018Quarterly report for our investors - Third Quarter 2018
Quarterly report for our investors - Third Quarter 2018BESTINVER
 
Fasanara Capital | Investment Outlook | December 16th 2013
Fasanara Capital | Investment Outlook | December 16th 2013Fasanara Capital | Investment Outlook | December 16th 2013
Fasanara Capital | Investment Outlook | December 16th 2013Fasanara Capital ltd
 
Short Selling: Cleaning Up After Elephants
Short Selling: Cleaning Up After ElephantsShort Selling: Cleaning Up After Elephants
Short Selling: Cleaning Up After Elephantsasianextractor
 
Wallet4 wealth newsletter-aug21
Wallet4 wealth newsletter-aug21Wallet4 wealth newsletter-aug21
Wallet4 wealth newsletter-aug21WALLET4WEALTH
 
Inv rajat finserve-newsletter-aug21-1
Inv rajat finserve-newsletter-aug21-1Inv rajat finserve-newsletter-aug21-1
Inv rajat finserve-newsletter-aug21-1RAJATGHOSH31
 

Similar to Kkase capital quarterlyletter q313-1 (19)

September 2010 Economic Outlook
September 2010 Economic OutlookSeptember 2010 Economic Outlook
September 2010 Economic Outlook
 
March 2020 Investment Commentary
March 2020 Investment CommentaryMarch 2020 Investment Commentary
March 2020 Investment Commentary
 
OFIP Q1 2010 - The Great Sideways Market
OFIP Q1 2010 - The Great Sideways MarketOFIP Q1 2010 - The Great Sideways Market
OFIP Q1 2010 - The Great Sideways Market
 
Cardinal Quarterly July 2012
Cardinal Quarterly July 2012Cardinal Quarterly July 2012
Cardinal Quarterly July 2012
 
September 2019 Investment Commentary & Performance
September 2019 Investment Commentary & PerformanceSeptember 2019 Investment Commentary & Performance
September 2019 Investment Commentary & Performance
 
ICT Corporates: Where To From Here
ICT Corporates: Where To From HereICT Corporates: Where To From Here
ICT Corporates: Where To From Here
 
Stock Market Greed N Fear
Stock Market   Greed N Fear Stock Market   Greed N Fear
Stock Market Greed N Fear
 
Q2 2021 Financial Synergies Newsletter
Q2 2021 Financial Synergies NewsletterQ2 2021 Financial Synergies Newsletter
Q2 2021 Financial Synergies Newsletter
 
CIO Newsletter - Second Edition
CIO Newsletter - Second EditionCIO Newsletter - Second Edition
CIO Newsletter - Second Edition
 
Financial Synergies | Q3 2018 Newsletter
Financial Synergies | Q3 2018 NewsletterFinancial Synergies | Q3 2018 Newsletter
Financial Synergies | Q3 2018 Newsletter
 
Mr. Wood Block 1 slideshow
Mr. Wood Block 1 slideshowMr. Wood Block 1 slideshow
Mr. Wood Block 1 slideshow
 
Michael Western Reserve spring 2010 review
Michael Western Reserve  spring 2010 reviewMichael Western Reserve  spring 2010 review
Michael Western Reserve spring 2010 review
 
Michael Durante Western Reserve spring 2010 review
Michael Durante Western Reserve  spring 2010 reviewMichael Durante Western Reserve  spring 2010 review
Michael Durante Western Reserve spring 2010 review
 
Tamohara investment newsletter September 2015
Tamohara investment newsletter  September 2015Tamohara investment newsletter  September 2015
Tamohara investment newsletter September 2015
 
Quarterly report for our investors - Third Quarter 2018
Quarterly report for our investors - Third Quarter 2018Quarterly report for our investors - Third Quarter 2018
Quarterly report for our investors - Third Quarter 2018
 
Fasanara Capital | Investment Outlook | December 16th 2013
Fasanara Capital | Investment Outlook | December 16th 2013Fasanara Capital | Investment Outlook | December 16th 2013
Fasanara Capital | Investment Outlook | December 16th 2013
 
Short Selling: Cleaning Up After Elephants
Short Selling: Cleaning Up After ElephantsShort Selling: Cleaning Up After Elephants
Short Selling: Cleaning Up After Elephants
 
Wallet4 wealth newsletter-aug21
Wallet4 wealth newsletter-aug21Wallet4 wealth newsletter-aug21
Wallet4 wealth newsletter-aug21
 
Inv rajat finserve-newsletter-aug21-1
Inv rajat finserve-newsletter-aug21-1Inv rajat finserve-newsletter-aug21-1
Inv rajat finserve-newsletter-aug21-1
 

More from Frank Ragol

Q1 2016-credit third avenue
Q1 2016-credit third avenueQ1 2016-credit third avenue
Q1 2016-credit third avenueFrank Ragol
 
Gdc FI-mayo-2015
Gdc FI-mayo-2015Gdc FI-mayo-2015
Gdc FI-mayo-2015Frank Ragol
 
30638 tl bill gross investment outlook may 2015-exp 5.30.16_3
30638 tl bill gross investment outlook may 2015-exp 5.30.16_330638 tl bill gross investment outlook may 2015-exp 5.30.16_3
30638 tl bill gross investment outlook may 2015-exp 5.30.16_3Frank Ragol
 
Resultados consolidados banca en españa a 30 septiembre
Resultados consolidados banca en españa a 30 septiembreResultados consolidados banca en españa a 30 septiembre
Resultados consolidados banca en españa a 30 septiembreFrank Ragol
 
Bass cognitive dissonance
Bass cognitive dissonanceBass cognitive dissonance
Bass cognitive dissonanceFrank Ragol
 
Greif inc (spruce point capital)
Greif inc (spruce point capital)Greif inc (spruce point capital)
Greif inc (spruce point capital)Frank Ragol
 
Third point-q4-2014-investor-letter-tpoi
Third point-q4-2014-investor-letter-tpoiThird point-q4-2014-investor-letter-tpoi
Third point-q4-2014-investor-letter-tpoiFrank Ragol
 
Lessons of oil by howard marks
Lessons of oil by howard marksLessons of oil by howard marks
Lessons of oil by howard marksFrank Ragol
 
Odey absolute return octubre 2014
Odey absolute return octubre 2014Odey absolute return octubre 2014
Odey absolute return octubre 2014Frank Ragol
 
Odey absolute return octubre 2014
Odey absolute return octubre 2014Odey absolute return octubre 2014
Odey absolute return octubre 2014Frank Ragol
 
Gmo qtly letter_3q14_full
Gmo qtly letter_3q14_fullGmo qtly letter_3q14_full
Gmo qtly letter_3q14_fullFrank Ragol
 
Estadistica anual definitiva 2013
Estadistica anual definitiva 2013Estadistica anual definitiva 2013
Estadistica anual definitiva 2013Frank Ragol
 
Enagas resultados 3 t 2014 presentacion
Enagas resultados 3 t 2014 presentacionEnagas resultados 3 t 2014 presentacion
Enagas resultados 3 t 2014 presentacionFrank Ragol
 

More from Frank Ragol (20)

Tulip a eur_en
Tulip a eur_enTulip a eur_en
Tulip a eur_en
 
Oei feb-16
Oei feb-16Oei feb-16
Oei feb-16
 
Q1 2016-credit third avenue
Q1 2016-credit third avenueQ1 2016-credit third avenue
Q1 2016-credit third avenue
 
Oei dec-15
Oei dec-15Oei dec-15
Oei dec-15
 
Oei dec-15
Oei dec-15Oei dec-15
Oei dec-15
 
Swan aug-15
Swan aug-15Swan aug-15
Swan aug-15
 
Gdc FI-mayo-2015
Gdc FI-mayo-2015Gdc FI-mayo-2015
Gdc FI-mayo-2015
 
Oei apr-15
Oei apr-15Oei apr-15
Oei apr-15
 
30638 tl bill gross investment outlook may 2015-exp 5.30.16_3
30638 tl bill gross investment outlook may 2015-exp 5.30.16_330638 tl bill gross investment outlook may 2015-exp 5.30.16_3
30638 tl bill gross investment outlook may 2015-exp 5.30.16_3
 
Resultados consolidados banca en españa a 30 septiembre
Resultados consolidados banca en españa a 30 septiembreResultados consolidados banca en españa a 30 septiembre
Resultados consolidados banca en españa a 30 septiembre
 
Bass cognitive dissonance
Bass cognitive dissonanceBass cognitive dissonance
Bass cognitive dissonance
 
Greif inc (spruce point capital)
Greif inc (spruce point capital)Greif inc (spruce point capital)
Greif inc (spruce point capital)
 
Third point-q4-2014-investor-letter-tpoi
Third point-q4-2014-investor-letter-tpoiThird point-q4-2014-investor-letter-tpoi
Third point-q4-2014-investor-letter-tpoi
 
Oei 2014-12
Oei 2014-12Oei 2014-12
Oei 2014-12
 
Lessons of oil by howard marks
Lessons of oil by howard marksLessons of oil by howard marks
Lessons of oil by howard marks
 
Odey absolute return octubre 2014
Odey absolute return octubre 2014Odey absolute return octubre 2014
Odey absolute return octubre 2014
 
Odey absolute return octubre 2014
Odey absolute return octubre 2014Odey absolute return octubre 2014
Odey absolute return octubre 2014
 
Gmo qtly letter_3q14_full
Gmo qtly letter_3q14_fullGmo qtly letter_3q14_full
Gmo qtly letter_3q14_full
 
Estadistica anual definitiva 2013
Estadistica anual definitiva 2013Estadistica anual definitiva 2013
Estadistica anual definitiva 2013
 
Enagas resultados 3 t 2014 presentacion
Enagas resultados 3 t 2014 presentacionEnagas resultados 3 t 2014 presentacion
Enagas resultados 3 t 2014 presentacion
 

Recently uploaded

Call Girls In Sikandarpur Gurgaon ❤️8860477959_Russian 100% Genuine Escorts I...
Call Girls In Sikandarpur Gurgaon ❤️8860477959_Russian 100% Genuine Escorts I...Call Girls In Sikandarpur Gurgaon ❤️8860477959_Russian 100% Genuine Escorts I...
Call Girls In Sikandarpur Gurgaon ❤️8860477959_Russian 100% Genuine Escorts I...lizamodels9
 
Cash Payment 9602870969 Escort Service in Udaipur Call Girls
Cash Payment 9602870969 Escort Service in Udaipur Call GirlsCash Payment 9602870969 Escort Service in Udaipur Call Girls
Cash Payment 9602870969 Escort Service in Udaipur Call GirlsApsara Of India
 
Lucknow 💋 Escorts in Lucknow - 450+ Call Girl Cash Payment 8923113531 Neha Th...
Lucknow 💋 Escorts in Lucknow - 450+ Call Girl Cash Payment 8923113531 Neha Th...Lucknow 💋 Escorts in Lucknow - 450+ Call Girl Cash Payment 8923113531 Neha Th...
Lucknow 💋 Escorts in Lucknow - 450+ Call Girl Cash Payment 8923113531 Neha Th...anilsa9823
 
BEST Call Girls In Old Faridabad ✨ 9773824855 ✨ Escorts Service In Delhi Ncr,
BEST Call Girls In Old Faridabad ✨ 9773824855 ✨ Escorts Service In Delhi Ncr,BEST Call Girls In Old Faridabad ✨ 9773824855 ✨ Escorts Service In Delhi Ncr,
BEST Call Girls In Old Faridabad ✨ 9773824855 ✨ Escorts Service In Delhi Ncr,noida100girls
 
RE Capital's Visionary Leadership under Newman Leech
RE Capital's Visionary Leadership under Newman LeechRE Capital's Visionary Leadership under Newman Leech
RE Capital's Visionary Leadership under Newman LeechNewman George Leech
 
Eni 2024 1Q Results - 24.04.24 business.
Eni 2024 1Q Results - 24.04.24 business.Eni 2024 1Q Results - 24.04.24 business.
Eni 2024 1Q Results - 24.04.24 business.Eni
 
Lowrate Call Girls In Laxmi Nagar Delhi ❤️8860477959 Escorts 100% Genuine Ser...
Lowrate Call Girls In Laxmi Nagar Delhi ❤️8860477959 Escorts 100% Genuine Ser...Lowrate Call Girls In Laxmi Nagar Delhi ❤️8860477959 Escorts 100% Genuine Ser...
Lowrate Call Girls In Laxmi Nagar Delhi ❤️8860477959 Escorts 100% Genuine Ser...lizamodels9
 
2024 Numerator Consumer Study of Cannabis Usage
2024 Numerator Consumer Study of Cannabis Usage2024 Numerator Consumer Study of Cannabis Usage
2024 Numerator Consumer Study of Cannabis UsageNeil Kimberley
 
Vip Female Escorts Noida 9711199171 Greater Noida Escorts Service
Vip Female Escorts Noida 9711199171 Greater Noida Escorts ServiceVip Female Escorts Noida 9711199171 Greater Noida Escorts Service
Vip Female Escorts Noida 9711199171 Greater Noida Escorts Serviceankitnayak356677
 
VIP Kolkata Call Girl Howrah 👉 8250192130 Available With Room
VIP Kolkata Call Girl Howrah 👉 8250192130  Available With RoomVIP Kolkata Call Girl Howrah 👉 8250192130  Available With Room
VIP Kolkata Call Girl Howrah 👉 8250192130 Available With Roomdivyansh0kumar0
 
Monte Carlo simulation : Simulation using MCSM
Monte Carlo simulation : Simulation using MCSMMonte Carlo simulation : Simulation using MCSM
Monte Carlo simulation : Simulation using MCSMRavindra Nath Shukla
 
Call Girls In Sikandarpur Gurgaon ❤️8860477959_Russian 100% Genuine Escorts I...
Call Girls In Sikandarpur Gurgaon ❤️8860477959_Russian 100% Genuine Escorts I...Call Girls In Sikandarpur Gurgaon ❤️8860477959_Russian 100% Genuine Escorts I...
Call Girls In Sikandarpur Gurgaon ❤️8860477959_Russian 100% Genuine Escorts I...lizamodels9
 
Regression analysis: Simple Linear Regression Multiple Linear Regression
Regression analysis:  Simple Linear Regression Multiple Linear RegressionRegression analysis:  Simple Linear Regression Multiple Linear Regression
Regression analysis: Simple Linear Regression Multiple Linear RegressionRavindra Nath Shukla
 
BEST Call Girls In Greater Noida ✨ 9773824855 ✨ Escorts Service In Delhi Ncr,
BEST Call Girls In Greater Noida ✨ 9773824855 ✨ Escorts Service In Delhi Ncr,BEST Call Girls In Greater Noida ✨ 9773824855 ✨ Escorts Service In Delhi Ncr,
BEST Call Girls In Greater Noida ✨ 9773824855 ✨ Escorts Service In Delhi Ncr,noida100girls
 
VIP Call Girls Pune Kirti 8617697112 Independent Escort Service Pune
VIP Call Girls Pune Kirti 8617697112 Independent Escort Service PuneVIP Call Girls Pune Kirti 8617697112 Independent Escort Service Pune
VIP Call Girls Pune Kirti 8617697112 Independent Escort Service PuneCall girls in Ahmedabad High profile
 
A DAY IN THE LIFE OF A SALESMAN / WOMAN
A DAY IN THE LIFE OF A  SALESMAN / WOMANA DAY IN THE LIFE OF A  SALESMAN / WOMAN
A DAY IN THE LIFE OF A SALESMAN / WOMANIlamathiKannappan
 
Call Girls Navi Mumbai Just Call 9907093804 Top Class Call Girl Service Avail...
Call Girls Navi Mumbai Just Call 9907093804 Top Class Call Girl Service Avail...Call Girls Navi Mumbai Just Call 9907093804 Top Class Call Girl Service Avail...
Call Girls Navi Mumbai Just Call 9907093804 Top Class Call Girl Service Avail...Dipal Arora
 
Call Girls In Panjim North Goa 9971646499 Genuine Service
Call Girls In Panjim North Goa 9971646499 Genuine ServiceCall Girls In Panjim North Goa 9971646499 Genuine Service
Call Girls In Panjim North Goa 9971646499 Genuine Serviceritikaroy0888
 

Recently uploaded (20)

KestrelPro Flyer Japan IT Week 2024 (English)
KestrelPro Flyer Japan IT Week 2024 (English)KestrelPro Flyer Japan IT Week 2024 (English)
KestrelPro Flyer Japan IT Week 2024 (English)
 
Call Girls In Sikandarpur Gurgaon ❤️8860477959_Russian 100% Genuine Escorts I...
Call Girls In Sikandarpur Gurgaon ❤️8860477959_Russian 100% Genuine Escorts I...Call Girls In Sikandarpur Gurgaon ❤️8860477959_Russian 100% Genuine Escorts I...
Call Girls In Sikandarpur Gurgaon ❤️8860477959_Russian 100% Genuine Escorts I...
 
Cash Payment 9602870969 Escort Service in Udaipur Call Girls
Cash Payment 9602870969 Escort Service in Udaipur Call GirlsCash Payment 9602870969 Escort Service in Udaipur Call Girls
Cash Payment 9602870969 Escort Service in Udaipur Call Girls
 
Lucknow 💋 Escorts in Lucknow - 450+ Call Girl Cash Payment 8923113531 Neha Th...
Lucknow 💋 Escorts in Lucknow - 450+ Call Girl Cash Payment 8923113531 Neha Th...Lucknow 💋 Escorts in Lucknow - 450+ Call Girl Cash Payment 8923113531 Neha Th...
Lucknow 💋 Escorts in Lucknow - 450+ Call Girl Cash Payment 8923113531 Neha Th...
 
Best Practices for Implementing an External Recruiting Partnership
Best Practices for Implementing an External Recruiting PartnershipBest Practices for Implementing an External Recruiting Partnership
Best Practices for Implementing an External Recruiting Partnership
 
BEST Call Girls In Old Faridabad ✨ 9773824855 ✨ Escorts Service In Delhi Ncr,
BEST Call Girls In Old Faridabad ✨ 9773824855 ✨ Escorts Service In Delhi Ncr,BEST Call Girls In Old Faridabad ✨ 9773824855 ✨ Escorts Service In Delhi Ncr,
BEST Call Girls In Old Faridabad ✨ 9773824855 ✨ Escorts Service In Delhi Ncr,
 
RE Capital's Visionary Leadership under Newman Leech
RE Capital's Visionary Leadership under Newman LeechRE Capital's Visionary Leadership under Newman Leech
RE Capital's Visionary Leadership under Newman Leech
 
Eni 2024 1Q Results - 24.04.24 business.
Eni 2024 1Q Results - 24.04.24 business.Eni 2024 1Q Results - 24.04.24 business.
Eni 2024 1Q Results - 24.04.24 business.
 
Lowrate Call Girls In Laxmi Nagar Delhi ❤️8860477959 Escorts 100% Genuine Ser...
Lowrate Call Girls In Laxmi Nagar Delhi ❤️8860477959 Escorts 100% Genuine Ser...Lowrate Call Girls In Laxmi Nagar Delhi ❤️8860477959 Escorts 100% Genuine Ser...
Lowrate Call Girls In Laxmi Nagar Delhi ❤️8860477959 Escorts 100% Genuine Ser...
 
2024 Numerator Consumer Study of Cannabis Usage
2024 Numerator Consumer Study of Cannabis Usage2024 Numerator Consumer Study of Cannabis Usage
2024 Numerator Consumer Study of Cannabis Usage
 
Vip Female Escorts Noida 9711199171 Greater Noida Escorts Service
Vip Female Escorts Noida 9711199171 Greater Noida Escorts ServiceVip Female Escorts Noida 9711199171 Greater Noida Escorts Service
Vip Female Escorts Noida 9711199171 Greater Noida Escorts Service
 
VIP Kolkata Call Girl Howrah 👉 8250192130 Available With Room
VIP Kolkata Call Girl Howrah 👉 8250192130  Available With RoomVIP Kolkata Call Girl Howrah 👉 8250192130  Available With Room
VIP Kolkata Call Girl Howrah 👉 8250192130 Available With Room
 
Monte Carlo simulation : Simulation using MCSM
Monte Carlo simulation : Simulation using MCSMMonte Carlo simulation : Simulation using MCSM
Monte Carlo simulation : Simulation using MCSM
 
Call Girls In Sikandarpur Gurgaon ❤️8860477959_Russian 100% Genuine Escorts I...
Call Girls In Sikandarpur Gurgaon ❤️8860477959_Russian 100% Genuine Escorts I...Call Girls In Sikandarpur Gurgaon ❤️8860477959_Russian 100% Genuine Escorts I...
Call Girls In Sikandarpur Gurgaon ❤️8860477959_Russian 100% Genuine Escorts I...
 
Regression analysis: Simple Linear Regression Multiple Linear Regression
Regression analysis:  Simple Linear Regression Multiple Linear RegressionRegression analysis:  Simple Linear Regression Multiple Linear Regression
Regression analysis: Simple Linear Regression Multiple Linear Regression
 
BEST Call Girls In Greater Noida ✨ 9773824855 ✨ Escorts Service In Delhi Ncr,
BEST Call Girls In Greater Noida ✨ 9773824855 ✨ Escorts Service In Delhi Ncr,BEST Call Girls In Greater Noida ✨ 9773824855 ✨ Escorts Service In Delhi Ncr,
BEST Call Girls In Greater Noida ✨ 9773824855 ✨ Escorts Service In Delhi Ncr,
 
VIP Call Girls Pune Kirti 8617697112 Independent Escort Service Pune
VIP Call Girls Pune Kirti 8617697112 Independent Escort Service PuneVIP Call Girls Pune Kirti 8617697112 Independent Escort Service Pune
VIP Call Girls Pune Kirti 8617697112 Independent Escort Service Pune
 
A DAY IN THE LIFE OF A SALESMAN / WOMAN
A DAY IN THE LIFE OF A  SALESMAN / WOMANA DAY IN THE LIFE OF A  SALESMAN / WOMAN
A DAY IN THE LIFE OF A SALESMAN / WOMAN
 
Call Girls Navi Mumbai Just Call 9907093804 Top Class Call Girl Service Avail...
Call Girls Navi Mumbai Just Call 9907093804 Top Class Call Girl Service Avail...Call Girls Navi Mumbai Just Call 9907093804 Top Class Call Girl Service Avail...
Call Girls Navi Mumbai Just Call 9907093804 Top Class Call Girl Service Avail...
 
Call Girls In Panjim North Goa 9971646499 Genuine Service
Call Girls In Panjim North Goa 9971646499 Genuine ServiceCall Girls In Panjim North Goa 9971646499 Genuine Service
Call Girls In Panjim North Goa 9971646499 Genuine Service
 

Kkase capital quarterlyletter q313-1

  • 1. Whitney R. Tilson Managing Partner phone: 212 277 5606 WTilson@KaseCapital.com October 10, 2013 Dear Partner: Our fund rose 3.9% in September vs. 3.1% for the S&P. For the quarter, it declined 2.3% and is up 6.3% year to date vs. 5.2% and 19.8%, respectively, for the S&P. The story in Q3 mirrored the story of the year so far: solid performance among the stocks we own (our average long is up nearly 30%), offset by the headwinds of cash and the short book. I’ve been doing a great deal of thinking and been having many discussions with the smartest people I know in this business about these two headwinds and what, if anything, I should do differently. I’ve reached a number of conclusions. Holding cash and long exposure My biggest mistake since I started managing the fund myself 15 months ago has been underexposure on the long side. I’ve been holding 20-40% cash during most of this period, positioning our fund conservatively – practicing the principle of “be fearful when others are greedy and greedy when others are fearful” – in light of the widespread complacency in the equity markets and the fact that the major indices have regularly been hitting multi-year or even all-time highs. I let my concerns about the market affect how I positioned our fund, with the result that instead of being at my target exposure of 100% long by 30% short, I was typically closer to 70% long by 30% short, which has been costly in light of the market’s strong upward move. Holding such a large amount of cash can make sense for a long-only fund but, when combined with a substantial short book, is overly conservative in the absence of great conviction that the market is about to implode. In the nearly 15 years that I’ve been managing money professionally, I’ve only twice felt this way: in late 1999/early 2000 at the peak of the internet bubble, and in early 2008 when my research led me to believe that the consequences of the bursting of the housing bubble would be much worse than nearly anyone believed at that time. Today, I don’t have this feeling. While there are plenty of things that could upset the current complacency in the markets – for instance, the current government shutdown continuing; Congress failing to raise the debt ceiling; unexpected consequences from the recent jump in interest rates; and/or a sharp economic downturn in Europe, China, Japan, or emerging markets – my best guess is that the U.S. economy will continue to muddle along, as it has been doing for the past few years. As such, going forward I plan to be more disciplined about maintaining my target exposures on both the long and short sides, but also to, on rare occasions, hold more cash and/or increase the fund’s short exposure. Carnegie Hall Tower, 152 West 57th Street, 46th Floor, New York, NY 10019
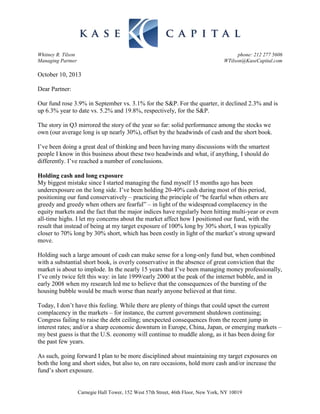
  • 2. The fund is currently 86% long and 22% short, both of which I plan to increase in the near future. Casting a wider net I’ve historically invested almost exclusively in American companies that are subject to U.S. auditing and filing rules and trade on one of the major U.S. exchanges. I have deep experience here, shareholders are well protected, and I have always been fearful of straying outside my circle of competence and being the proverbial sucker at the poker table were I to invest elsewhere. I think I’ve been too dogmatic about this, however, and over time plan to invest some time and energy into becoming familiar with foreign companies and markets. I don’t expect to become a truly global investor anytime soon (if ever), but there are great investment opportunities all over the world and I think expanding my investment horizons will serve us well over time. To date, I have many only one investment in a foreign company, Hyundai Motors preferred stock. Hyundai Motors preferred stock I recently established a nearly 2% position in the preferred stock of Hyundai Motors. I can hear you thinking: “A Korean automaker? What are you thinking???” The simple answer is that this is an excellent company with bright future prospects, and I was able to purchase it – through the preferred stock – at a ridiculously cheap price: 3.4x trailing earnings (not EBITDA, but real earnings). Over the past 15 years, Hyundai, under the leadership of M. K. Chung (whose family owns more than 20% of the company), has transformed itself from a third‐tier industry laggard into the world’s third largest automaker, and has been steadily gaining share, as this chart shows: Hyundai’s Global Market Share -2-
  • 3. Remarkably, the company hasn’t gained share by sacrificing profits – in fact, it has consistently had the highest profit margins among the largest global automakers, as this chart shows: Consolidated Operating Margin, 2009-Q2 2013 Ah, but it’s an automaker, so the balance sheet must be a mess, right? Nope. The company has $20.7 billion in cash (43% of the company’s market cap of $48.3 billion), its debt is tied to its finance arm and more than offset by associated assets, and there are no long-tailed pension and healthcare liabilities that crippled the U.S. automakers (“net defined benefit liabilities” are a mere $906 million). Even without adjusting for the excess cash, the company has generated a high-teens to low-20% return on equity for a number of years. To summarize, this is a good business (albeit in an admittedly lousy industry) that has done very well in recent years – and the stock has responded, rising more than 6x from its late-2008 lows. Nevertheless, today it trades at a mere 8.4x trailing earnings – and pays a small 0.8% dividend to boot. That’s cheap and I might be tempted to buy it – but not when I can instead own it through Hyundai’s Series 3 preferred shares, which trade at a 59% discount to the common stock, meaning we own it today at 3.4x earnings (and will receive a 2% dividend as well). Korean preferred shares Korean preferred shares came into existence in the mid-1980s thanks to a favorable law that allowed Korean companies, many of which are run by families that didn’t wish to dilute their control, to issue equity in the form of preferred shares, which typically had the same economic rights as the common stock, but few or no voting rights. Nearly 150 companies issued preferred shares before the law was changed long ago. For many years, the preferred shares traded at around a 20% discount to their associated common stocks, but during the panic of the Asian financial crisis in 1997, they traded down to more than a -3-
  • 4. 70% discount and, since then, have traded at a 40-70% discount. The current discount is around 60%. I can find no good reason for such a large discount, especially in light of the fact that the Korean market is steadily becoming more shareholder friendly. Obviously, some discount is warranted, but as this chart shows, the preferred stock discount in Korea far exceeds that of other countries: Preferred Stock’s Discount By Country I believe that this is one of those market anomalies in which something is mispriced primarily because it’s always been mispriced. I have no idea when this discount will close, but my experience, to paraphrase Ben Graham, is that while in the short run the market is a voting machine, in the long run it’s a weighing machine. As Korea continues to become more investor friendly, I think the preferred share discount is likely to close over time, which gives me a second way to win on this investment (the first being that Hyundai continues to do well and its common stock rises over time). A final thought: I take some comfort investing in Korea after reading this transcript of a Q&A Buffett did in April 2009 with University of Kansas students: [Buffett then pulled out the 2004 Korean Stock Guide compiled by Citigroup]. My broker at Citigroup told me to look through this Korean version of the Moody’s guide. He said it would look just like 1951. He was right. I began flipping through the pages and found a lot of good companies trading at very low multiples. In 5-6 hours I put together a small portfolio of 20-25 stocks – about $100 million total. One example was DaeHan Flour Mills. It has a 25% market share in wheat flour in South Korea . Book value was 206,000 Won and the company had 201,000 Won in marketable securities and was trading at 2x earnings. The market is clearly not efficient all the time. There are certain opportunities that can make you fabulously rich. Shorting I have two strong feelings about shorting right now: -4-
  • 5. 1) It’s a horrible business, it’s cost all of us dearly over the past 4½ years, I wish I’d never heard of it, and every bone in my body wants to cover every stock I’m short and never short another stock again; and 2) In my nearly 15-year career of professional investing, the only other times that have been as target-rich in terms of juicy, obvious shorts are late 1999/early 2000 and late 2007/early 2008 (and we all know how those ended…). So which feeling am I going to follow? The latter. Not because I am unreasonable, stubborn and a glutton for punishment, but because I am convinced that I can make a lot of money on the short side going forward. The only other time in my investing career in which I seriously considered covering every short and becoming a long-only manager was October 2007. At that time, I went through my short book, stock by stock, and said, “OK, am I willing to cover MBIA at $70? Hell no, not a single share! Allied Capital at $30? Hell no, not a single share! Farmer Mac at $30? Hell no, not a single share!” And on it went… I couldn’t bring myself to cover a single share of any stock I was short – they were all “trembling-with-greed” shorts. And that’s exactly how I feel today. Let me be clear: I have no illusions about what a tough business shorting is. In most years, in fact, I expect that it will detract slightly from our returns. But that’s a price I’m willing to pay for a number of reasons: 1) Having a short book allows me to invest more aggressively on the long side, both in terms of overall portfolio positioning, individual position sizes, and willingness to take risks in certain stocks. Here are some examples of what I mean:  I wouldn’t be comfortable taking our fund’s exposure up to 100% in the current market if it didn’t have meaningful long exposure;  I wouldn’t have held onto my position in Netflix as it’s risen from just above $50 to more than $300 over the past year if our fund wasn’t short a number of similarly volatile, speculative stocks;  I wouldn’t hold such a large position in Howard Hughes (9.5%), another huge winner for us, if our fund weren’t short St. Joe, which is also closely tied to the real estate/housing market; and  I’m not sure I would feel comfortable owning economically sensitive stocks like Hertz and Avis if our fund weren’t short many stocks that I expect would do very poorly if the economy weakens. 2) A short book typically pays off just when you need it, during severe market declines, providing cash to invest on the long side when it’s most attractive. This is exactly what happened in 2008 and early 2009. After inflicting losses as the market rose from early 2003 through October 2007 (the same length of time as the current bull market), our substantial short book cushioned the downturn – our fund was down approximately half the market in 2008 – and allowed me to invest aggressively on the long side, which translated into big gains after the market bottomed in March 2009. -5-
  • 6. 3) I sleep better at night with insurance. At the beginning of every year, I write a check for homeowner’s insurance and at the end of the year, when my apartment hasn’t suffered from a flood or fire, my insurance expires worthless and I have to buy it again. Is it a mistake to buy insurance that turns out to be worthless almost every year? Of course not. I suspect most people wouldn’t quarrel with buying cheap insurance – but it hasn’t been cheap! Over the past 15 months, losses on the short side have offset most of the fund’s gains on the long side, despite long exposure being at least twice as large as short exposure. In other words, our fund’s short book has performed unusually badly. So is the problem that I’m simply uniquely bad at shorting (in which case, I should just stick to the long side)? I think not. I know, talk to, and read the investor letters of dozens of valueoriented long-short fund managers like me and pretty much to a person they report carnage in their short books. One can see this reflected in the HFRX Equity Hedge Fund Index, which was up 6.7% year to date through September – less than half the return of the S&P 500, due largely to losses on the short side I have no doubt. In the past year, I’ve seen more pain inflicted upon short sellers than at any point since the internet bubble in 1999 and early 2000. One 20+ year veteran said it well when he told me: I don’t have the antidote to your pain. We’ve been bludgeoned by this melt-up as well. It’s unbelievably unpleasant. I’ve never seen such widespread capitulation among seasoned short sellers. Many are out of business. This stretch is worse than the internet bubble for me. It’s constant pain across my entire short book, whereas the internet was isolated to one industry – and then you got relief when the bubble burst. So while it’s been painful, this is the kind of environment, I believe, in which those with the courage to maintain a short book will be well rewarded. Adjustments to my short strategy This isn’t to say that there isn’t room for improvement. There is. Specifically, I plan to make the following adjustments: 1) Smaller positions. Over the last 15 months, I’ve been managing the fund’s short book identically to its long book in terms of the number of positions – about a dozen exceptionallyhigh-conviction positions – but roughly half the size. Thus, the average long position has been around 5-6% whereas the average short was in the 2-3% range. I’ve learned the hard way the perils of sizing too many short positions above 2%. Every five or ten years, the market goes through periods like the current one in which overvalued stocks can become even more overvalued, rising 50-100% or more, which causes a lot of pain and sometimes forces me to cover some of the positions to manage risk. -6-
  • 7. Going forward, I plan to size new short positions around 1% rather than 2%, which I expect will enable our fund to better weather the market’s periodic bouts of foolishness. This means, of course, that the fund’s short book will be comprised of more positions, but I believe I can manage this, especially in light of today’s incredibly target-rich environment. 2) Better match the fund’s long and short positions. A meaningful percentage of the fund’s long exposure over the past year has been in large-cap stocks like Berkshire Hathaway, AIG, Citigroup and Goldman Sachs, whereas the short positions have tended to be in smaller, more volatile, heavily shorted, battleground stocks. These stocks tend to be the most overvalued and have the potential to fall the furthest – often, I believe, 100% – but they can also rise the most during periods of excess liquidity and complacency. (It hasn’t been a complete mismatch, as the fund’s long book has some similarly volatile stocks like Netflix, Spark Networks, and Deckers, all of which have performed beautifully.) Going forward I plan to better balance the fund’s long and short positions by having a wider mix of stocks on the short side. Among my three favorite types of shorts, fads, frauds and failures, I’ve had too many of the first two and not enough of the letter – what one friend called “reverse compounders.” A good example in our short book today is St. Joe, a stock I’ve written extensively about in past letters, where very little is happening and I see minimal value beyond the timberland. 3) Be more patient. I’ve been reasonably successful over the years in being able to identify hugely overvalued stocks, but have been less successful in getting the timing right. I find that I can frequently correctly foresee what’s going to happen a year or two in the future – but am often amazed at how the market – especially this market – ignores huge red flags at certain companies and runs their stocks up further in the short term. I’ve certainly gained a greater appreciation for the power of short-term stock price momentum and am going to make more of an effort to be patient, stay out of the way of freight trains on the way up, and make money shorting these types of stocks on the way down. Allow me to illustrate this with two examples. First, I’ve recently cut our fund’s short position in World Acceptance, which I discussed at length in my Q2 letter, from a bit over 2% to 0.5% – not because I’ve lost any degree of conviction in investment thesis, but rather because I recognize that it might take some time, perhaps even years, for regulators to act to rein in this company. In the meantime, exploiting the vast majority of its customers is a heck of a good business, so I expect the company will continue to grow – and its share price will continue to rise – so I’ll patiently wait with a toe-hold position until there’s clear evidence that regulators are taking action and only then size up the position. Sure, I’ll miss the peak and the stock might be down 10-20% before I act with conviction, but I think the downside here is 70-100%. Another example of the need for me to be more patient is Green Mountain Coffee Roasters, where I’ve twice been too early. Here is the stock chart over the past five years: -7-
  • 8. I shorted the stock much too early in 2010, took a lot of pain as it skyrocketed during most of 2011, and then made it all back and then some as it collapsed in late 2011 and early 2012. But I would have made more if I’d waited until after the company missed expectations and lowered guidance to short it. Even though the stock had fallen 20% at that point, it was still a great short because the momentum was broken yet the valuation remained extreme (it ultimately ended up collapsing by more than 80%). I then covered the position and waited to see if I might get another opportunity to short it, as the two patents that gave the company monopolistic pricing and market share for its K-cups expired in September 2012. My research led me to believe that numerous competitors would then enter the market and both take market share and force Green Mountain to reduce pricing, severely impacting Green Mountain’s profitability, especially since it’s a high-cost producer. Sure enough, the stock more than doubled off its lows and I reestablished the short position from January through April of this year at prices ranging from $40 to $55 – and got run over as the stock rocketed to nearly $90 by the end of August (it has since pulled back to around $67). My mistake earlier this year was that, while I was confident that new competitors would emerge soon after Green Mountain’s patent expired, they had not yet done so to any material degree. Thus, the company was able to report a couple of strong quarters, pooh-pooh competitive threats, and give rosy guidance, which led to the stock doubling. Shame on me for not recognizing that it would take time for competitors to ramp up K-cup production and win shelf space among the nation’s retailers. But today, the evidence is clear that a competitive tsunami is hitting Green Mountain. As you can see in this chart, competitors already have approximately 20% of the market and are gaining more than one percentage point per month (as shown by the green line): -8-
  • 9. Nielsen Single Serve Data ($ Market Share) 100% 80% 60% 40% 20% 0% Jul-09 Nov-09 Mar-10 Jul-10 Nov-10 Mar-11 Jul-11 Nov-11 Mar-12 Jul-12 Nov-12 Mar-13 Jul-13 GMCR Owned GMCR Licensed Non-Licensed The latest Neilsen data out yesterday revealed even worse news: K-cup unit sales for Green Mountain owned and licensed brands rose a mere 4.5% year-over-year in September while average pricing fell 3.3%, resulting in tepid 1.1% dollar sales growth – all terrible numbers that are far below the company’s guidance and analyst estimates, so it’s not surprising that the stock fell 7% yesterday (and it’s down again today on news that Whole Foods is now selling private label K-cups). Some savvy investors are starting to realize what is happening, as the stock is now down 25% from its recent high, but most investors and analysts still appear to be in the dark – and Green Mountain is, of course, trying to keep them there: at its analyst day last month, it presented a slide with old data showing that non-licensed K-cups had only 8% of the market. Another important data point is a recent survey of buyers and store managers at leading retailers nationwide. A majority of the respondents said that while K-cup sales are still rising, “GMCR KCup growth rates decelerated, compared with early 2013, and GMCR lost market share.” Here are some quotes:   “Green Mountain’s rate of growth is decelerating because there is so much more competition out there, and private label is giving them a run for their money. Everyone is getting into the [pods] business.” “The K-Cup people are coming out of the woodwork. In a way, it reminds me of craft beers – lots of local brands. It is open season right now.”  “They’re all discounting now, trying to compete with each other and with private label.”  “We pulled a couple of Green Mountain ads because we did not want to go out there at $6.99 after the competition’s $4.99 ad.” -9-
  • 10.  “Discounting is much more aggressive now due to competition; that’s what is driving the prices. Green Mountain hasn’t been as aggressive and that’s why they’re in so much trouble right now.” A small anecdote that supports my thesis – this is what I saw when I visited Costco yesterday: Costco is selling four brands of K-cups: (from left to right) Starbucks, Green Mountain, Newman’s Own, and Kirkland. Starbucks and Newman’s Own are both licensees of Green Mountain, whereas Kirkland is the Costco store brand, so in terms of shelf space, the nonlicensed brand has 25% share. I don’t know actual sales of course, but note the pricing: at first glance, it appears to be identical: $37.99/box for each brand. But look closer: the Kirkland box has 100 K-cups whereas the others only have 80 – in other words, Green Mountain’s K-cups are 25% more expensive. In this hyper-competitive world, I don’t think that kind of price discrepancy is sustainable. I think it is highly likely that Green Mountain and its licensees continue to lose unit market share at a rapid rate and will be forced to continue cutting pricing as well, which will severely impact -10-
  • 11. Green Mountain’s earnings – and its richly valued stock, currently trading at 24x trailing earnings. As an added bonus, the numbers Green Mountain is reporting don’t make sense to me, which makes me suspicious that, at the very least, the company has too much inventory and/or is stuffing the channel, which I discuss in an article I published a few weeks ago, Green Mountain Coffee: One Of My Favorite Shorts (see Appendix A). In summary, while I was too early in getting back into the GMCR short, I’m convinced that the stock is a fantastic short today and hence it’s among my largest at 2.2%. K12 I gave a detailed presentation on why K12 was our fund’s largest short position at the Value Investing Congress three weeks ago (I emailed you the slides the following day; the latest version is posted here). At the time, the stock was at $35.15. In the following weeks, the stock trickled down to around $28 – and then the company gave weak guidance after the close on Tuesday and the stock crashed 38% yesterday to $17.60, down by nearly half since I went public with my concerns. Here is page 8 of my presentation, which summarizes my investment thesis: • K12’s aggressive student recruitment has led to dismal academic results by students and sky-high dropout rates, in some cases more than 50% annually • I wouldn’t be short K12 if it were carefully targeting students who were likely to benefit from its schools – typically those who have a high degree of self-motivation and strong parental commitment  But K12 is instead doing the opposite; numerous former employees say that K12 accepts any student and actually targets at-risk students, who are least likely to succeed in an online school • There have been so many regulatory issues and accusations of malfeasance that I’m convinced the problems are endemic • Enrollment violations, uncertified teachers, illegally siphoning profits from nonprofit entities • States (and the IRS) are waking up to what K12 is doing and the company is coming under increased scrutiny, which is beginning to impair K12’s growth – and I believe this trend will accelerate • K12’s founder, Knowledge Universe, distributed its entire stake to its investors earlier this month • Yet the stock, trading at nearly 50x trailing earnings, is priced as if K12 will continue to grow at high rates for the foreseeable future and also improve on its persistently low margins and free cash flow Like subprime lending and for-profit colleges, the business makes sense on a small scale but, fueled by lax regulation and easy government money, the sector, led by K12, has run amok For more on K12, see my article, An Analysis of K12 and Why It Is My Largest Short Position, published on September 22nd (Appendix B) and the article I just published today, Why I’m Not Covering My K12 Short (Appendix C). -11-
  • 12. Conclusion Thank you for your confidence and support. If you have any comments or questions, please call me anytime at (212) 277-5606. Sincerely yours, Whitney Tilson The unaudited return for the Kase Fund versus major benchmarks (including reinvested dividends) is: Kase Fund – net S&P 500 HFRX Equity Hedge Fund Index September 3.9% 3.1% 1.4% Q3 -2.3% 5.2% n/a YTD 6.3% 19.8% 6.7% Since Inception 123.9% 79.4% n/a Past performance is not indicative of future results. Please refer to the disclosure section at the end of this letter. The Kase Fund was launched on 1/1/99. Kase Fund Performance (Net) Since Inception 200 180 160 140 120 100 (%) 80 60 40 20 0 -20 -40 Jan-99 Jan-00 Jan-01 Jan-02 Jan-03 Jan-04 Jan-05 Jan-06 Jan-07 Jan-08 Jan-09 Jan-10 Jan-11 Jan-12 Jan-13 Kase Fund Past performance is not indicative of future results. -12- S&P 500
  • 13. Kase Fund Monthly Performance (Net) Since Inception 1999 2000 2001 2002 2003 2004 2005 2006 2007 2008 2009 2010 2011 2012 2013 Kase S&P Kase S&P Kase S&P Kase S&P Kase S&P Kase S&P Kase S&P Kase S&P Kase S&P Kase S&P Kase S&P Kase S&P Kase S&P Kase S&P Kase S&P Fund 500 Fund 500 Fund 500 Fund 500 Fund 500 Fund 500 Fund 500 Fund 500 Fund 500 Fund 500 Fund 500 Fund 500 Fund 500 Fund 500 Fund 500 January 7.8 4.1 -6.3 -5.0 4.4 3.6 -1.8 -1.5 -5.5 -2.6 4.7 1.8 1.1 -2.4 1.9 2.7 2.4 1.7 1.9 -5.9 -3.6 -1.6 -3.6 -2.8 2.4 12.6 4.5 4.5 5.2 February -2.9 -3.1 6.2 -1.9 -0.6 -9.2 -1.1 -2.0 2.9 -1.6 7.0 1.5 2.1 2.0 -3.1 0.2 -3.3 -2.1 -6.9 -3.3 -8.9 -10.8 7.3 3.1 4.1 3.4 -0.8 4.3 0.8 1.4 March 4.1 4.0 10.3 9.8 -2.6 -6.4 3.0 3.7 1.4 0.9 3.9 -1.5 3.9 -1.7 3.9 1.3 -0.8 1.1 -2.3 -0.5 2.9 9.0 4.6 6.0 -4.1 0.0 10.9 3.3 1.3 3.8 April 2.1 3.7 -5.1 -3.0 5.1 7.8 -0.2 -6.0 10.5 8.2 2.4 -1.5 0.6 -1.9 2.2 1.4 4.4 4.6 -0.9 4.9 20.1 9.6 -2.1 1.6 1.9 3.0 1.3 -0.6 0.1 1.9 May -5.7 -2.5 -2.8 -2.0 1.8 0.6 0.0 -0.8 6.6 5.3 -1.4 1.4 -2.6 3.2 1.8 -2.9 2.5 3.3 7.9 1.2 8.1 5.5 -2.6 -8.0 -1.9 -1.1 -13.6 -6.0 2.8 2.3 June 2.2 5.8 4.1 2.4 4.6 -2.4 -7.3 -7.1 2.9 1.3 0.1 1.9 -3.1 0.1 -0.2 0.2 -3.0 -1.5 -1.2 -8.4 -5.0 0.2 4.5 -5.2 -2.4 -1.7 -1.3 July -0.7 -3.2 -3.6 -1.6 -1.1 -1.0 -5.0 -7.9 2.3 1.7 4.6 -3.4 0.5 3.7 -0.9 0.7 -5.4 -3.0 -2.5 -0.9 6.8 7.6 3.5 7.0 -4.6 August 4.1 -0.4 5.4 6.1 2.5 -6.3 -4.3 0.5 0.4 1.9 -0.9 0.4 -3.2 -1.0 2.9 2.3 1.7 1.5 -3.3 1.3 6.3 3.6 -1.5 September -3.3 -2.7 -7.2 -5.3 -6.1 -8.1 -5.4 -10.9 1.7 -1.0 -1.6 1.1 -1.5 0.8 5.0 2.6 -1.1 3.6 15.9 -9.1 5.9 3.7 1.7 8.9 -9.3 -7.0 October 8.1 6.4 -4.5 -0.3 -0.8 1.9 2.8 6.2 5.6 -0.4 1.5 3.5 -1.6 6.3 3.5 8.2 1.7 -12.5 -16.8 -1.9 -1.8 -1.7 3.8 7.0 10.9 November 2.8 2.0 -1.5 -7.9 2.3 7.6 4.1 5.8 2.2 0.8 0.8 4.0 3.1 3.7 1.9 1.7 -3.6 -4.2 -8.9 -7.1 -1.2 6.0 -1.9 0.0 -0.6 December 9.8 5.9 2.3 0.5 6.5 0.9 -7.4 -5.8 -0.4 5.3 -0.2 3.4 -1.3 0.0 1.4 1.4 -4.3 -0.7 -4.0 1.1 5.5 1.9 0.5 6.7 0.1 YTD TOTAL 31.0 21.0 -4.5 -9.1 16.5 -11.9 -22.2 -22.1 35.1 28.6 20.6 10.9 2.6 4.9 25.2 15.8 -3.2 8.8 -8.4 0.5 4.1 -1.0 -2.0 0.2 1.4 -0.1 5.1 -4.5 -13.9 -5.4 -7.2 2.3 -5.8 -2.9 0.0 2.6 3.9 3.1 1.6 -1.9 -0.2 -4.5 0.6 1.0 0.1 0.9 6.3 19.8 5.5 -18.1 -37.0 37.1 26.5 10.5 15.1 -24.9 2.1 Past performance is not indicative of future results. Note: Returns in 2001, 2003, and 2009 reflect the benefit of the high-water mark, assuming an investor at inception. -13- -1.7 16.0
  • 14. Appendix A Green Mountain Coffee: One Of My Favorite Shorts Whitney Tilson 2,017 Followers September 13, 2013 http://seekingalpha.com/article/1690592-green-mountain-coffee-one-of-my-favorite-shorts Jesse Eisinger, one of the best investigative journalists around, raises some very good questions about Green Mountain Coffee (GMCR) and its accounting in his column that ran in the New York Times earlier this week, Seeking Answers From Green Mountain Coffee, which begins: Green Mountain Coffee Roasters’ first-ever investor day is Tuesday, and the company is flying high. The stock price of the company, which sells coffee machines under the Keurig brand and the little K-Cups that go in them, has soared more than 260 percent in the last year. Despite persistent questions, most of Wall Street remains resolutely bullish on Green Mountain, which has a market value of $12 billion. In 2010, the company disclosed it was being investigated by the Securities and Exchange Commission. In 2011, the hedge fund manager David Einhorn, who is betting against Green Mountain’s stock price, delivered a highly critical 110-slide speech at an investor conference, raising questions about the company’s future prospects and, more seriously, its bookkeeping. He followed up a year later with another one. A class-action lawsuit, which was dismissed, quoted anonymous former employees about suspicious activities. Green Mountain has said it conducted an internal investigation that cleared the company. Green Mountain operates on a razor/razor blade model - selling brewing machines but making its real money on the K-Cups. It used to disclose exactly how many K-Cups it sold but stopped doing so in 2010. Instead, it tells investors the year-over-year percentage growth. Wall Street has dutifully plugged numbers in to estimate the unit sales. -14-
  • 15. Last year, Green Mountain faced expirations of the patents that covered its brewing system. Wall Street has been monitoring whether Green Mountain will lose market share to new private-label knockoffs. And indeed, a recent Barron’s article suggested that it was losing share faster than expected. A recent disclosure from the company’s new chief executive, Brian Kelley, has revived the questions about sales, as do on-the-ground accounts I have received from former factory and warehouse workers. Because Green Mountain’s investor day will give analysts and shareholders unusual access to company executives, it seems like an opportunity to ask them some hard questions. Here are a few from me. *Just how many K-Cups has Green Mountain sold year-to-date and is it less than the Street understands?... *How wide is the gap between how many K-Cups the company says it has sold and how many have ended up in customer’s hands? And why?... *What explains the unusual movements of Green Mountain inventory described by some former company workers and associates?... *What is happening with the SEC.’s investigation of Green Mountain, which the company has said involves its accounting practices?... Let’s take a closer look at K-Cups, where the math just doesn’t make sense - and the company isn’t helping with an explanation. At the analyst day earlier this week (see webcast and 188-slide presentation here), the company was asked to reconcile this estimate of K-Cups (since, as Eisinger notes, the company stopped disclosing K-Cup sales in 2010): there are 16 million brewers, GMCR claims usage (an “attachment rate”) of 1.4 K-Cups per day x 365 days/year, which results in sales of 8.2 billion K-Cups per year (which doesn’t even count maybe 15-20% additional consumption away from home). But GMCR isn’t selling anything close to this number of K-Cups, per both analysts and the company (see Eisinger’s article), so what gives? My answer: usage is declining. It makes sense that the people who bought brewers first are likely to be the heaviest users, so the company and analysts should be modeling declining attachment rates - but of course they’re not. When Mark Astrachan, the Stifel Nicolaus’ analyst (and the only one with a “sell” rating on the stock), asked about this at the analyst day, Green Mountain’s CEO Brian Kelley said: “We don’t multiply it by 365. (inaudible) You’re applying straight math that we don’t do.” (Yes, he really said that!) When Astrachan tried to follow up, Kelley said: “We’re not going to get into that here. That’s not the intent and we’re not going to get into the model in that kind of detail here.” (The “detail” he’s referring to is the attachment rate of the brewers - one of the most important metrics there is!) -15-
  • 16. An even greater concern is that 700-900 million K-Cups can’t be accounted for. Eisinger writes: That’s a far cry from 5.6 billion. There seems to be a gap in the United States of about 900 million K-Cups. What’s going on? Mr. Brandt said the company declined to give its overall sales volume, but said the IRI number that I was furnished with was too low. He said a company analysis indicated that this portion of Green Mountain’s sales should be about 2.7 billion, not 2.6 billion. Still, even if we use the company’s figure of 2.7 billion, total sales in the United States would be 4.9 billion, or about 700 million K-Cups short of what the company has said. That’s a lot of extra K-Cups sitting in the channel. Maybe I’m just being paranoid, but I’ve seen this kind of thing before: in many of the China frauds, companies were booking fake sales, resulting in fake profits. But that leads to a big problem for the companies: it’s hard to fake all the cash that should be in the bank as a result of the supposed profits. The solution? Make overpriced/fraudulent acquisitions and/or fake excessive cap ex to reduce the cash (that was, of course, never there). Now go back and read David Einhorn’s 110-slide presentation on GMCR at the Value Investing Congress on Oct. 17, 2011 (posted here) and look at the high-priced acquisitions on pages 50-53 and pages 68-72 on cap ex. Einhorn estimated that $431 million (58%) of GMCR’s 2012 cap ex was “unexplained” and concluded:    Capital spending is growing much faster than the business Capital intensity should be getting more efficient as the company achieves scale The gap is so large and insufficiently explained that it raises questions about what is being capitalized and casts doubt on the business model Einhorn gave an update on GMCR in his presentation at the Value Investing Congress on Oct. 2, 2012. He didn’t release the slides, but here are my notes: GMCR’s cap ex as a percentage of sales was 11.0% in 2011, 13.1% (est.) in 2012, and 9.2% (guidance) in 2013. Compare this to the 3.3% average in the food products industry, with a range of 1.0% to 6.3%. GMCR’s cumulative cap ex from 2007-2012 was $1.043 billion and K-Cup shipments in 2012 were 7.1 billion. Divide these two and you get 14.7 cents of cap ex over six years for each K-Cup produced in 2012. Einhorn compared this to a competitor, which spent 3.8 cents for each K-Cup produced (buying the same production equipment as GMCR). Again, massive unexplained cap ex. Einhorn then turned to the production capacity that GMCR’s competitors were bringing online and estimated that they would have enough capacity to take 19% market share by the end of 2012 and 26% by the end of 2013. -16-
  • 17. Lastly, Einhorn showed that competitors were already selling K-Cups for 22-39% less than GMCR was, and highlighted price cuts GMCR had taken that would wipe out nearly all of its profit. (Obviously these last two things haven’t occurred yet - but that doesn’t mean they won’t…) Is GMCR committing massive accounting fraud? I don’t know - and I certainly can’t prove it but there are a number of warning flags, so I sure can’t rule it out. The company could easily put a lot of these concerns to rest by providing some obvious disclosure - like number of K-Cups sold - but refuses to (despite providing highly granular disclosure on most other matters), which makes me all the more suspicious… The nice thing about GMCR as a short is that I think it’s a good one even if its accounting is clean because of its very high valuation (29x trailing EPS and 22x FYE 9/14 estimates (if you believe them)) combined with its patent loss a year ago, which is resulting in a ton of low-cost competition entering the market (see page 44-48 of Einhorn’s 2011 presentation and my notes from his 2012 presentation above). It’s almost never pretty when a company with a monopoly market share and monopolistic pricing begins to face competition from low-cost generic producers (think what happens when a drug goes off patent) - but it can take some time for the competition to emerge and impact the monopolist’s financials, during which time the monopolist can give whatever guidance it wants (and you can be sure that Wall St. “analysts” won’t question the pie-in-the-sky guidance). Witness this week’s analyst day… -17-
  • 18. Appendix B An Analysis of K12 and Why It Is My Largest Short Position Whitney Tilson 2,017 Followers September 22, 2013 http://seekingalpha.com/article/1707192-an-analysis-of-k12-and-why-it-is-my-largest-shortposition Last Tuesday at the Value Investing Congress, I gave a 123-slide presentation (posted here) about my largest short position, K12 (ticker: LRN). In it, I shared the many reasons why I think the company (and the entire sector) have run amok and why, at 46x earnings, I think the stock is a fantastic short. The Bull Case for K12 There are many reasons that explain the bullishness of some investors and nearly all analysts (seven of the eight who follow the stock have a buy or strong buy on it). First, K12 has grown its revenue 32% annually over the past decade, as this chart shows: Revenue ($M) $900 $800 $700 $600 $500 $400 $300 $200 $100 $0 2004 2005 2006 2007 2008 2009 2010 2011 2012 2013 And analysts are projecting revenue and EPS growth of 16% and 32%, respectively, over the next 12 months, fueled 10 new schools and enrollment cap expansion of 17,000 new seats. And -18-
  • 19. K12 has less than $1 billion in revenue in a market that it says could become as large as $15 billion annually. It’s also important to note that online schools sector – schools in which students are supposedly learning by sitting at home all day in front of a computer, interacting with teachers almost exclusively online – can be an excellent option for certain students – for example, children whose pace is extremely accelerated, entertainers, solo athletes, teenage mothers who need to stay home with their babies, victims of bullying, children with cancer, seizure disorders, peanut allergies, etc. K12 has a well-regarded curriculum, reports very high parental and student satisfaction, and has strong political support, especially among Republicans, for giving parents school choice. Finally, it’s operating in a space, online learning, that has enormous buzz (think MOOCs, etc.). So what’s not to like? Let me count the ways… (Note that my critique is specifically of K12, not all online charter schools, for-profit charter schools or blended learning schools. While I think the online charter school sector has, overall, run amok, there are a small number of good online schools – and a few students at even the worst online schools are doing well.) Weakening Financials and Aggressive Accounting In my presentation, I show that K12’s profit margins and free cash flows are low and erratic, days sales outstanding has doubled in the past five years, the company uses aggressive accounting techniques to inflate reported profits, and K12’s founder, Knowledge Universe, distributed its entire stake to its investors only a few weeks ago. But I want to draw particular attention to this chart, which shows that year-over-year revenue growth – critical for a stock trading at 46x earnings – has been falling sharply over the past two years, and is projected to fall further in the next year (to 16%): Year-Over-Year Revenue Growth 50% 40% 30% 20% 10% 0% Q1 '11 Q2 '11 Q3 '11 Q4 '11 Q1 '12 Q2 '12 Q3 '12 Q4 '12 Q1 '13 Q2 '13 Q3 '13 Q4 '13 -19-
  • 20. Aggressive Recruitment Leads to Vast Numbers of Students Destined to Fail While online schools can be an excellent option for certain students, it’s a very small number – typically those who have a high degree of self-motivation and strong parental commitment. It’s sort of obvious if you think about it. Do you think you would have learned more during your K12 educational experience if you’d sat at home in front of a computer, or gone to school and had daily face-to-face interaction with teachers? How many of today’s youth – in a world filled with 500 TV channels, texting, video games, etc. – do you think are better off at home rather than being at school? Lastly, what do you think the answer is for the most at-risk kids, who typically come from poor, single-parent households, in which the parent has little time or ability to be the “parent coach” that’s so critical to online education? Tom Loveless, an education researcher at the Brookings Institution who did paid consulting for K12 in its early years, said: “The enthusiasts for cyber learning have overstated the potential. What they keep forgetting is we’re not talking about college students here. We’re talking about high schoolers and young kids. The idea that parents go to work and leave their kids in front of a computer—it’s absurd.” In short, online schools are only educationally appropriate for a very small number of students, which means that K12 and its peers need to be highly selective in recruiting students, warning parents away whose kids are unlikely to succeed at an online school, especially at-risk youth. So what does K12 do? Exactly the opposite. Since going public in late 2007, numerous former employees have told me that K12 has adopted a growth-at-any cost mentality in order to support its richly priced stock. Jeff Shaw, the former Head of School of Ohio Virtual Academy (which today accounts for 11% of K12’s revenue), told me: After the IPO, I got discouraged because the company’s priority seemed to shift from academics to growth – it wasn’t so much about academic achievement but on delivering the promised enrollment numbers to shareholders. [K12’s] call centers that were encouraging enrollment and enrolling students who were obviously ill-suited for learning in a virtual environment. It was apparent to those of us operating schools that parents weren’t being given the whole story. K12 oversold students’ potential to be successful and obligated teachers to do things they wouldn’t likely to be able to do. Eventually, it seemed as though K12’s enrollment strategy was to cast a wide net into the sea of school choice and keep whatever they caught regardless if the catch was appropriate for virtual learning or not. …I am shocked that the stock continues to rise. I think it’s a house of cards that is going to collapse. It boggles my mind when I read about and hear stories about what’s going on in schools managed by K12. Numerous other insiders confirm that what Shaw observed at his school was equally true across the company (notes from these interviews as well as the entire interview with Shaw are included in my presentation). -20-
  • 21. Deliberately Targeting At-Risk Students Worst of all, K12 in recent years has been deliberately targeting at-risk students, who are least likely to succeed at an online school. K12 CEO Ron Packard claims that it’s for noble reasons: It’s just K12’s culture. We want to help kids. It’s just so ingrained all the way through the organization about helping as many kids, doing the right thing for kids. At another time, he said: We don’t want to be recruiting kids who it’s not right for. That would be a disaster academically. It would be a disaster for the company economically. This is nonsense. Luis Huerta, Associate Professor of Education & Public Policy at Teachers College, Columbia University, who has studied K12 carefully and published reports on virtual schools, told me: The virtual providers like K12 are now mostly going after at-risk kids, kids on their last straw – if they didn’t sign up, many would be dropouts or go back to juvenile court. K12’s phone banks have figured out a way to target dropouts and special ed kids. They will sign up anyone – as long as that warm body signs in periodically, K12 can draw enrollment money from the district. It isn’t for some noble reason – it’s because these kids demand the least amount of education. These aren’t kids and parents who will be knocking on K12’s doors saying, “Hey, you need to do more for my kid.” K12 and Packard use this as an advertisement, saying they’re doing noble things and wondering why they’re being criticized. It’s almost comical. It’s so misleading and conniving. Again, numerous people confirm Huerta’s account. One person told me that online charters know that “internet advertising leads to lots of students enrolling, but none succeed. Yet online charters are spending big money on this.” And a former Employment Consultant wrote the following on the web site, Glassdoor: They push these quotes and “true stories” about all the children they have helped, but the truth is, this product is really only good for about 10% of the market that they target. The only success stories come from homes where there is a large parental support and willingness for the student to learn. K12 markets to low income families who are oftentimes more interested in a free computer and staying out of truancy court than anything else. Not only that, but the curriculum (which is actually very well developed) simply will not work for a low educated family who is having a hard time getting their child to go to a brick and mortar school, let [alone] apply themselves in a home based environment. They push enrollments on families where the adult in the home cannot even read, speak, or write in English, knowing that these students are destined to fail. -21-
  • 22. While K12 celebrates how many at-risk students it’s serving, I view it as an educational catastrophe in light of the these students’ need for intensive, personalized instruction and hence how inappropriate online education is for most of them. Low Spending on Teachers, Who Are Harried, Overworked and Unsupported K12’s online schools spend far less on teacher and administrator salaries than regular schools, as this chart shows: Per-Pupil Expenditures for Salaries, 2008-09 Source: Understanding and Improving Full-Time Virtual Schools: A Study of Student Characteristics, School Finance, and School Performance in Schools Operated by K12 Inc., National Education Policy Center, 7/12. In light of such low spending, it’s not surprising that many teachers report excessive class sizes and feeling harried, overworked and unsupported. One teacher I spoke with, who taught English from 2010-12 at Agora Cyber Charter School, K12’s largest, accounting for 14% of the company’s total revenues, told me: It was a horrible experience. Every teacher had the same experience I did. Before I started, I was told there would be a lot of support, a low student-teacher ratio, and that if there were students who didn’t show up, they’d take them out and replace them with another. But they took everybody. There was no teacher to student ratio. When I started, I was assigned 300 students, which was very, very overwhelming. I would try to read each of the essays students turned in a try to grade it and spend the appropriate time, but I was really struggling with that. I couldn’t keep up. I was told to skim over the papers and grade with a rubric. For each class, I’d have maybe seven out of 30 students in that particular section attend – and even among those seven, just because their name was there showing them present doesn’t mean they were at their computers. A huge portion of my students never showed up or did anything. I have no clue what happened to them, though I have no doubt Agora was charging the state for them. -22-
  • 23. When it came time to give grades, I was told, whatever I had to do, I had to pass every student. I would not say there was much learning going on. If students were doing the program like they were supposed to, it could work – but the majority of students weren’t coming from a family where a parent would help them. (My notes from the entire interview are in my presentation.) Again, numerous other former teachers confirm this account. Horrific Educational Outcomes In light of K12’s growth-at-any-cost approach, targeting of at-risk students, and low spending on teachers, one would expect terrible educational outcomes – but they’re even worse than anyone could imagine. K12, of course, tries to hide this by producing a slick, colorful 132-page Academic Report (which you can download here), which claims that for K12’s students in reading, “overall achievement was 196% of the norm group gain” and in math, “overall achievement was 97% of the norm group gain.” These results are virtually meaningless for a number of reasons: 1) K12 measures its students’ academic growth using the Scantron test, which is not a stateadopted exam, but rather simply a diagnostic tool that is used by K12; 2) K12 has yet to allow independent external evaluators to both validate its data collection efforts and more importantly evaluate its analysis of student achievement data, across all K12 schools; 3) The Scantron test is given in the home, unsupervised and untimed, making it easy for students to get help from a parent or the internet; 4) Only approximately 70% of eligible students take the test (likely to be the better performing ones of course); and 5) K12’s purportedly strong Scantron results stand in stark contrast to K12 students’ dismal results on state tests. K12 now admits that the Scantron results can’t be relied on (but that hasn’t prevented the company from peddling them to shareholders, politicians, regulators, etc.). K12 Executive Chairman Nathaniel Davis said, “The Scantron tests are optional for K12 students, and about 30 percent decline to take them. That means the company has been comparing a self-selected group of K12 students to the national norm, which isn’t appropriate.” The company, he said, needs to find “a more honest assessment” of student progress. Let’s look at other, independent measures of K12’s educational outcomes. There are various ways to measure them, so let’s start with percentage of schools making AYP (Adequate Yearly -23-
  • 24. Progress) under the No Child Left Behind Act. As this chart shows, barely a quarter of K12’s schools made AYP vs. more than half of all schools: Percent of Schools That Met AYP, 2010-11 Source: Understanding and Improving Full-Time Virtual Schools: A Study of Student Characteristics, School Finance, and School Performance in Schools Operated by K12 Inc., National Education Policy Center, 7/12 The same study also showed that 29 of 36 K12 schools (81%) that were assigned school performance ratings by state education authorities failed to earn a rating that indicated satisfactory progress status in 2010-11. Finally, it showed that K12 students trailed state averages for the states in which K12 operates in both reading and math at every grade level (see charts in my presentation). K12 claims that its dismal academic results are because it serves more at-risk students, but this is questionable for two reasons: 1) Though its proportion of at-risk students has indeed risen in recent years, it’s from a low base so it’s not clear whether K12 is, in fact, serving a higher proportion of such students relative to state averages; and 2) Even growth measures show dismal performance. K12 argues (correctly) that “a more accurate method for measuring student performance is the progress a student makes over the course of a school year, also known as a “growth measure”, so let’s look at these results. Tennessee, which is well known for having a robust system for measuring student growth, tracked the growth of students in math, reading and science in the 2012-13 school year at all 1,300 elementary and middle schools in the state, including K12’s Tennessee Virtual Academy. As you can see from this scatter plot of math results, TVA students at the beginning of the school year are slightly below the state average (x axis), but their academic growth (y axis) is by far the worst of any school in the state (the results for reading and science are nearly identical, as you can see in my presentation): -24-
  • 25. Math I think it’s safe to say that there’s almost no learning at all going on at TVA – and I’m not aware that TVA is much different from K12’s other schools. In Ohio, home to K12’s second largest school, Ohio Virtual Academy, which accounts for 11% of K12’s revenues, the state recently reported that the six biggest cyber schools in the state all got Fs on their state progress reports, with OHVA doing worst of all. The state counts a progress score of -2 as a complete failure for a school – and OHVA’s score was -27! Studies of growth metrics in Pennsylvania and Colorado show similar results, which I document in my presentation. Lastly, let’s look at graduation rates. As this chart shows, the on-time graduation rate for the K12 schools is 49.1%, compared with a rate of 79.4% for the states in which K12 operates schools: -25-
  • 26. Graduation Rate K12’s Sky-High Student Dropout Rate Another aspect of K12’s horrific educational outcomes is the sky-high student dropout rate, which exceeds 50% annually at some schools. K12 has never released this data – it is nowhere to be found in its 132-page Academic Report, and in a conference call on November 16, 2011, CEO Ron Packard, while admitting that “[w]e track churn immensely,” said that “we haven’t chosen to” disclose churn rates to investors. Instead, the company only acknowledges that “online schools experience relatively high departure rates,” but says that it has “maintained consistent retention rates over the past five years.” However, on that same conference call, Packer did reveal that “about 60% of the kids who start with us in September are with us a year later” – meaning a 40% churn rate! This is consistent with other data that various researchers and journalists have been able to piece together on a school-by-school basis. For example, Journalist Roddy Boyd of The Financial Investigator, in an article entitled, K12: A Corporate Destiny Manifested, collected data for the 2010 school year for four of K12’s largest schools in Pennsylvania, Ohio, California and Colorado and calculated that student churn ranged from 24-51%. Another study of online schools in Colorado, of which K12’s is the largest, found that “half the online students wind up leaving within a year.” Is K12 Defrauding States Via Lax Enrollment Policies? In most states, K12 must stop charging states for students if they stop coming to school (i.e., signing in) after a certain period of time, but there is significant anecdotal evidence that K12 doesn’t do this. Instead, it manipulates student counts and underreports student truancy and withdrawals to increase its profits. A study of 10 online schools in Colorado concluded that “millions of dollars are going to virtual schools for students who no longer attend online classes.” And in Pennsylvania, an article in the NY Times reports: Several current and former staff members said that a lax policy had allowed students to remain on the rolls even when they failed to log in for days. Officials of the Elizabeth Forward School District in western Pennsylvania complained that Agora had billed the district for students who were not attending. -26-
  • 27. One of them was a girl who had missed 55 days but was still on the school’s roster, according to Margaret Boucher, assistant business manager at Elizabeth Forward My presentation documents numerous similar reports. K12 Appears to Be Violating State Laws and IRS Regulations Regarding Nonprofits Of the 42 states (and DC) that permit charter schools, most will only grant charters to nonprofit 501(c)(3) entities, for which the IRS code states: “none of its earnings may inure to any private shareholder and individual.” This presents a vexing problem for K12, but it gets around this by signing long-term contracts with local nonprofit entities to provide management and other services. While this type of arrangement doesn’t technically violate IRS regulations – nonprofits contact with for-profit businesses all the time – it’s critical that the nonprofit be a truly independent entity with an independent board of directors looking out solely for the nonprofit mission of the organization. This doesn’t appear to be happening with many of the nonprofit charter schools K12 contracts with. Rather, the relationship is often so rife with conflicts and self-dealing that K12 effectively controls and operates the schools – and siphons off all of the profits for itself. Consider that:      K12 employees sometimes serve on the board of the nonprofits and, worse yet, are sometimes involved with their very creation. (One person told me that “Many of these nonprofit boards are tiny, clueless, dysfunctional, and have K12 employees on them.”) Contracts are often awarded to K12 without competitive bidding. K12 usually directly or indirectly employs all key people, including the Treasurer – a particularly blatant conflict of interest. K12 often reviews its own billings and then fails to provide the boards with detailed accounting for its expenditures. The contract with K12 typically results in the nonprofit entity reporting minimal “profits” or, often, a loss, which K12 then “forgives” (in its latest 10K, K12 notes that: “We take responsibility for any operating deficits incurred at most of the Managed Public Schools we serve.”). Jeff Shaw of the Ohio Virtual Academy told me: It was rather obvious to me as Head of School that K12 wasn’t always interested in reducing the non-profits’ expenses if those savings would impact the bottom line for K12. K12 assumed control of most of the OHVA budget and a majority of any excess funds was soaked up by the end of the year, often to the point where the school would show a loss. In this case, the agreement with K12 required them to issue a credit for management fees so OHVA would show a small surplus for the fiscal year. The volunteer governing boards assume a limited role in the school’s overall governance. The boards tend to put their faith in K12 and count on it to do what is in the school’s best interest. A Head of School walks a fine line in order to balance the best interests of both parties. In many cases, the boards know only what K12 wants them to know. It’s like the fox guarding the henhouse. -27-
  • 28. For an in-depth expose of how this works at a K12-affiliated school in Newark, see this article in the Newark Star-Ledger last week: Newark charter school contract with K12 Inc. shows influence of for-profit companies in public schools. In summary, many of these nonprofits are a sham. For all intents and purposes, K12 controls, operates, and profits from the supposedly nonprofit charter schools, in blatant violation of most states’ laws and IRS regulations. The IRS appears to be looking into this (click here). If it acts, the consequences could be dire for K12. K12’s Political and Lobbying Prowess In light of so many red flags around K12, one might ask why states haven’t acted more quickly and forcefully to rein in the company. There are many answers, but the most important is money and politics. One person I spoke with told me that in many states, “the Republican legislatures are bought and paid for” by K12. And the New York Times reported that: “An analysis by the National Institute on Money in State Politics concluded that K12 and its employees contributed nearly $500,000 to state political candidates across the country from 2004 to 2010.” But this vastly understates what K12 is really spending. Consider Pennsylvania, home to K12’s Agora Cyber Charter School and the nation’s largest online charter school sector, with 16 schools and 35,000 students. The Auditor General has released two scathing reports (click here and here), calling for a 35% funding cut, because “PA spends about…$3,500 more per student to educate a child in a cyber charter school compared to the national average, which adds up to $315 million in annual savings.” Yet the legislature hasn’t acted. Why? Perhaps it’s because, as the New York Times reported, in Pennsylvania K12: Has spent $681,000 on lobbying since 2007. The company also has friends in high places. Charles Zogby, the state’s budget secretary, had been senior vice president of education and policy for K12. In a statement, Mr. Zogby said he still owned a small number of K12 shares, but did not make decisions specifically affecting online schools. However, increased scrutiny of PA online schools could result from a federal indictment of the founder and former CEO of Pennsylvania’s largest online charter school, who is alleged to have stolen nearly $1 million in public money and improperly diverted a total of $8 million to avoid federal income taxes. In my presentation, I document similar tales of K12’s political influence in Tennessee, Ohio, Massachusetts, Idaho and Maine. K12 Is Encountering Regulatory Problems Across the Country Despite its political influence, however, K12 is increasingly unable to hide its bad acts and terrible results, so it’s beginning to encounter more and more regulatory problems across the country. In Tennessee, for example, after the off-the-charts-bad results noted above, state -28-
  • 29. Education Commissioner Kevin Huffman declared the Tennessee Virtual Academy’s results “unacceptable” and demanded “an immediate turnaround”, and the state turned down K12’s application to open a second school in the state. And parents are figuring it out as well, as enrollment has plunged by two thirds. K12 is also facing scrutiny in Florida and Georgia, where investigations (click here and here) revealed K12 employees covering up the illegal use of uncertified teachers, and class sizes of up to 275 students. And in Colorado, K12 is scrambling to launch a new school after getting hit with a double whammy: the board of the Colorado Virtual Academy has fired K12, and the district that hosted the school has said it won’t renew COVA’s authorization. Local media (click here and here) reported that “the school’s 22 percent graduation rate, high student turnover and questions about COVA’s management company, K12 Inc., originally led district staff to recommend denying the virtual school’s multiyear charter application.” Lastly, K12 was denied online schools recently in New Jersey, North Carolina and Maine, which means that K12 is not opening schools in any new states in the next year. This is the growth story that justifies a 46x P/E on this stock??? Public Policy Recommendations States are responding to the online charter school sector having run amok by adopting one or more of the following changes, none of which are aimed specifically at K12, but all of which have deleterious consequences for the company: 1) A full moratorium on any new cyber charters and/or cap limits on existing ones. 2) Cut funding to cyber charters to levels below that of bricks-and-mortar charters. 3) Improved accountability systems for all public schools (e.g., every school receives an AF grade). 4) “Default closure provisions” for all charter schools so, for example, if a school is in the bottom 25% of all charters in the state, it automatically won’t get its charter renewed. Or, if a school gets an F for two or three consecutive years, it’s automatically closed (though there’s usually an appeals process). This applies to all charter schools, but would disproportionately affect the low-performing online schools. 5) Improved practices for charter school authorizers, especially getting rid of rogue authorizers. 6) Prevent charters from district/authorizer shopping. I actually think the most elegant solution would be to let online charters pick and choose their students, and then tie a meaningful portion of what they are paid to each student’s successful completion of a course and demonstrating proficiency/growth. This would incent schools to help students succeed and penalize them for enrolling those unlikely to succeed. (Note that states would have to change their rules to allow this, as most have laws that prevent any charter from being selective.) The result would be online charters only serving a small fraction of the students they do now – which would be a very good thing. -29-
  • 30. K12 Needs to Shrink I don’t believe that K12 should go out of business. As I noted at the beginning of this article, the company has a strong curriculum and online schools can be appropriate for certain students. But K12 clearly needs to shrink substantially in order to properly serve students and states/taxpayers – which is exactly what happened to many for-profit colleges in recent years. Jeff Shaw of the Ohio Virtual Academy said it well when he told me: I can’t see how K12 can get significant increases in student academic growth under their current model. They need to say, “Let’s not focus on growth – let’s first get the academics right and then look into growing in a controlled fashion so as not to sacrifice student achievement for growth. If student really achieve, the company will grow for the right reasons. Why would anyone in their right mind sacrifice student achievement for company growth? Those of us at the school level sometimes felt as though Ron Packard was charging ahead full speed to grow, grow, grow and not focusing on long-term sustainability and student achievement. This kind of thinking hurts students. If you enroll students who clearly are not appropriate for the virtual school setting, you’re doing that student a terrible disservice. You have sacrificed a real person for your own economic gain. And I think that’s immoral and unethical. K12’s managed schools are public schools. Every student has a right to attend, but as education professionals we have a responsibility to see that students are enrolled in a school most appropriate for their needs. In the end, it’s the parents and students who make the ultimate decision regarding what school they attend. Our obligation as professionals is to present them with the realities of virtual schooling and how this school choice option may or may not be the best choice. The profit motive should not guide this process – but at K12 it appeared to. There’s a good case in Colorado of how shrinking a school can lead to better outcomes for students, as this article documents: One of Colorado’s oldest online programs, Branson Online School, is also its highest-performing. But to get there, the school had to cut back. In 2005, the Branson school district on Colorado’s southeastern border with New Mexico ran the state’s third-largest online school, enrolling more than 1,000 students. By 2010, the school had dropped back to sixth in size, enrolling 427 students. Branson assistant superintendent Judith Stokes, who oversees the online school, said the growth and lagging scores – combined with a critical 2006 state audit of online programs – prompted the ranching community’s school board to slow down. “We had grown very, very rapidly at one time, before the audit, and at that point, we pulled back,” she said. Stokes said growth slowed when the school focused on ensuring families understood the online program before enrolling because, “If you’re looking for easy, it’s not us.” -30-
  • 31. In spring 2011, Branson online students beat the statewide average in proficiency in reading and were six percentage points short in math. Conclusions and Catalysts K12 is pursuing a growth-at-any-cost strategy that is harming countless students, likely violating numerous state and federal laws and regulations, and wasting hundreds of millions of dollars of taxpayer money every year. What the company is doing is becoming increasingly well-known so states – and possibly the IRS – are waking up and thus the company faces increased regulatory risks. The likely result is that K12 will not only miss its growth projections (analysts project that K12’s revenues and profits will grow 16% and 32%, respectively, in the next year), but will actually have to shrink substantially in order to properly serve students (and states/taxpayers). A possible short-term catalyst is that the company could disappoint when it issues FY 2014 guidance in mid-October and/or when it reports Q1 ‘14 earnings in early November because growth has been slowing, preliminary enrollment data I’ve seen for a few schools are weak, and analysts seem to be factoring in rising margins and continued growth in revenue per student, both of which I think are unlikely. Trading at 46x trailing earnings and 35x next year’s estimates, K12’s stock is priced for perfection, yet its future is likely to be far from perfect. Addendum Since I made my presentation public last week, I am even more certain that my analysis of K12 is correct thanks to comments like these from people I know:    “I met with Ron Packard years ago and could tell his motivations had little to do with kids, everything to do with manipulating state regulation to protect his interests. I started digging into the results, the business model, the organization, and discovered much of what you lay out in detail in your presentation. As I said, they are terrible and epitomize everything that we should be working against in the ed-reform movement.” “I know the company very well and your presentation rings true. They have a well-deserved terrible reputation.” “You’re totally right about K12 and, on top of it, they lie all the time. It’s naïve to trust anything they say. So I’m not sure if their schools can be fixed, at least under the company’s current leadership. There’s no such thing as a successful online school in the entire country. To be sure, it works well for some students, but I’d guess only 15% of the ones cyber charters are currently serving.” Finally, lest you think I’m just talking my book for a quick trade, it won’t take you long to verify that’s not how I operate. Agree or disagree with me, my views are based on the company’s fundamentals and are genuinely held, irrespective of my funds’ position in the stock. Also note that I am not short K12’s stock because I oppose charter schools, online education, or for-profit schools. To the contrary, as you can see from my bio, I’m a champion of new models of education, whether for profit or nonprofit, as long as they work for kids. -31-
  • 32. Appendix C Why I’m Not Covering My K12 Short Whitney Tilson 2,017 Followers October 10, 2013 http://seekingalpha.com/article/1738982-why-im-not-covering-my-k12-short “My momma always said, ‘Life was like a box of chocolates. You never know what you’re gonna get.’” – Forrest Gump That line came to mind as I was thinking about the wild turn of events the last few days vis-à-vis K12. The stock fell 38% yesterday and has been cut in half since I went public with my concerns about the company (and my funds’ short position) three weeks ago at the Value Investing Congress (I also wrote about it here on Seeking Alpha; the latest version of my K12 presentation is posted here). But let me start the story three days ago: on Monday night, I went to a dinner hosted Mayor Bloomberg at Gracie Mansion for folks attending the Education Nation conference that was going on earlier this week in NYC. One of my friends came up to me and said, “You know Ron Packard [the founder and CEO of K12] is here. Let me introduce you.” In light of what I’ve said and written very publicly about him and his company in the last three weeks, I feared an ugly confrontation so I demurred. But not long afterward, while I was talking to some other friends, she came over with Ron and introduced us. We shook hands and he said he’d read my presentation and thought I got some things wrong. I said I’d love to hear what and we started talking. And talking and talking... Somebody gave a speech – and we kept talking. Then some performers sang – and we moved to the side of the tent and kept talking. The party ended, everyone left, the crew folded up all the tables, and the clock struck midnight (3 ½ hours later) – and we kept talking. We figured they were going to kick us out, so we left and walked a few blocks up to the corner of 88th and Lex – and kept talking. Finally, at about 12:45am, my worried wife called me and said, “Where are you?!” I said, “You’re never going to believe who I’m standing here talking to…” So after 4 ½ hours, we both hopped into cabs and went our respective ways. I have been shorting stocks for over a decade and have gone public with my short thesis on a handful of occasions and, as a result, have been sued, deposed, subpoenaed and investigated (there are good reasons why very few short sellers ever speak publicly) – but I can’t recall the CEO of a company I’m short being willing to engage in a lengthy, frank conversation like Ron -32-
  • 33. and I had on Monday. (My only similar experience was when Reed Hastings published a response in Seeking Alpha to my article in December 2010 in which I detailed why I was short Netflix at that time; after the stock collapsed, I went long it and still hold it – it’s been one of my best investments ever.) I want to respect the privacy of our conversation, so I’m not going to detail what Ron said, but do want share some of my thoughts. First, I liked Ron. I found him very personable, I think he honestly believed everything he said to me, he didn’t get angry or defensive when I pushed him on some pretty tough stuff I’ve heard and written about K12, and we have a lot in common: early in our careers, he was at McKinsey and I was at BCG; we’re both interested in stock picking (long and short); and of course we’re both passionate about improving and reforming education and the role technology can play. I think Ron is an incredible visionary and entrepreneur, and he’s built an important and innovative company. I now see that there’s a lot of good in K12. Before I met Ron, I thought he and the other leaders of K12 were deliberately targeting and enrolling kids they knew were certain to fail in order to maximize their revenue, run their stock price up, and make a few more millions for themselves. I no longer believe this about Ron. I think he wants to do right by kids and that, if given the option of taking a student he knew wouldn’t be successful at a K12 school, but would be highly profitable for the company, he wouldn’t want that student. He believes – and I think he’s right – that there’s lots of room for the company to grow for a long time serving only students who will benefit from a K12 school. So I don’t think there was ever a meeting at K12 in which the company decided to pursue maximum growth at any cost, even if it resulted in a lot of kids enrolling who were highly likely to fail and suffer a major educational setback. Yet even if it wasn’t intended, that’s exactly what I’m convinced is happening right now for a meaningful percentage of K12’s students (I’ve heard estimates as high as 85%, based on the very low number of K12 students who are demonstrating proficiency). I think that a number years ago (coinciding, not coincidentally, with the company going public in late 2007), K12, in balancing its desire for growth vs. doing right by kids, let that balance get way out of whack. I’ve seen it happen at countless companies – the board and management team get on a treadmill of scrambling to meet analyst expectations every quarter, they start to think (albeit perhaps subconsciously) that it’s their job to keep the stock price up, and they start doing all sorts of unnatural, short-term-oriented, unethical and, in the worst case, illegal things to keep the game going. Fueling this is the genuine passion Ron and others at K12 have for online education. They have a missionary’s zeal to make it available to the world, which is great, but I also think that blinds them to the reality (as I see it) that a full-time online school is a terrible educational option for the majority of students, especially at-risk ones. Thus, I think it’s incumbent upon K12 to do its absolute level best to enroll only those students for whom one of its schools is the best option. -33-
  • 34. Ron said that K12 is already taking steps to ensure this (and perhaps the tepid FY 2014 guidance the company issued last night in part reflects this), but I’m 100% certain that there’s a lot more that K12 can and should be doing. So with the stock down so much, am I covering my short? In a word: No. In light of the new guidance (which, while below expectations, still showed enrollment growth of 5.7% year over year), I don’t think K12 has come to grips with the reality that it doesn’t just need to slow its growth, but must actually shrink its enrollment – and not by a little, but by a lot – to weed out the students who are not appropriate for a full-time online school and thus are not engaging or succeeding. Instead, my read of K12’s recent press release is that it’s doing what most companies in this situation do – deny reality, rip the Band Aid off slowly, and prolong the pain. What K12 really needs to do is come clean with all of its stakeholders (students, parents, investors, employees, regulators, legislators, etc.) and say something like: While we didn’t intend to do so, we grew too fast in recent years, resulting in many students enrolling in K12 schools who shouldn’t have. That’s not only obviously bad for those kids, but is also bad for us in the long run. Consequently, going forward, we are going to focus 100% on improving its academic outcomes, both by doing everything we can to ensure that only kids who are well positioned to succeed in a full-time online school enroll, and also by investing heavily to better serve our increasing number of at-risk students. If K12 did this, for sure its revenues and profits would fall in the next year or two and the stock would get hit (again), but I’m convinced that the company would be far more valuable in the long run. Look at what’s happened to Netflix’s stock since it stopped trying to be profitable, and look at Amazon since its inception – it’s basically never been profitable! Investors don’t care about near-term profits as long as they’re convinced that the company is a growing market leader that, once it matures, will be highly profitable down the road (sometimes even very far down the road). Once K12 takes these steps, I will cover my short – and might even go long the stock! -34-
  • 35. The T2 Accredited Fund, LP (dba the Kase Fund) (the “Fund”) commenced operations on January 1, 1999. The Fund’s investment objective is to achieve long-term after-tax capital appreciation commensurate with moderate risk, primarily by investing with a long-term perspective in a concentrated portfolio of U.S. stocks. In carrying out the Partnership’s investment objective, the Investment Manager, T2 Partners Management, LP (dba Kase Capital Management), seeks to buy stocks at a steep discount to intrinsic value such that there is low risk of capital loss and significant upside potential. The primary focus of the Investment Manager is on the long-term fortunes of the companies in the Partnership’s portfolio or which are otherwise followed by the Investment Manager, relative to the prices of their stocks. There is no assurance that any securities discussed herein will remain in Fund’s portfolio at the time you receive this report or that securities sold have not been repurchased. The securities discussed may not represent the Fund’s entire portfolio and in the aggregate may represent only a small percentage of an account’s portfolio holdings. The material presented is compiled from sources believed to be reliable and honest, but accuracy cannot be guaranteed. It should not be assumed that any of the securities transactions, holdings or sectors discussed were or will prove to be profitable, or that the investment recommendations or decisions we make in the future will be profitable or will equal the investment performance of the securities discussed herein. All recommendations within the preceding 12 months or applicable period are available upon request. Past results are no guarantee of future results and no representation is made that an investor will or is likely to achieve results similar to those shown. All investments involve risk including the loss of principal. Performance results shown are for the Kase Fund and are presented net of all fees, including management and incentive fees, brokerage commissions, administrative expenses, and other operating expenses of the Fund. Net performance includes the reinvestment of all dividends, interest, and capital gains. The fee schedule for the Investment Manager includes a 1.5% annual management fee and a 20% incentive fee allocation. For periods prior to June 1, 2004 and after July 1, 2012, the Investment Manager’s fee schedule included a 1% annual management fee and a 20% incentive fee allocation. In practice, the incentive fee is “earned” on an annual, not monthly, basis or upon a withdrawal from the Fund. Because some investors may have different fee arrangements and depending on the timing of a specific investment, net performance for an individual investor may vary from the net performance as stated herein. The return of the S&P 500 and other indices are included in the presentation. The volatility of these indices may be materially different from the volatility in the Fund. In addition, the Fund’s holdings differ significantly from the securities that comprise the indices. The indices have not been selected to represent appropriate benchmarks to compare an investor’s performance, but rather are disclosed to allow for comparison of the investor’s performance to that of certain well-known and widely recognized indices. You cannot invest directly in these indices. This document is confidential and may not be distributed without the consent of the Investment Manager and does not constitute an offer to sell or the solicitation of an offer to purchase any security or investment product. Any such offer or solicitation may only be made by means of delivery of an approved confidential offering memorandum. -35-