Download to read offline


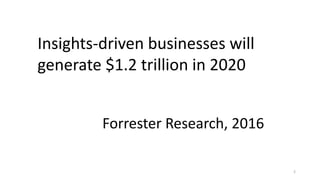
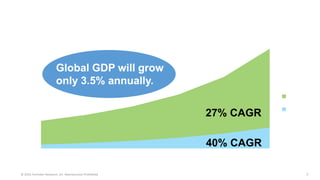
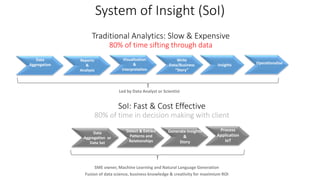


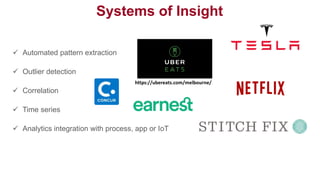


Insights-driven businesses that utilize systems of insight rather than just dashboards will generate $1.2 trillion in revenue by 2020, growing at a faster rate than other companies. Systems of insight automate the extraction of patterns from diverse data sources like social media and IoT to provide actionable insights. They reduce the time spent analyzing data and increase the time spent making decisions, reimagining business processes. Adopting systems of insight helps move beyond traditional analytics and crisis-level talent issues while minimizing data preparation efforts.