Download to read offline


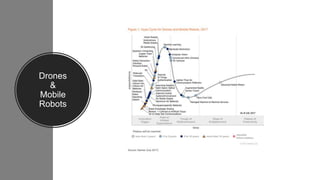
![2017 Hype Cycle for Data Science and Machine Learning,
29 July, http://www.gartner.com/document/3772081
Gartner (2017)
Strategic Predictions for 2017 and Beyond, research note
14 October, http://www.gartner.com/document/3471568
By 2020-22 :
100 million consumers shop in augmented reality
30% of web browsing sessions without a screen
Algorithms positively alter behavior of over 1B
Blockchain-based business worth $10B
IoT will save consumers/businesses $1T a year
40% of employees cut healthcare costs via fitness tracker
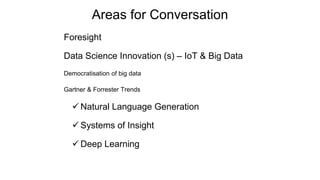
Smart Data Discovery Will Enable New Class of Citizen Data Scientist
“With the addition of NLG [Natural Language Generation], smart data discovery platforms automatically present
a written or spoken context-based narrative of findings in the data that, alongside the visualization, inform the
user about what is most important for them to act on in the data.”
Gartner, 29 June, 2015](https://image.slidesharecdn.com/foresightconversationv1-180220061857/85/Foresight-conversation-4-320.jpg)
![“With the addition of NLG [Natural Language Generation], smart data
discovery platforms automatically present a written or spoken context-based
narrative of findings in the data that, alongside the visualization, inform the
user about what is most important for them to act on in the data.”
Gartner, 29 June, 2015
Smart Data Discovery Will Enable
New Class of Citizen Data Scientist](https://image.slidesharecdn.com/foresightconversationv1-180220061857/85/Foresight-conversation-18-320.jpg)
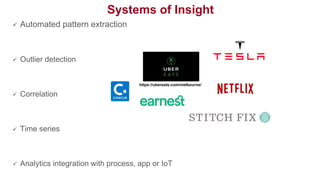
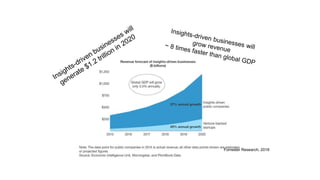
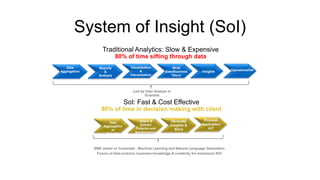


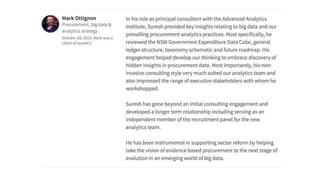
This document discusses big data, the Internet of Things (IoT), analytics, and foresight. It focuses on natural language generation, systems of insight, and deep learning. Key points include that by 2020-2022, natural language generation will be used in smart data discovery platforms to automatically present narratives summarizing findings from data. Systems of insight will enable automated pattern extraction, outlier detection, correlation analysis, and integration of analytics with processes, applications, and IoT systems. The document provides references and examples relating to big data, data science, machine learning, and the use of algorithms.


