Download to read offline


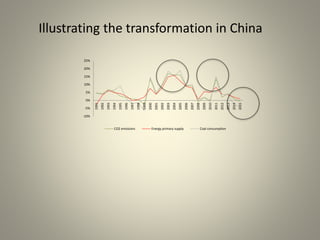
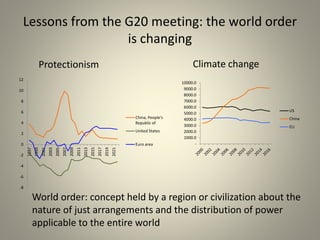
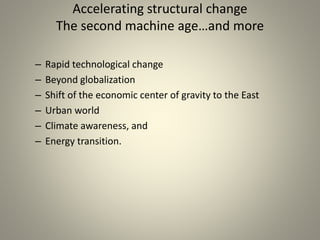
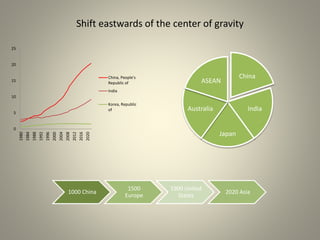
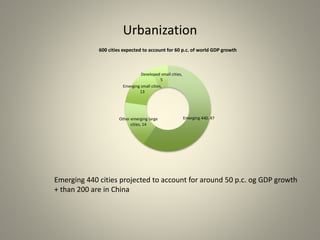
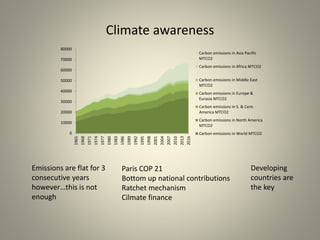
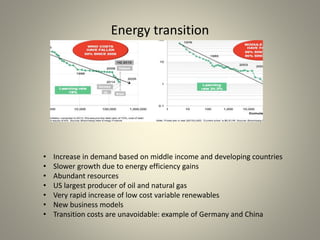

The document discusses accelerating structural changes in the early 21st century driven by technological developments and a shifting global economic landscape. Key points include: 1) Exponential growth of digital technologies is driving changes across industries and combining technologies in new ways. 2) The economic center of gravity is shifting eastwards to Asia, with China and India experiencing rapid economic growth. 3) Urbanization is increasing globally, with many emerging cities in Asia expected to be major drivers of economic growth. 4) Climate change awareness is growing as carbon emissions continue to rise globally, putting pressure on countries to transition to renewable energy.


