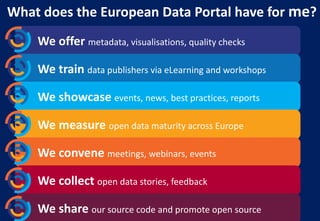
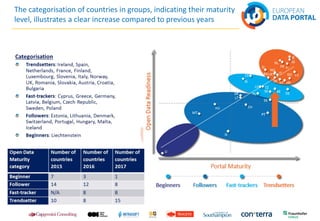
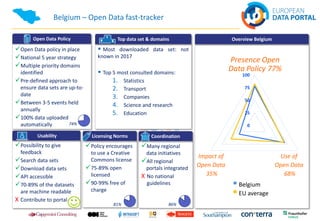
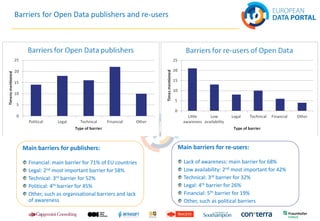
Best practices in Open Data across Europe
Special focus on Belgium
Heleen Vollers
12 March 2018, Louvain-la-Neuve, Belgium
We harvest open data
from
public administrations
across Europe
What does the European Data Portal have for me?
We offer metadata, visualisations, quality checks
We train data publishers via eLearning and workshops
We showcase events, news, best practices, reports
We measure open data maturity across Europe
We convene meetings, webinars, events
We collect open data stories, feedback
We share our source code and promote open source
The European Data Portal
- facts & figures -
810,000
datasets
Metadata in
24 Languages
34 countries
79 catalogues
The categorisation of countries in groups, indicating their maturity
level, illustrates a clear increase compared to previous years
Belgium – Open Data fast-tracker
✓Many regional
data initiatives
✓All regional
portals integrated
Χ No national
guidelines
Coordination
✓Policy encourages
to use a Creative
Commons license
✓75-89% open
licensed
✓90-99% free of
charge
Licensing Norms
Open Data Policy
✓Possibility to give
feedback
✓Search data sets
✓Download data sets
✓API accessible
✓70-89% of the datasets
are machine readable
Χ Contribute to portal
Usability
Overview Belgium
▪ Belgium
▪ EU average
Presence Open
Data Policy 77%
Use of
Open Data
68%
Impact of
Open Data
35%
▪ Most downloaded data set: not
known in 2017
▪ Top 5 most consulted domains:
1. Statistics
2. Transport
3. Companies
4. Science and research
5. Education
Top data set & domains
✓Open Data policy in place
✓National 5 year strategy
✓Multiple priority domains
identified
✓Pre-defined approach to
ensure data sets are up-to-
date
✓Between 3-5 events held
annually
✓100% data uploaded
automatically 74%
81% 86%
0
25
50
75
100
Examples how to measure Open Data – political impact
France: Publishing of money allocated to Members of
Parliament as Open Data allowing more accountability
Norway: the Grade Calculator helps make sure that a student
can get into the desired study programme without wasting time,
based on chosen subjects and grades attained
Examples how to measure Open Data – social impact
Spain: GeoSpatiumLab is a pesticide finder helps agricultural companies
and individual farmers choosing the most suitable pesticides for their
crops avoiding potential risks to human health and environment.
Finland: accessible GPS app developed for the blind and
visually impaired. BlindSquare uses Open Data of services and
places and describes the environment, announces
points of interest and street intersections as you travel.
Examples how to measure Open Data – economic impact
Ireland: The Monitor, published
free of charge on-line every
quarter, tracks developments
in the Dublin economy (2017)
Spain: detailed analysis
of the activities and impact
of the infomediary
industry (2017)
EDP: report on the economic
impact of Open Data (2015)
€ 325 Billion
Direct Market Size
2016 – 2020 for
the EU 28+
Open Data has both a direct and an indirect impact on the
economy
Indirect economic benefits are i.e. new goods and
services, time savings for users of applications
using Open Data, knowledge economy
growth, increased efficiency in public
services and growth of
related markets.
Direct benefits are monetised benefits that are
realised in market transactions in the form of
revenues and Gross Value Added (GVA),
the number of jobs involved in
producing a service or product,
and cost savings.
73%
27%
> € 1.7 Bn in
savings in Public
Administration
> 2,549
hours
wasted finding
parking
> 16% less
energy used
> 25,000 Jobs
created in Open
Data in 2020
Copyright EDP
CC BY
Open Data matters because it represents value for businesses,
citizens and public administrations
Geospatial
25.8%
Statistical
27.3%
Companies
19.5%
Top 3 Open Data domains re-used most
Clear popularity of three types of Open Data domains
Domains expected to have the highest economic impact
More data on companies requested most
Transport
Regions & Cities
Environment
Population &
Society
Top 4 combinations of Open Data categories
Regions & Cities data is often combined with the other 3
categories
On average companies use 5 categories of Open Data
36% of the companies aggregate the data, regardless of its
nature
St
Businesses see Open Data leading to innovation and efficiency as
well as a source of revenue
Selling services most important source
of revenue
Nearly half of the Open Data re-use is for
selling services
34% of these services are based on
software
25% of these services are consulting
Sources of revenue
Selling products
& services
21%
Selling services
42%
Selling
products
10%
Main benefits of working with Open Data
0% 10% 20% 50%
Innovation
Reduced costs and
increased efficiency
Data harmonisation
15%
47%
26%
6%
Reliability
6%
Enhanced business
model
40%30%
Frequency
Barriers for Open Data publishers and re-users
Figure 1: Barriers for Open Data publishers and barriers for re-users of Open Data
Main barriers for publishers:
Financial: main barrier for 71% of EU countries
Legal: 2nd most important barrier for 58%
Technical: 3rd barrier for 52%
Political: 4th barrier for 45%
Other, such as organisational barriers and lack
of awareness
Main barriers for re-users:
Lack of awareness: main barrier for 68%
Low availability: 2nd most important for 42%
Technical: 3rd barrier for 32%
Legal: 4th barrier for 26%
Financial: 5th barrier for 19%
Other, such as political barriers
Latest EDP reports
Report: Open Data and Entrepreneurship – February 2018
Report: Ensuring the economic sustainability of Open Data Portals: Understanding impact and
financing – February 2018
Report: The economic benefits of Open Data - December 2017
Report: Open Data maturity in Europe 2017 - November 2017
Report: The future of Open Data Portals - October 2017
Report: Open Data in the EU neighbourhood - July 2017
eLearning: 15 eLearning modules on Open Data – 3 new modules since July 2017 and can be
linked to your own national ODP
Report: Open Data and Cities 2 – June 2017
Report: Barriers in working with Open Data – March 2017
Report: Recommendations for Open Data Portals: from setup to sustainability – February 2017
Report: Re-using Open Data – January 2017
Go and try it out.
data.europa.eu/europeandataportal

Best practices in Open Data across Europe

  • 1.
    Best practices inOpen Data across Europe Special focus on Belgium Heleen Vollers 12 March 2018, Louvain-la-Neuve, Belgium
  • 2.
    We harvest opendata from public administrations across Europe
  • 3.
    What does theEuropean Data Portal have for me? We offer metadata, visualisations, quality checks We train data publishers via eLearning and workshops We showcase events, news, best practices, reports We measure open data maturity across Europe We convene meetings, webinars, events We collect open data stories, feedback We share our source code and promote open source
  • 4.
    The European DataPortal - facts & figures - 810,000 datasets Metadata in 24 Languages 34 countries 79 catalogues
  • 5.
    The categorisation ofcountries in groups, indicating their maturity level, illustrates a clear increase compared to previous years
  • 6.
    Belgium – OpenData fast-tracker ✓Many regional data initiatives ✓All regional portals integrated Χ No national guidelines Coordination ✓Policy encourages to use a Creative Commons license ✓75-89% open licensed ✓90-99% free of charge Licensing Norms Open Data Policy ✓Possibility to give feedback ✓Search data sets ✓Download data sets ✓API accessible ✓70-89% of the datasets are machine readable Χ Contribute to portal Usability Overview Belgium ▪ Belgium ▪ EU average Presence Open Data Policy 77% Use of Open Data 68% Impact of Open Data 35% ▪ Most downloaded data set: not known in 2017 ▪ Top 5 most consulted domains: 1. Statistics 2. Transport 3. Companies 4. Science and research 5. Education Top data set & domains ✓Open Data policy in place ✓National 5 year strategy ✓Multiple priority domains identified ✓Pre-defined approach to ensure data sets are up-to- date ✓Between 3-5 events held annually ✓100% data uploaded automatically 74% 81% 86% 0 25 50 75 100
  • 7.
    Examples how tomeasure Open Data – political impact France: Publishing of money allocated to Members of Parliament as Open Data allowing more accountability Norway: the Grade Calculator helps make sure that a student can get into the desired study programme without wasting time, based on chosen subjects and grades attained
  • 8.
    Examples how tomeasure Open Data – social impact Spain: GeoSpatiumLab is a pesticide finder helps agricultural companies and individual farmers choosing the most suitable pesticides for their crops avoiding potential risks to human health and environment. Finland: accessible GPS app developed for the blind and visually impaired. BlindSquare uses Open Data of services and places and describes the environment, announces points of interest and street intersections as you travel.
  • 9.
    Examples how tomeasure Open Data – economic impact Ireland: The Monitor, published free of charge on-line every quarter, tracks developments in the Dublin economy (2017) Spain: detailed analysis of the activities and impact of the infomediary industry (2017) EDP: report on the economic impact of Open Data (2015)
  • 10.
    € 325 Billion DirectMarket Size 2016 – 2020 for the EU 28+
  • 11.
    Open Data hasboth a direct and an indirect impact on the economy Indirect economic benefits are i.e. new goods and services, time savings for users of applications using Open Data, knowledge economy growth, increased efficiency in public services and growth of related markets. Direct benefits are monetised benefits that are realised in market transactions in the form of revenues and Gross Value Added (GVA), the number of jobs involved in producing a service or product, and cost savings. 73% 27% > € 1.7 Bn in savings in Public Administration > 2,549 hours wasted finding parking > 16% less energy used > 25,000 Jobs created in Open Data in 2020 Copyright EDP CC BY
  • 12.
    Open Data mattersbecause it represents value for businesses, citizens and public administrations Geospatial 25.8% Statistical 27.3% Companies 19.5% Top 3 Open Data domains re-used most Clear popularity of three types of Open Data domains Domains expected to have the highest economic impact More data on companies requested most Transport Regions & Cities Environment Population & Society Top 4 combinations of Open Data categories Regions & Cities data is often combined with the other 3 categories On average companies use 5 categories of Open Data 36% of the companies aggregate the data, regardless of its nature St
  • 13.
    Businesses see OpenData leading to innovation and efficiency as well as a source of revenue Selling services most important source of revenue Nearly half of the Open Data re-use is for selling services 34% of these services are based on software 25% of these services are consulting Sources of revenue Selling products & services 21% Selling services 42% Selling products 10% Main benefits of working with Open Data 0% 10% 20% 50% Innovation Reduced costs and increased efficiency Data harmonisation 15% 47% 26% 6% Reliability 6% Enhanced business model 40%30% Frequency
  • 14.
    Barriers for OpenData publishers and re-users Figure 1: Barriers for Open Data publishers and barriers for re-users of Open Data Main barriers for publishers: Financial: main barrier for 71% of EU countries Legal: 2nd most important barrier for 58% Technical: 3rd barrier for 52% Political: 4th barrier for 45% Other, such as organisational barriers and lack of awareness Main barriers for re-users: Lack of awareness: main barrier for 68% Low availability: 2nd most important for 42% Technical: 3rd barrier for 32% Legal: 4th barrier for 26% Financial: 5th barrier for 19% Other, such as political barriers
  • 15.
    Latest EDP reports Report:Open Data and Entrepreneurship – February 2018 Report: Ensuring the economic sustainability of Open Data Portals: Understanding impact and financing – February 2018 Report: The economic benefits of Open Data - December 2017 Report: Open Data maturity in Europe 2017 - November 2017 Report: The future of Open Data Portals - October 2017 Report: Open Data in the EU neighbourhood - July 2017 eLearning: 15 eLearning modules on Open Data – 3 new modules since July 2017 and can be linked to your own national ODP Report: Open Data and Cities 2 – June 2017 Report: Barriers in working with Open Data – March 2017 Report: Recommendations for Open Data Portals: from setup to sustainability – February 2017 Report: Re-using Open Data – January 2017
  • 16.
    Go and tryit out. data.europa.eu/europeandataportal