Download as PDF, PPTX


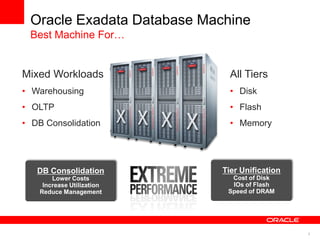
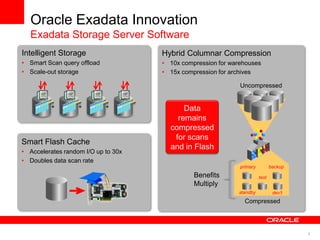

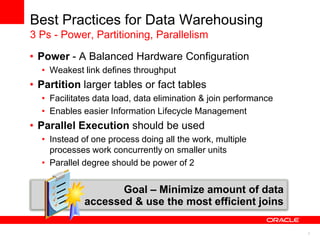
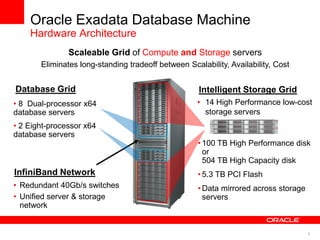
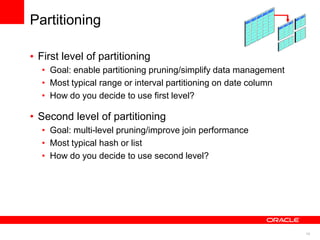
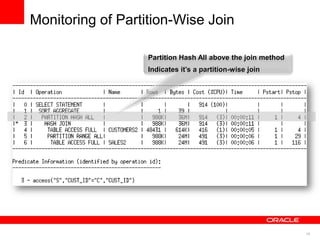
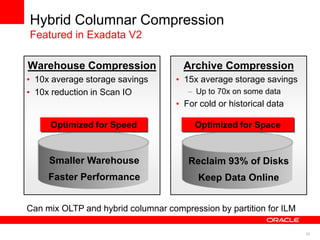
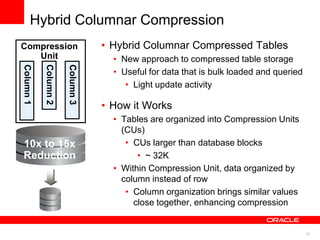
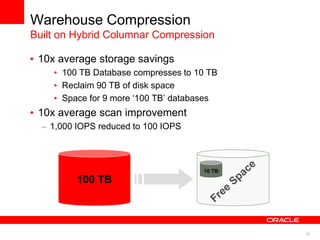
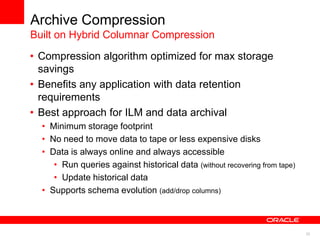
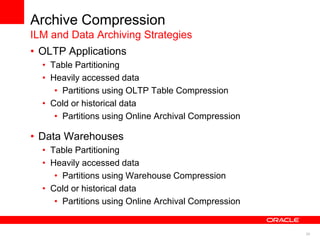
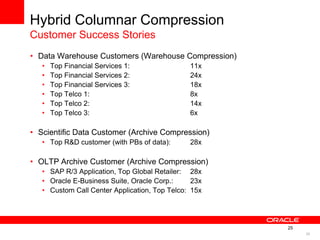
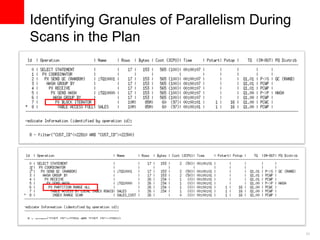
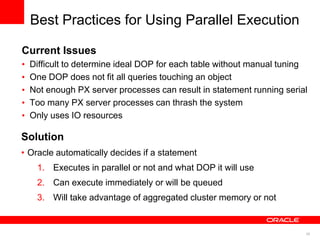
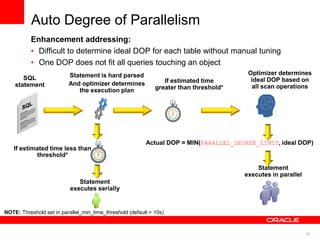
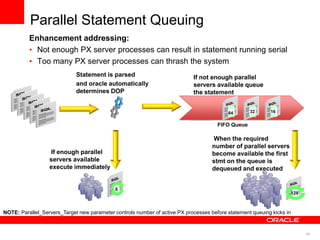
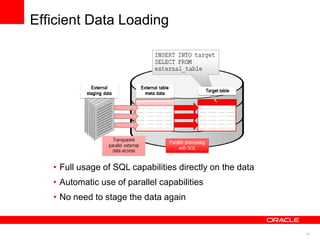
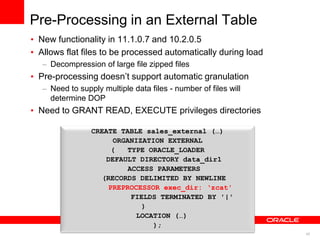
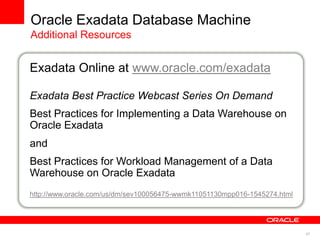

The document discusses best practices for data warehousing performance on Oracle Database. It covers using Oracle Exadata Database Machine for mixed workloads including data warehousing. Key strategies discussed are partitioning tables for pruning and parallelism, using hybrid columnar compression for storage savings and faster scans, and enabling auto parallelism and queuing for optimal parallel query processing.


![[DBA]_HiramFleitas_SQL_PASS_Summit_2017_Summary](https://cdn.slidesharecdn.com/ss_thumbnails/dbahiramfleitassqlpasssummit2017summary-180202201153-thumbnail.jpg?width=640&height=640&fit=bounds)