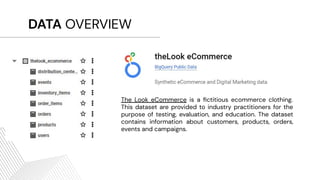
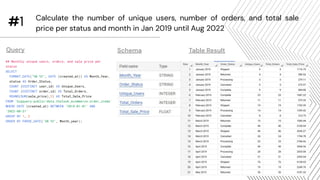
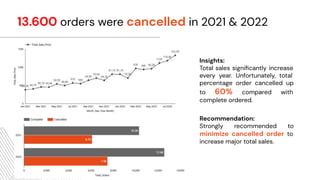
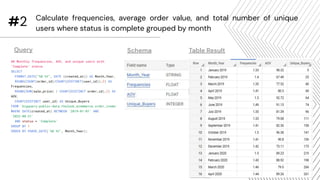
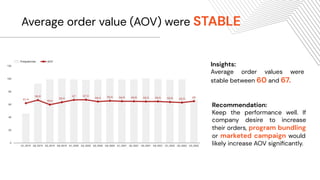
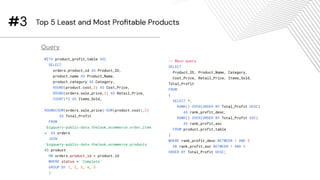
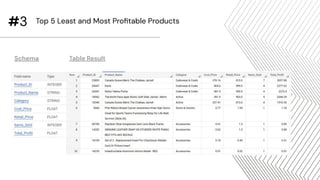
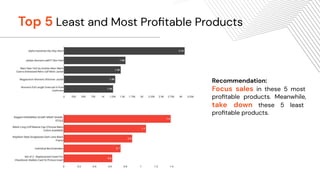
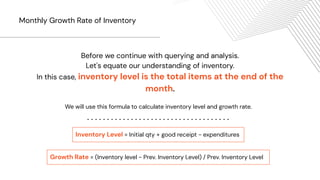
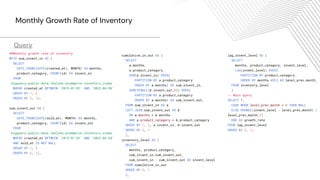
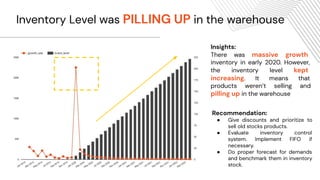
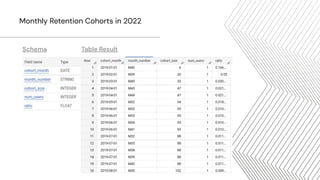
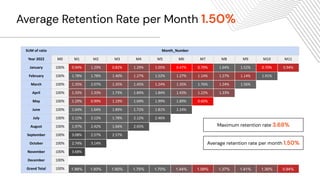
SlideShare a Scribd company logo
1 of 27
Download to read offline
DATA ANALYST
PORTFOLIO
NOUFAL ZHAFIRA
Structured Query Language
ABOUT ME
Hi, I am Noufal and I am a Data
Analyst. In this section, allow me to
give some of examples how to analyze
group of data by using Structured
Query Language (SQL). I am going to
show you simple exploratory data
analysis and some advanced analysis.
Stay tuned!!
01 02
03 04
TABLE OF CONTENTS
Data Overview
Simple
Exploratory
Data Analysis
Inventory
Stock Analysis
Cohort
Analysis
01 DATA
OVERVIEW
DATA OVERVIEW
The Look eCommerce is a fictitious ecommerce clothing.
This dataset are provided to industry practitioners for the
purpose of testing, evaluation, and education. The dataset
contains information about customers, products, orders,
events and campaigns.
Entity Relationship Diagram
In this analysis, we would only use these fives
tables for our analysis:
● users
● orders
● products
● inventory_items
● orders_items
Important!!
It is strongly recommended to visualize our
dataset by using entity relationship diagram
before we dive into analysis. By doing so, we
would able to determine correlation between
tables in dataset.
Tools
Serverless infrastructure
with a cloud-based data
warehouse and powerful
analytical tools with SQL
program language.
Visualize the data into
informative, easy to read, easy
to share, fully customizable
and share our insights.
02
EXPLORATORY
DATA
ANALYSIS
#1
Schema Table Result
## Monthly unique users, orders, and sale price per
status
SELECT
FORMAT_DATE("%B %Y", DATE (created_at)) AS Month_Year,
status AS Order_Status,
COUNT (DISTINCT user_id) AS Unique_Users,
COUNT (DISTINCT order_id) AS Total_Orders,
ROUND(SUM(sale_price),2) AS Total_Sale_Price
FROM `bigquery-public-data.thelook_ecommerce.order_items`
WHERE DATE (created_at) BETWEEN '2019-01-01' AND
'2022-08-31'
GROUP BY 1, 2
ORDER BY PARSE_DATE('%B %Y', Month_year);
Calculate the number of unique users, number of orders, and total sale
price per status and month in Jan 2019 until Aug 2022
Query
Insights:
Total sales significantly increase
every year. Unfortunately, total
percentage order cancelled up
to 60% compared with
complete ordered.
13.600 orders were cancelled in 2021 & 2022
Recommendation:
Strongly recommended to
minimize cancelled order to
increase major total sales.
#2
Schema Table Result
## Monthly frequencies, AOV, and unique users with
‘Complete’ status
SELECT
FORMAT_DATE("%B %Y", DATE (created_at)) AS Month_Year,
ROUND(COUNT(order_id)/COUNT(DISTINCT(user_id)),2) AS
Frequencies,
ROUND(SUM(sale_price) / COUNT(DISTINCT order_id),2) AS
AOV,
COUNT(DISTINCT user_id) AS Unique_Buyers
FROM `bigquery-public-data.thelook_ecommerce.order_items`
WHERE DATE(created_at) BETWEEN '2019-01-01' AND
'2022-08-31'
AND status = 'Complete'
GROUP BY 1
ORDER BY PARSE_DATE('%B %Y', Month_Year);
Calculate frequencies, average order value, and total number of unique
users where status is complete grouped by month
Query
Recommendation:
Keep the performance well. If
company desire to increase
their orders, program bundling
or marketed campaign would
likely increase AOV significantly.
Insights:
Average order values were
stable between 60 and 67.
Average order value (AOV) were STABLE
WITH product_profit_table AS(
SELECT
orders.product_id AS Product_ID,
product.name AS Product_Name,
product.category AS Category,
ROUND(product.cost,2) AS Cost_Price,
ROUND(orders.sale_price,2) AS Retail_Price,
COUNT(*) AS Items_Sold,
ROUND(SUM(orders.sale_price)-SUM(product.cost),2)
AS Total_Profit
FROM
`bigquery-public-data.thelook_ecommerce.order_item
s` AS orders
JOIN
`bigquery-public-data.thelook_ecommerce.products`
AS product
ON orders.product_id = product.id
WHERE status = 'Complete'
GROUP BY 1, 2, 3, 4, 5
)
#3 Top 5 Least and Most Profitable Products
Query
-- Main query
SELECT
Product_ID, Product_Name, Category,
Cost_Price, Retail_Price, Items_Sold,
Total_Profit
FROM
(
SELECT *,
RANK() OVER(ORDER BY Total_Profit DESC)
AS rank_profit_desc,
RANK() OVER(ORDER BY Total_Profit ASC)
AS rank_profit_asc
FROM product_profit_table
)
WHERE rank_profit_desc BETWEEN 1 AND 5
OR rank_profit_asc BETWEEN 1 AND 5
ORDER BY Total_Profit DESC;
#3
Schema Table Result
Top 5 Least and Most Profitable Products
Recommendation:
Focus sales in these 5 most
profitable products. Meanwhile,
take down these 5 least
profitable products.
Top 5 Least and Most Profitable Products
03
INVENTORY
STOCK
ANALYSIS
Before we continue with querying and analysis.
Let's equate our understanding of inventory.
In this case, inventory level is the total items at the end of the
month.
We will use this formula to calculate inventory level and growth rate.
Inventory Level = Initial qty + good receipt - expenditures
Growth Rate = (Inventory level - Prev. Inventory Level) / Prev. Inventory Level
Monthly Growth Rate of Inventory
##Monthly growth rate of inventory
WITH sum_invent_in AS (
SELECT
DATE_TRUNC(DATE(created_at), MONTH) AS months,
product_category, COUNT(id) AS invent_in
FROM
`bigquery-public-data.thelook_ecommerce.inventory_items`
WHERE created_at BETWEEN '2019-01-01' AND '2022-04-30'
GROUP BY 1, 2
ORDER BY 2, 1),
sum_invent_out AS (
SELECT
DATE_TRUNC(DATE(sold_at), MONTH) AS months,
product_category, COUNT(id) AS invent_out
FROM
`bigquery-public-data.thelook_ecommerce.inventory_items`
WHERE created_at BETWEEN '2019-01-01' AND '2022-04-30'
AND sold_at IS NOT NULL
GROUP BY 1, 2
ORDER BY 2, 1),
Query
cumulative_in_out AS (
SELECT
a.months,
a.product_category,
SUM(a.invent_in) OVER(
PARTITION BY a.product_category
ORDER BY a.months) AS cum_invent_in,
SUM(IFNULL(b.invent_out,0)) OVER(
PARTITION BY a.product_category
ORDER BY a.months) AS cum_invent_out,
FROM sum_invent_in AS a
LEFT JOIN sum_invent_out AS b
ON a.months = b.months
AND a.product_category = b.product_category
GROUP BY 1, 2, a.invent_in, b.invent_out
ORDER BY 2, 1
),
inventory_level AS (
SELECT
months, product_category,
cum_invent_in,cum_invent_out,
cum_invent_in - cum_invent_out AS invent_level
FROM cumulative_in_out
ORDER BY 2, 1
),
lag_invent_level AS (
SELECT
months, product_category, invent_level,
LAG(invent_level) OVER(
PARTITION BY product_category
ORDER BY months ASC) AS level_prev_month,
FROM inventory_level
)
-- Main query
SELECT *,
CASE WHEN level_prev_month = 0 THEN NULL
ELSE ROUND((invent_level - level_prev_month) /
level_prev_month,2)
END AS growth_rate
FROM lag_invent_level
ORDER BY 2, 1;
Monthly Growth Rate of Inventory
Schema Table Result
Monthly Growth Rate of Inventory
Recommendation:
● Give discounts and prioritize to
sell old stocks products.
● Evaluate inventory control
system. Implement FIFO if
necessary.
● Do proper forecast for demands
and benchmark them in inventory
stock.
Inventory Level was PILLING UP in the warehouse
Insights:
There was massive growth
inventory in early 2020. However,
the inventory level kept
increasing. It means that
products weren’t selling and
pilling up in the warehouse
04 COHORT
ANALYSIS
-- take all users' subsequent purchases after the
first month
SELECT
DATE_DIFF(EXTRACT(DATE FROM (a.created_at)),
b.cohort_month, MONTH) AS month_number,
a.user_id
FROM
`bigquery-public-data.thelook_ecommerce.orders` AS a
LEFT JOIN cohort_item AS b
ON a.user_id = b.user_id
WHERE EXTRACT(YEAR FROM created_at) = 2022
AND status = 'Complete'
GROUP BY 2, 1
),
retention_table AS (
## Monthly Retention Cohorts in 2022
WITH cohort_item AS (
-- take the first date of user made a complete purchase
SELECT
EXTRACT(DATE FROM MIN(created_at)) AS cohort_month,
user_id
FROM `bigquery-public-data.thelook_ecommerce.orders`
WHERE status = 'Complete'
GROUP BY user_id
ORDER BY cohort_month
),
cohort_size AS (
-- total users per starting month
SELECT
DATE_TRUNC(DATE(cohort_month),MONTH)AS cohort_month,
COUNT(user_id) AS num_users
FROM cohort_item
GROUP BY cohort_month
ORDER BY cohort_month
),
user_activities AS (
Monthly Retention Cohorts in 2022
Query
-- combine cohort month with subsequent months
SELECT
DATE_TRUNC(DATE(b.cohort_month), MONTH)
AS cohort_month,
CONCAT('M',c.month_number)
AS month_number,
COUNT(cohort_month) AS num_users
FROM user_activities AS c
LEFT JOIN cohort_item AS b
ON c.user_id = b.user_id
GROUP BY 1, 2
ORDER BY 1, 2
)
-- Main query
SELECT
d.cohort_month,
d.month_number,
e.num_users AS cohort_size,
d.num_users,
d.num_users/e.num_users AS ratio
FROM retention_table AS d
LEFT JOIN cohort_size AS e
ON d.cohort_month = e.cohort_month
GROUP BY 1, 2, 3, 4
ORDER BY 1, 2;
Schema Table Result
Monthly Retention Cohorts in 2022
Average Retention Rate per Month 1.50%
SUM of ratio Month_Number
Year 2022 M0 M1 M2 M3 M4 M5 M6 M7 M8 M9 M10 M11
January 100% 0.94% 1.29% 0.82% 1.29% 1.05% 0.47% 0.70% 1.64% 1.52% 0.70% 0.94%
February 100% 1.78% 1.78% 1.40% 1.27% 1.52% 1.27% 1.14% 1.27% 1.14% 1.91%
March 100% 1.35% 2.07% 1.35% 1.45% 1.24% 1.35% 1.76% 1.24% 1.56%
April 100% 1.33% 1.33% 1.73% 1.84% 1.84% 1.43% 1.22% 1.33%
May 100% 1.29% 0.99% 1.19% 1.69% 1.99% 1.89% 0.60%
June 100% 1.64% 1.64% 1.89% 1.72% 1.81% 2.24%
July 100% 2.12% 2.12% 1.78% 2.12% 2.46%
August 100% 1.97% 2.42% 1.66% 2.65%
September 100% 3.08% 2.57% 2.57%
October 100% 2.74% 3.14%
November 100% 3.68%
December 100%
Grand Total 100% 1.99% 1.93% 1.60% 1.75% 1.70% 1.44% 1.09% 1.37% 1.41% 1.30% 0.94%
Maximum retention rate 3.68%
Average retention rate per month 1.50%
Insights:
The number of customers had
decreased continuously from
January 2022 until end of the year.
It’s show by the decreasing of
purchase per customers month to
month. We can conclude that,
most of our customers do not
repeat order in our stores and
extremely low retention rate.
Monthly Retention Cohorts in 2022
Recommendation:
TheLook ecommerce needs to
improvise its customers
engagement and retention
immediately since this decrease in
activity has become a trend
(downtrend).
CREDITS: This presentation template was created by Slidesgo,
including icons by Flaticon and infographics & images by Freepik
Do you have any questions?
noufalzhafira@gmail.com
+62 821 7048 7070
https://linkedin.com/in/noufal-zhafira
THANKS
CONTACT DETAILS
ADDRESS Grogol, West Jakarta
MOBILE +62 821 7048 7070
EMAIL noufalzhafira@gmail.com
INSTAGRAM @noufalzhafira
LINKEDIN @noufalzhafira

More Related Content

Similar to Belajar SQL

RubricRubric for Assignment 5a- MetricsMaxYour PointsCommentsTop.docx
RubricRubric for Assignment 5a- MetricsMaxYour PointsCommentsTop.docxRubricRubric for Assignment 5a- MetricsMaxYour PointsCommentsTop.docx
RubricRubric for Assignment 5a- MetricsMaxYour PointsCommentsTop.docx
toddr4
 
Supercharge Strategy Execution: Performance Scorecard
Supercharge Strategy Execution: Performance ScorecardSupercharge Strategy Execution: Performance Scorecard
Supercharge Strategy Execution: Performance Scorecard
Flevy.com Best Practices
 

Similar to Belajar SQL (20)

Aligned Supply Chain Metrics
Aligned Supply Chain MetricsAligned Supply Chain Metrics
Aligned Supply Chain Metrics
 
RubricRubric for Assignment 5a- MetricsMaxYour PointsCommentsTop.docx
RubricRubric for Assignment 5a- MetricsMaxYour PointsCommentsTop.docxRubricRubric for Assignment 5a- MetricsMaxYour PointsCommentsTop.docx
RubricRubric for Assignment 5a- MetricsMaxYour PointsCommentsTop.docx
 
OM Analytics.pdf
OM Analytics.pdfOM Analytics.pdf
OM Analytics.pdf
 
IRJET- Ad-Click Prediction using Prediction Algorithm: Machine Learning Approach
IRJET- Ad-Click Prediction using Prediction Algorithm: Machine Learning ApproachIRJET- Ad-Click Prediction using Prediction Algorithm: Machine Learning Approach
IRJET- Ad-Click Prediction using Prediction Algorithm: Machine Learning Approach
 
Analytics and Information Architecture
Analytics and Information ArchitectureAnalytics and Information Architecture
Analytics and Information Architecture
 
Customer analytics. Turn big data into big value
Customer analytics. Turn big data into big valueCustomer analytics. Turn big data into big value
Customer analytics. Turn big data into big value
 
How to create an analytics dashboard (with examples).pdf
How to create an analytics dashboard (with examples).pdfHow to create an analytics dashboard (with examples).pdf
How to create an analytics dashboard (with examples).pdf
 
Report 190804110930
Report 190804110930Report 190804110930
Report 190804110930
 
Predicting Bank Customer Churn Using Classification
Predicting Bank Customer Churn Using ClassificationPredicting Bank Customer Churn Using Classification
Predicting Bank Customer Churn Using Classification
 
Marketing Pipeline Intelligence: A Dimensional Model
Marketing Pipeline Intelligence: A Dimensional ModelMarketing Pipeline Intelligence: A Dimensional Model
Marketing Pipeline Intelligence: A Dimensional Model
 
Data Modeling in Looker
Data Modeling in LookerData Modeling in Looker
Data Modeling in Looker
 
Project report aditi paul1
Project report aditi paul1Project report aditi paul1
Project report aditi paul1
 
IRJET- Prediction of Sales in Supermarket
IRJET- Prediction of Sales in SupermarketIRJET- Prediction of Sales in Supermarket
IRJET- Prediction of Sales in Supermarket
 
SAP Flexible Planning
SAP Flexible PlanningSAP Flexible Planning
SAP Flexible Planning
 
Review on Sentiment Analysis on Customer Reviews
Review on Sentiment Analysis on Customer ReviewsReview on Sentiment Analysis on Customer Reviews
Review on Sentiment Analysis on Customer Reviews
 
Key Performance Indicators [KPIs] Orientation
Key Performance Indicators [KPIs] OrientationKey Performance Indicators [KPIs] Orientation
Key Performance Indicators [KPIs] Orientation
 
02_GBS multinational Benchmarking Retail
02_GBS multinational Benchmarking Retail02_GBS multinational Benchmarking Retail
02_GBS multinational Benchmarking Retail
 
Dwbi Project
Dwbi ProjectDwbi Project
Dwbi Project
 
Supercharge Strategy Execution: Performance Scorecard
Supercharge Strategy Execution: Performance ScorecardSupercharge Strategy Execution: Performance Scorecard
Supercharge Strategy Execution: Performance Scorecard
 
Company segmentation - an approach with R
Company segmentation - an approach with RCompany segmentation - an approach with R
Company segmentation - an approach with R
 

Recently uploaded

Kisan Call Centre - To harness potential of ICT in Agriculture by answer farm...
Kisan Call Centre - To harness potential of ICT in Agriculture by answer farm...Kisan Call Centre - To harness potential of ICT in Agriculture by answer farm...
Kisan Call Centre - To harness potential of ICT in Agriculture by answer farm...
Krashi Coaching
 
Activity 01 - Artificial Culture (1).pdf
Activity 01 - Artificial Culture (1).pdfActivity 01 - Artificial Culture (1).pdf
Activity 01 - Artificial Culture (1).pdf
ciinovamais
 
The basics of sentences session 2pptx copy.pptx
The basics of sentences session 2pptx copy.pptxThe basics of sentences session 2pptx copy.pptx
The basics of sentences session 2pptx copy.pptx
heathfieldcps1
 

Recently uploaded (20)

Class 11th Physics NEET formula sheet pdf
Class 11th Physics NEET formula sheet pdfClass 11th Physics NEET formula sheet pdf
Class 11th Physics NEET formula sheet pdf
 
INDIA QUIZ 2024 RLAC DELHI UNIVERSITY.pptx
INDIA QUIZ 2024 RLAC DELHI UNIVERSITY.pptxINDIA QUIZ 2024 RLAC DELHI UNIVERSITY.pptx
INDIA QUIZ 2024 RLAC DELHI UNIVERSITY.pptx
 
The Most Excellent Way | 1 Corinthians 13
The Most Excellent Way | 1 Corinthians 13The Most Excellent Way | 1 Corinthians 13
The Most Excellent Way | 1 Corinthians 13
 
Software Engineering Methodologies (overview)
Software Engineering Methodologies (overview)Software Engineering Methodologies (overview)
Software Engineering Methodologies (overview)
 
Explore beautiful and ugly buildings. Mathematics helps us create beautiful d...
Explore beautiful and ugly buildings. Mathematics helps us create beautiful d...Explore beautiful and ugly buildings. Mathematics helps us create beautiful d...
Explore beautiful and ugly buildings. Mathematics helps us create beautiful d...
 
BAG TECHNIQUE Bag technique-a tool making use of public health bag through wh...
BAG TECHNIQUE Bag technique-a tool making use of public health bag through wh...BAG TECHNIQUE Bag technique-a tool making use of public health bag through wh...
BAG TECHNIQUE Bag technique-a tool making use of public health bag through wh...
 
Kisan Call Centre - To harness potential of ICT in Agriculture by answer farm...
Kisan Call Centre - To harness potential of ICT in Agriculture by answer farm...Kisan Call Centre - To harness potential of ICT in Agriculture by answer farm...
Kisan Call Centre - To harness potential of ICT in Agriculture by answer farm...
 
Interactive Powerpoint_How to Master effective communication
Interactive Powerpoint_How to Master effective communicationInteractive Powerpoint_How to Master effective communication
Interactive Powerpoint_How to Master effective communication
 
Measures of Dispersion and Variability: Range, QD, AD and SD
Measures of Dispersion and Variability: Range, QD, AD and SDMeasures of Dispersion and Variability: Range, QD, AD and SD
Measures of Dispersion and Variability: Range, QD, AD and SD
 
Web & Social Media Analytics Previous Year Question Paper.pdf
Web & Social Media Analytics Previous Year Question Paper.pdfWeb & Social Media Analytics Previous Year Question Paper.pdf
Web & Social Media Analytics Previous Year Question Paper.pdf
 
Presentation by Andreas Schleicher Tackling the School Absenteeism Crisis 30 ...
Presentation by Andreas Schleicher Tackling the School Absenteeism Crisis 30 ...Presentation by Andreas Schleicher Tackling the School Absenteeism Crisis 30 ...
Presentation by Andreas Schleicher Tackling the School Absenteeism Crisis 30 ...
 
Advanced Views - Calendar View in Odoo 17
Advanced Views - Calendar View in Odoo 17Advanced Views - Calendar View in Odoo 17
Advanced Views - Calendar View in Odoo 17
 
fourth grading exam for kindergarten in writing
fourth grading exam for kindergarten in writingfourth grading exam for kindergarten in writing
fourth grading exam for kindergarten in writing
 
Activity 01 - Artificial Culture (1).pdf
Activity 01 - Artificial Culture (1).pdfActivity 01 - Artificial Culture (1).pdf
Activity 01 - Artificial Culture (1).pdf
 
Introduction to Nonprofit Accounting: The Basics
Introduction to Nonprofit Accounting: The BasicsIntroduction to Nonprofit Accounting: The Basics
Introduction to Nonprofit Accounting: The Basics
 
Measures of Central Tendency: Mean, Median and Mode
Measures of Central Tendency: Mean, Median and ModeMeasures of Central Tendency: Mean, Median and Mode
Measures of Central Tendency: Mean, Median and Mode
 
The basics of sentences session 2pptx copy.pptx
The basics of sentences session 2pptx copy.pptxThe basics of sentences session 2pptx copy.pptx
The basics of sentences session 2pptx copy.pptx
 
Accessible design: Minimum effort, maximum impact
Accessible design: Minimum effort, maximum impactAccessible design: Minimum effort, maximum impact
Accessible design: Minimum effort, maximum impact
 
A Critique of the Proposed National Education Policy Reform
A Critique of the Proposed National Education Policy ReformA Critique of the Proposed National Education Policy Reform
A Critique of the Proposed National Education Policy Reform
 
Arihant handbook biology for class 11 .pdf
Arihant handbook biology for class 11 .pdfArihant handbook biology for class 11 .pdf
Arihant handbook biology for class 11 .pdf
 

Belajar SQL

  • 2. ABOUT ME Hi, I am Noufal and I am a Data Analyst. In this section, allow me to give some of examples how to analyze group of data by using Structured Query Language (SQL). I am going to show you simple exploratory data analysis and some advanced analysis. Stay tuned!!
  • 3. 01 02 03 04 TABLE OF CONTENTS Data Overview Simple Exploratory Data Analysis Inventory Stock Analysis Cohort Analysis
  • 5. DATA OVERVIEW The Look eCommerce is a fictitious ecommerce clothing. This dataset are provided to industry practitioners for the purpose of testing, evaluation, and education. The dataset contains information about customers, products, orders, events and campaigns.
  • 6. Entity Relationship Diagram In this analysis, we would only use these fives tables for our analysis: ● users ● orders ● products ● inventory_items ● orders_items Important!! It is strongly recommended to visualize our dataset by using entity relationship diagram before we dive into analysis. By doing so, we would able to determine correlation between tables in dataset.
  • 7. Tools Serverless infrastructure with a cloud-based data warehouse and powerful analytical tools with SQL program language. Visualize the data into informative, easy to read, easy to share, fully customizable and share our insights.
  • 9. #1 Schema Table Result ## Monthly unique users, orders, and sale price per status SELECT FORMAT_DATE("%B %Y", DATE (created_at)) AS Month_Year, status AS Order_Status, COUNT (DISTINCT user_id) AS Unique_Users, COUNT (DISTINCT order_id) AS Total_Orders, ROUND(SUM(sale_price),2) AS Total_Sale_Price FROM `bigquery-public-data.thelook_ecommerce.order_items` WHERE DATE (created_at) BETWEEN '2019-01-01' AND '2022-08-31' GROUP BY 1, 2 ORDER BY PARSE_DATE('%B %Y', Month_year); Calculate the number of unique users, number of orders, and total sale price per status and month in Jan 2019 until Aug 2022 Query
  • 10. Insights: Total sales significantly increase every year. Unfortunately, total percentage order cancelled up to 60% compared with complete ordered. 13.600 orders were cancelled in 2021 & 2022 Recommendation: Strongly recommended to minimize cancelled order to increase major total sales.
  • 11. #2 Schema Table Result ## Monthly frequencies, AOV, and unique users with ‘Complete’ status SELECT FORMAT_DATE("%B %Y", DATE (created_at)) AS Month_Year, ROUND(COUNT(order_id)/COUNT(DISTINCT(user_id)),2) AS Frequencies, ROUND(SUM(sale_price) / COUNT(DISTINCT order_id),2) AS AOV, COUNT(DISTINCT user_id) AS Unique_Buyers FROM `bigquery-public-data.thelook_ecommerce.order_items` WHERE DATE(created_at) BETWEEN '2019-01-01' AND '2022-08-31' AND status = 'Complete' GROUP BY 1 ORDER BY PARSE_DATE('%B %Y', Month_Year); Calculate frequencies, average order value, and total number of unique users where status is complete grouped by month Query
  • 12. Recommendation: Keep the performance well. If company desire to increase their orders, program bundling or marketed campaign would likely increase AOV significantly. Insights: Average order values were stable between 60 and 67. Average order value (AOV) were STABLE
  • 13. WITH product_profit_table AS( SELECT orders.product_id AS Product_ID, product.name AS Product_Name, product.category AS Category, ROUND(product.cost,2) AS Cost_Price, ROUND(orders.sale_price,2) AS Retail_Price, COUNT(*) AS Items_Sold, ROUND(SUM(orders.sale_price)-SUM(product.cost),2) AS Total_Profit FROM `bigquery-public-data.thelook_ecommerce.order_item s` AS orders JOIN `bigquery-public-data.thelook_ecommerce.products` AS product ON orders.product_id = product.id WHERE status = 'Complete' GROUP BY 1, 2, 3, 4, 5 ) #3 Top 5 Least and Most Profitable Products Query -- Main query SELECT Product_ID, Product_Name, Category, Cost_Price, Retail_Price, Items_Sold, Total_Profit FROM ( SELECT *, RANK() OVER(ORDER BY Total_Profit DESC) AS rank_profit_desc, RANK() OVER(ORDER BY Total_Profit ASC) AS rank_profit_asc FROM product_profit_table ) WHERE rank_profit_desc BETWEEN 1 AND 5 OR rank_profit_asc BETWEEN 1 AND 5 ORDER BY Total_Profit DESC;
  • 14. #3 Schema Table Result Top 5 Least and Most Profitable Products
  • 15. Recommendation: Focus sales in these 5 most profitable products. Meanwhile, take down these 5 least profitable products. Top 5 Least and Most Profitable Products
  • 17. Before we continue with querying and analysis. Let's equate our understanding of inventory. In this case, inventory level is the total items at the end of the month. We will use this formula to calculate inventory level and growth rate. Inventory Level = Initial qty + good receipt - expenditures Growth Rate = (Inventory level - Prev. Inventory Level) / Prev. Inventory Level Monthly Growth Rate of Inventory
  • 18. ##Monthly growth rate of inventory WITH sum_invent_in AS ( SELECT DATE_TRUNC(DATE(created_at), MONTH) AS months, product_category, COUNT(id) AS invent_in FROM `bigquery-public-data.thelook_ecommerce.inventory_items` WHERE created_at BETWEEN '2019-01-01' AND '2022-04-30' GROUP BY 1, 2 ORDER BY 2, 1), sum_invent_out AS ( SELECT DATE_TRUNC(DATE(sold_at), MONTH) AS months, product_category, COUNT(id) AS invent_out FROM `bigquery-public-data.thelook_ecommerce.inventory_items` WHERE created_at BETWEEN '2019-01-01' AND '2022-04-30' AND sold_at IS NOT NULL GROUP BY 1, 2 ORDER BY 2, 1), Query cumulative_in_out AS ( SELECT a.months, a.product_category, SUM(a.invent_in) OVER( PARTITION BY a.product_category ORDER BY a.months) AS cum_invent_in, SUM(IFNULL(b.invent_out,0)) OVER( PARTITION BY a.product_category ORDER BY a.months) AS cum_invent_out, FROM sum_invent_in AS a LEFT JOIN sum_invent_out AS b ON a.months = b.months AND a.product_category = b.product_category GROUP BY 1, 2, a.invent_in, b.invent_out ORDER BY 2, 1 ), inventory_level AS ( SELECT months, product_category, cum_invent_in,cum_invent_out, cum_invent_in - cum_invent_out AS invent_level FROM cumulative_in_out ORDER BY 2, 1 ), lag_invent_level AS ( SELECT months, product_category, invent_level, LAG(invent_level) OVER( PARTITION BY product_category ORDER BY months ASC) AS level_prev_month, FROM inventory_level ) -- Main query SELECT *, CASE WHEN level_prev_month = 0 THEN NULL ELSE ROUND((invent_level - level_prev_month) / level_prev_month,2) END AS growth_rate FROM lag_invent_level ORDER BY 2, 1; Monthly Growth Rate of Inventory
  • 19. Schema Table Result Monthly Growth Rate of Inventory
  • 20. Recommendation: ● Give discounts and prioritize to sell old stocks products. ● Evaluate inventory control system. Implement FIFO if necessary. ● Do proper forecast for demands and benchmark them in inventory stock. Inventory Level was PILLING UP in the warehouse Insights: There was massive growth inventory in early 2020. However, the inventory level kept increasing. It means that products weren’t selling and pilling up in the warehouse
  • 22. -- take all users' subsequent purchases after the first month SELECT DATE_DIFF(EXTRACT(DATE FROM (a.created_at)), b.cohort_month, MONTH) AS month_number, a.user_id FROM `bigquery-public-data.thelook_ecommerce.orders` AS a LEFT JOIN cohort_item AS b ON a.user_id = b.user_id WHERE EXTRACT(YEAR FROM created_at) = 2022 AND status = 'Complete' GROUP BY 2, 1 ), retention_table AS ( ## Monthly Retention Cohorts in 2022 WITH cohort_item AS ( -- take the first date of user made a complete purchase SELECT EXTRACT(DATE FROM MIN(created_at)) AS cohort_month, user_id FROM `bigquery-public-data.thelook_ecommerce.orders` WHERE status = 'Complete' GROUP BY user_id ORDER BY cohort_month ), cohort_size AS ( -- total users per starting month SELECT DATE_TRUNC(DATE(cohort_month),MONTH)AS cohort_month, COUNT(user_id) AS num_users FROM cohort_item GROUP BY cohort_month ORDER BY cohort_month ), user_activities AS ( Monthly Retention Cohorts in 2022 Query -- combine cohort month with subsequent months SELECT DATE_TRUNC(DATE(b.cohort_month), MONTH) AS cohort_month, CONCAT('M',c.month_number) AS month_number, COUNT(cohort_month) AS num_users FROM user_activities AS c LEFT JOIN cohort_item AS b ON c.user_id = b.user_id GROUP BY 1, 2 ORDER BY 1, 2 ) -- Main query SELECT d.cohort_month, d.month_number, e.num_users AS cohort_size, d.num_users, d.num_users/e.num_users AS ratio FROM retention_table AS d LEFT JOIN cohort_size AS e ON d.cohort_month = e.cohort_month GROUP BY 1, 2, 3, 4 ORDER BY 1, 2;
  • 23. Schema Table Result Monthly Retention Cohorts in 2022
  • 24. Average Retention Rate per Month 1.50% SUM of ratio Month_Number Year 2022 M0 M1 M2 M3 M4 M5 M6 M7 M8 M9 M10 M11 January 100% 0.94% 1.29% 0.82% 1.29% 1.05% 0.47% 0.70% 1.64% 1.52% 0.70% 0.94% February 100% 1.78% 1.78% 1.40% 1.27% 1.52% 1.27% 1.14% 1.27% 1.14% 1.91% March 100% 1.35% 2.07% 1.35% 1.45% 1.24% 1.35% 1.76% 1.24% 1.56% April 100% 1.33% 1.33% 1.73% 1.84% 1.84% 1.43% 1.22% 1.33% May 100% 1.29% 0.99% 1.19% 1.69% 1.99% 1.89% 0.60% June 100% 1.64% 1.64% 1.89% 1.72% 1.81% 2.24% July 100% 2.12% 2.12% 1.78% 2.12% 2.46% August 100% 1.97% 2.42% 1.66% 2.65% September 100% 3.08% 2.57% 2.57% October 100% 2.74% 3.14% November 100% 3.68% December 100% Grand Total 100% 1.99% 1.93% 1.60% 1.75% 1.70% 1.44% 1.09% 1.37% 1.41% 1.30% 0.94% Maximum retention rate 3.68% Average retention rate per month 1.50%
  • 25. Insights: The number of customers had decreased continuously from January 2022 until end of the year. It’s show by the decreasing of purchase per customers month to month. We can conclude that, most of our customers do not repeat order in our stores and extremely low retention rate. Monthly Retention Cohorts in 2022 Recommendation: TheLook ecommerce needs to improvise its customers engagement and retention immediately since this decrease in activity has become a trend (downtrend).
  • 26. CREDITS: This presentation template was created by Slidesgo, including icons by Flaticon and infographics & images by Freepik Do you have any questions? noufalzhafira@gmail.com +62 821 7048 7070 https://linkedin.com/in/noufal-zhafira THANKS
  • 27. CONTACT DETAILS ADDRESS Grogol, West Jakarta MOBILE +62 821 7048 7070 EMAIL noufalzhafira@gmail.com INSTAGRAM @noufalzhafira LINKEDIN @noufalzhafira