Downloaded 14 times


![• Add an event that fires if a user stays on your page over X seconds
a. setTimeout ("_gaq.push(['_trackEvent', '30_seconds', 'read'])",30000); [Google Analytics]
b. setTimeout (“ga(‘send’,’event’,’30_seconds’,read’)”,30000); [Universal Analytics]
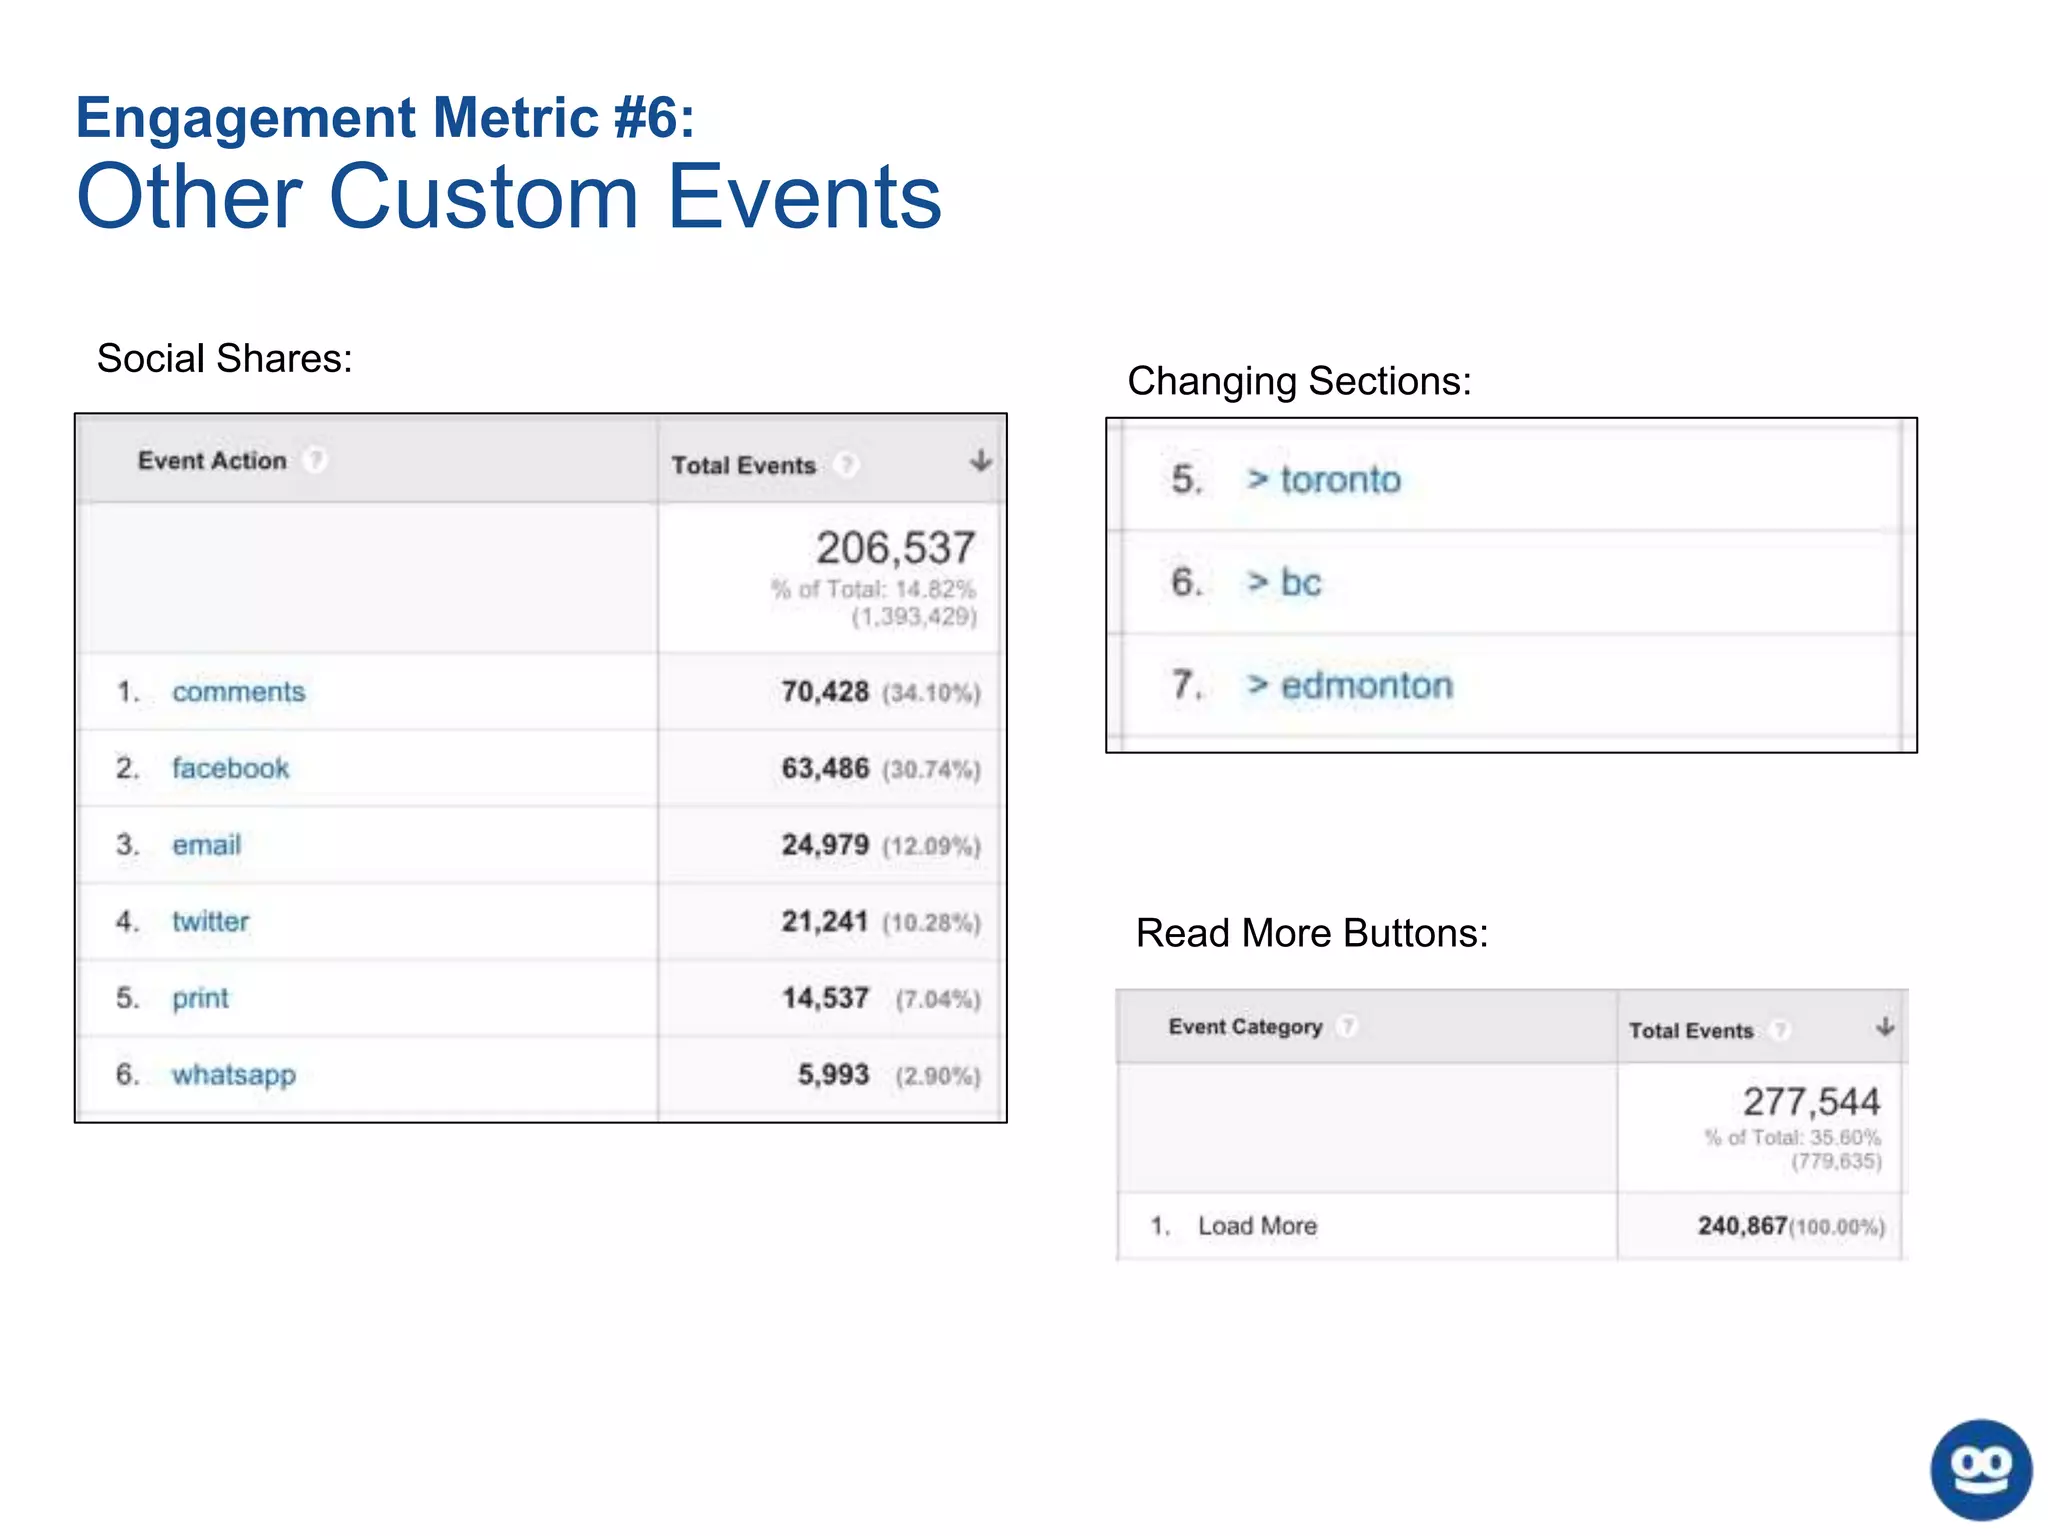
• Fire an event when social media share buttons are clicked
• Track video plays, or interaction with any other media, with an event
• If you use infinite scroll or any other form of continuous consumption, make
sure you’re accurately tracking page views on the second piece of content
Modifying Your Analytics Setup to
Track a More Useful “Bounce
Rate”](https://image.slidesharecdn.com/webinar-measuringengagementuk-160311185144/75/Behind-the-Bounce-Understanding-Metrics-and-Engagement-9-2048.jpg)


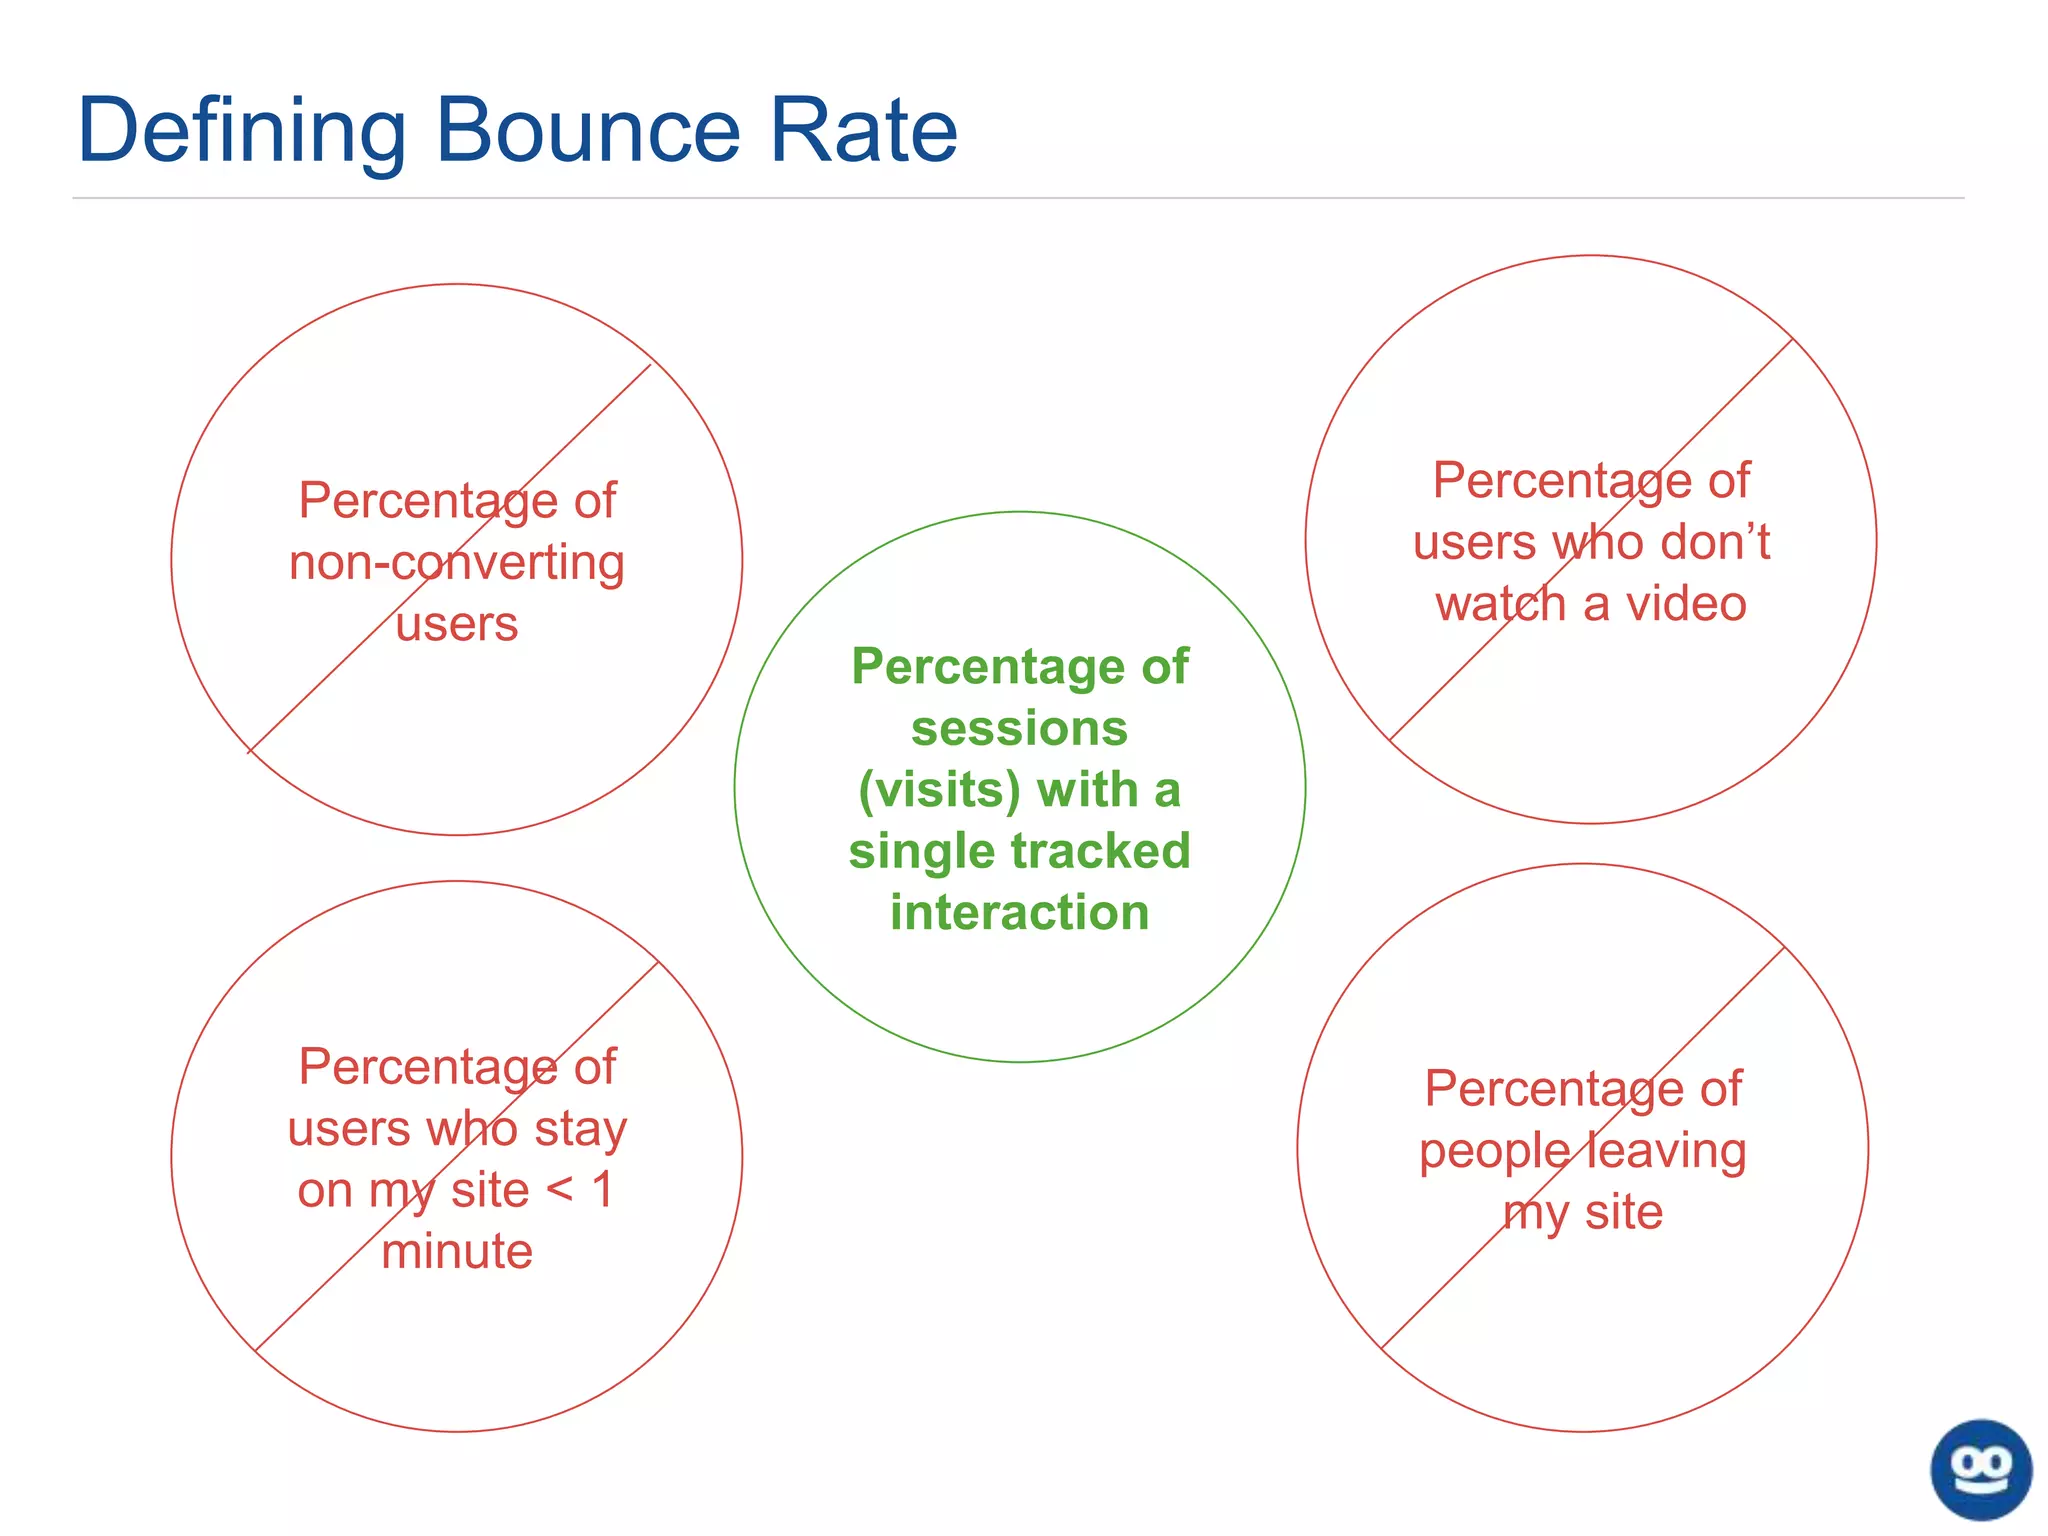
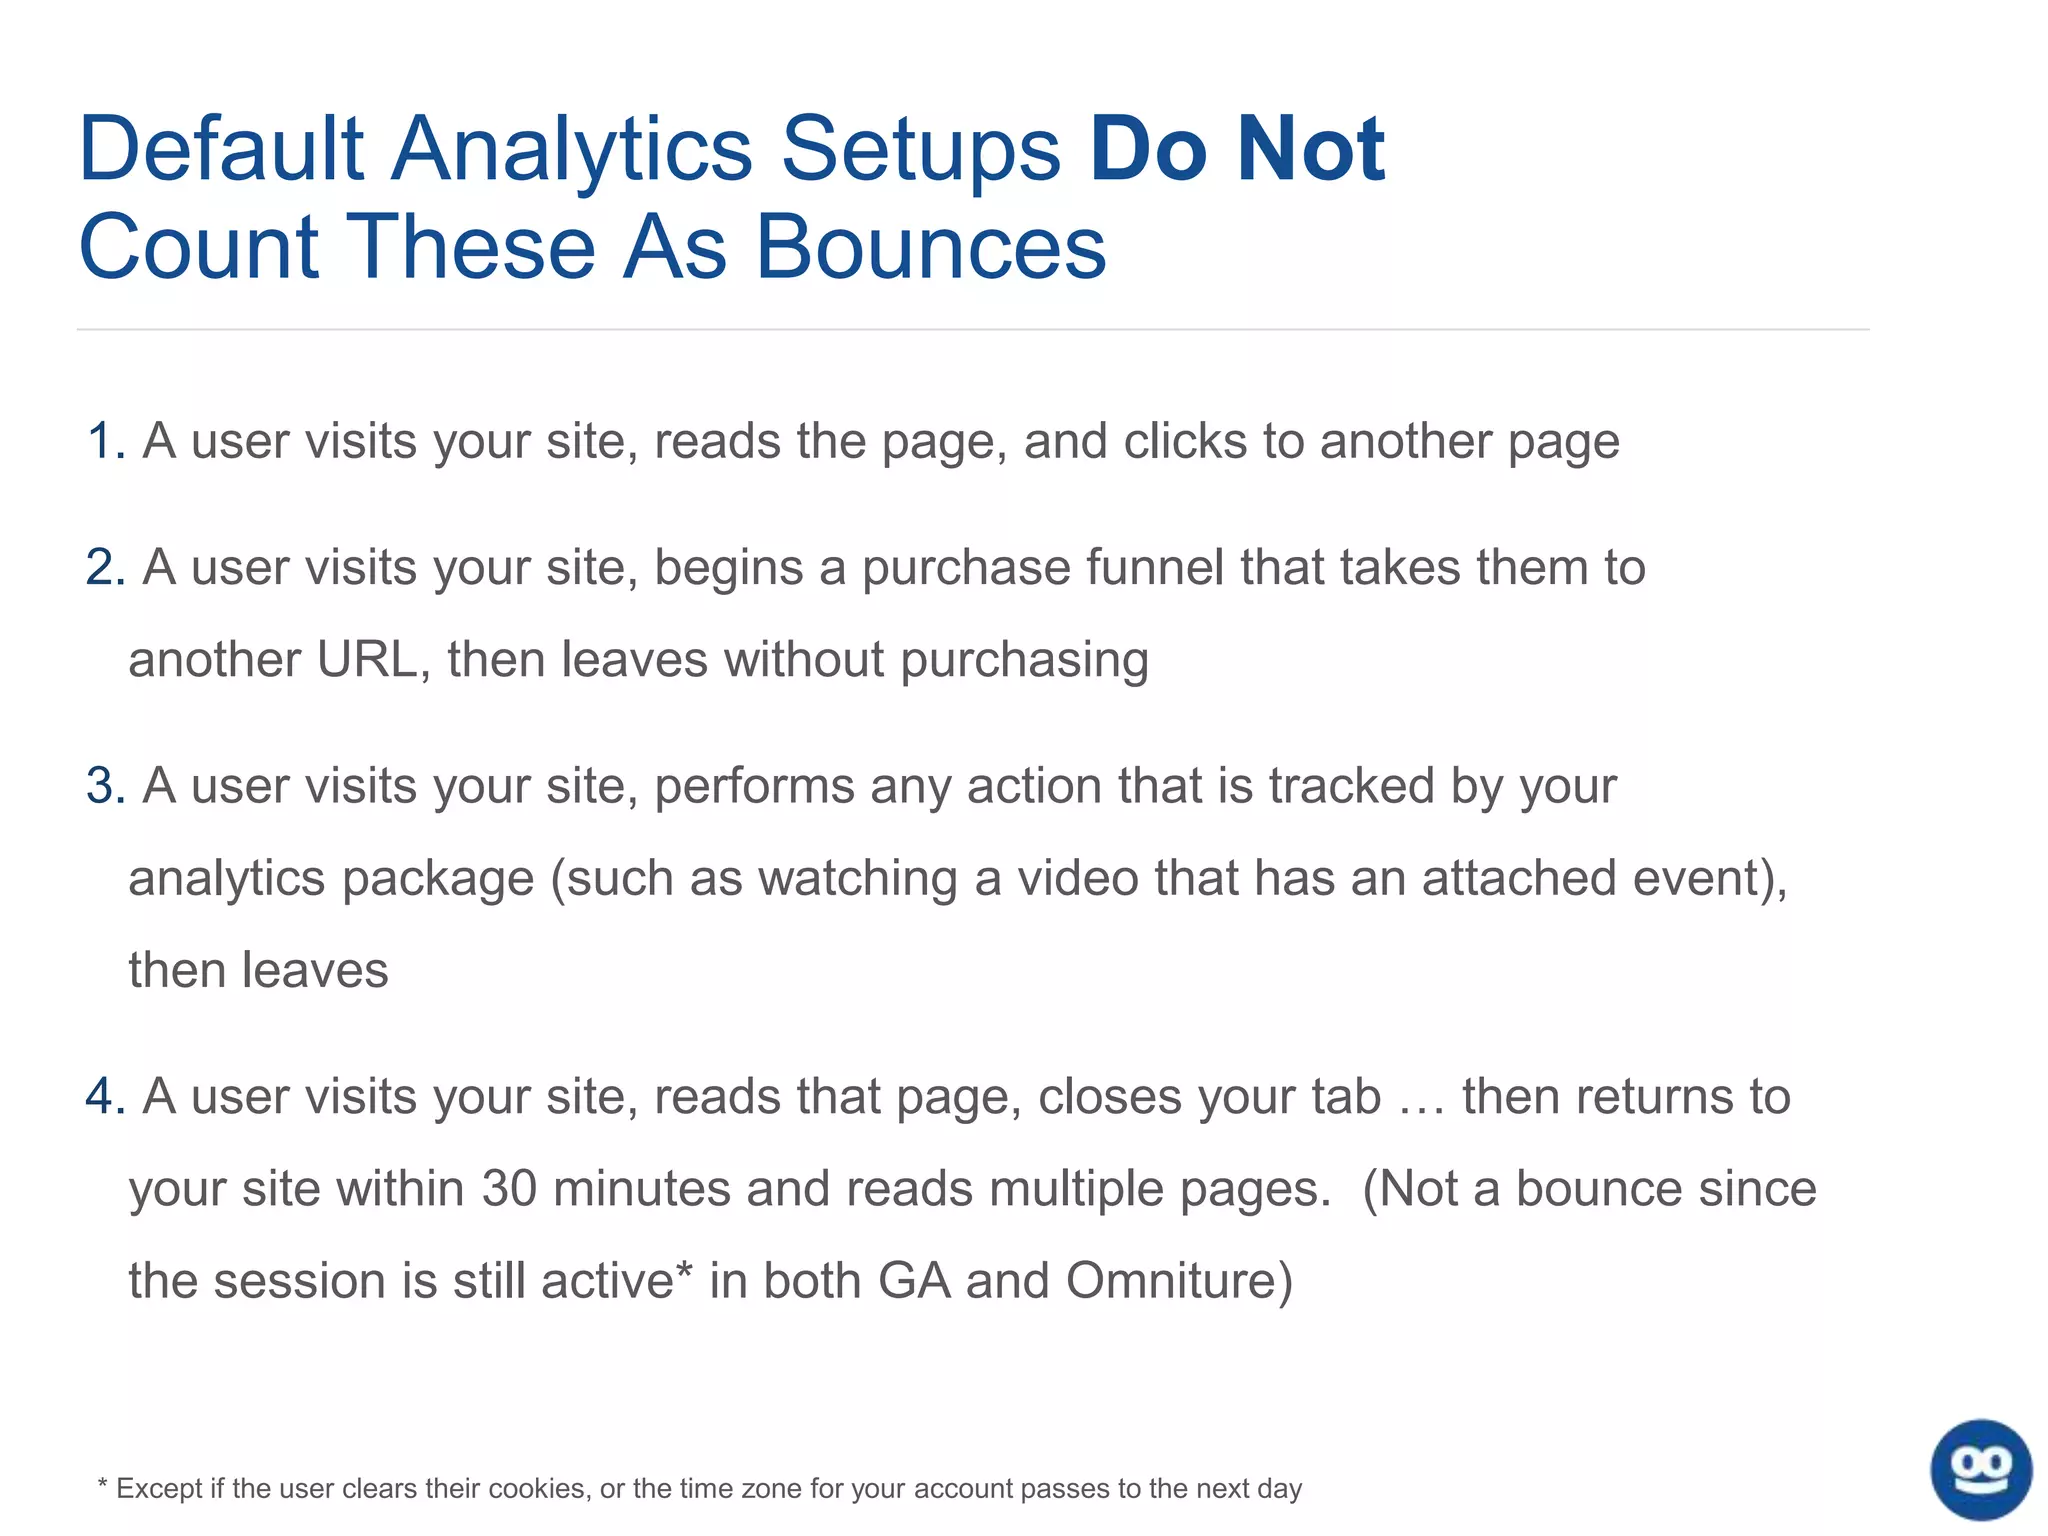
The document discusses the concept of bounce rate in digital analytics, explaining how it is calculated and commonly misunderstood. It emphasizes the importance of tracking more meaningful engagement metrics beyond just bounce rate to better understand user interaction with content. Additionally, the document provides recommendations for modifying analytics setups to more accurately capture user engagement and influence on traffic sources.


