Download to read offline

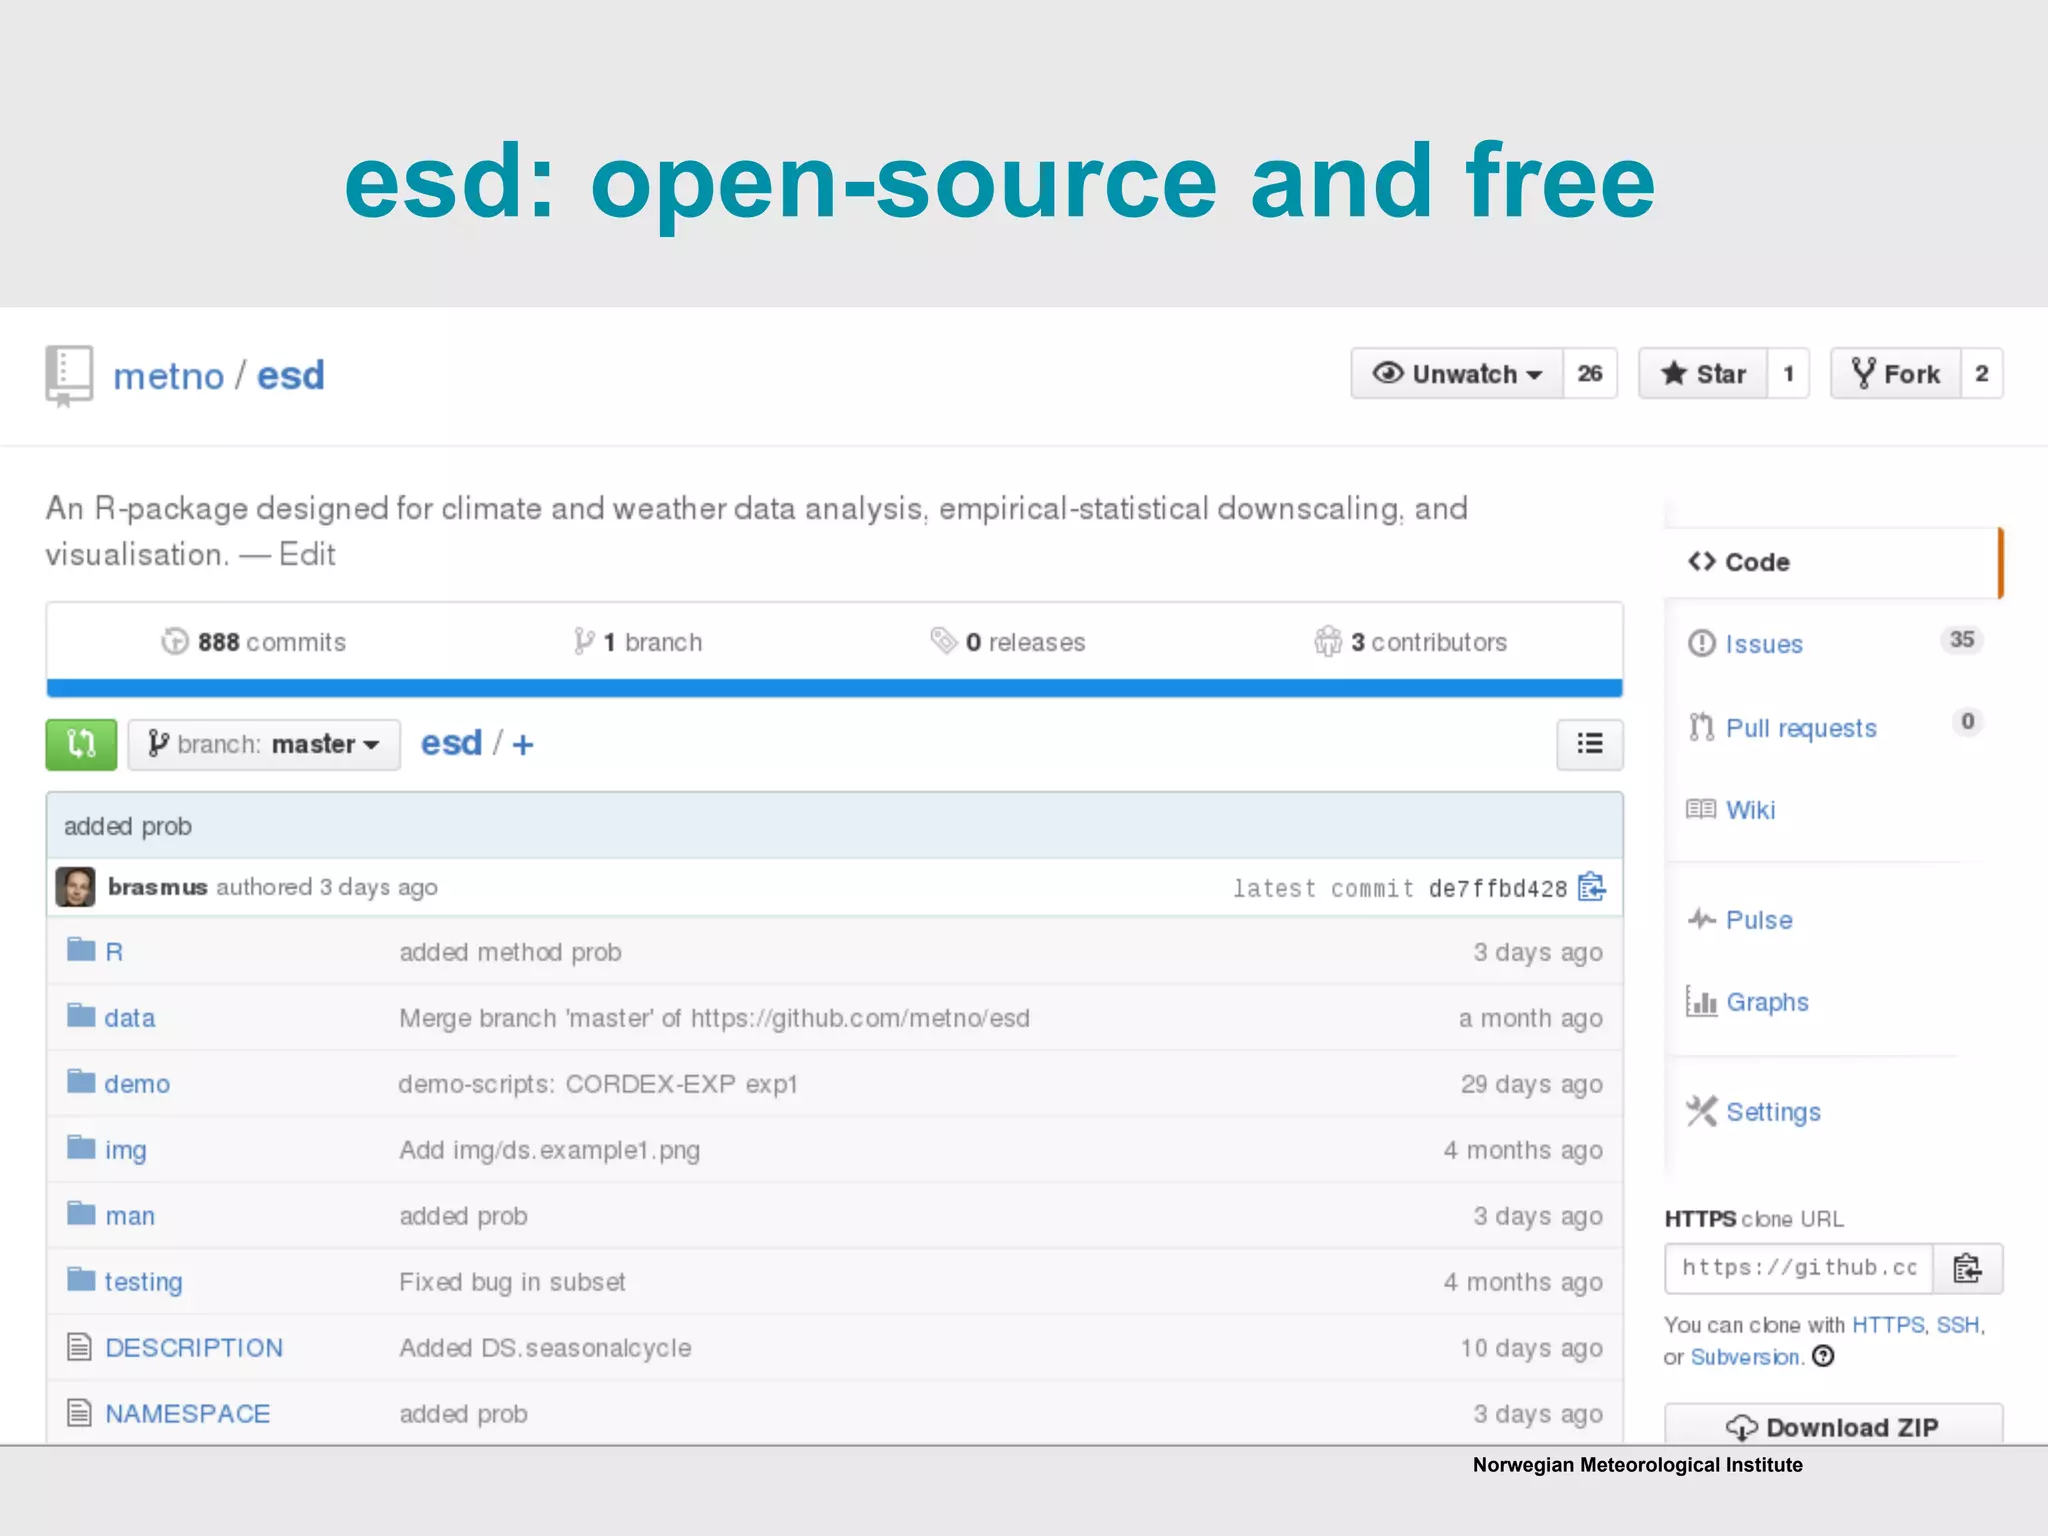

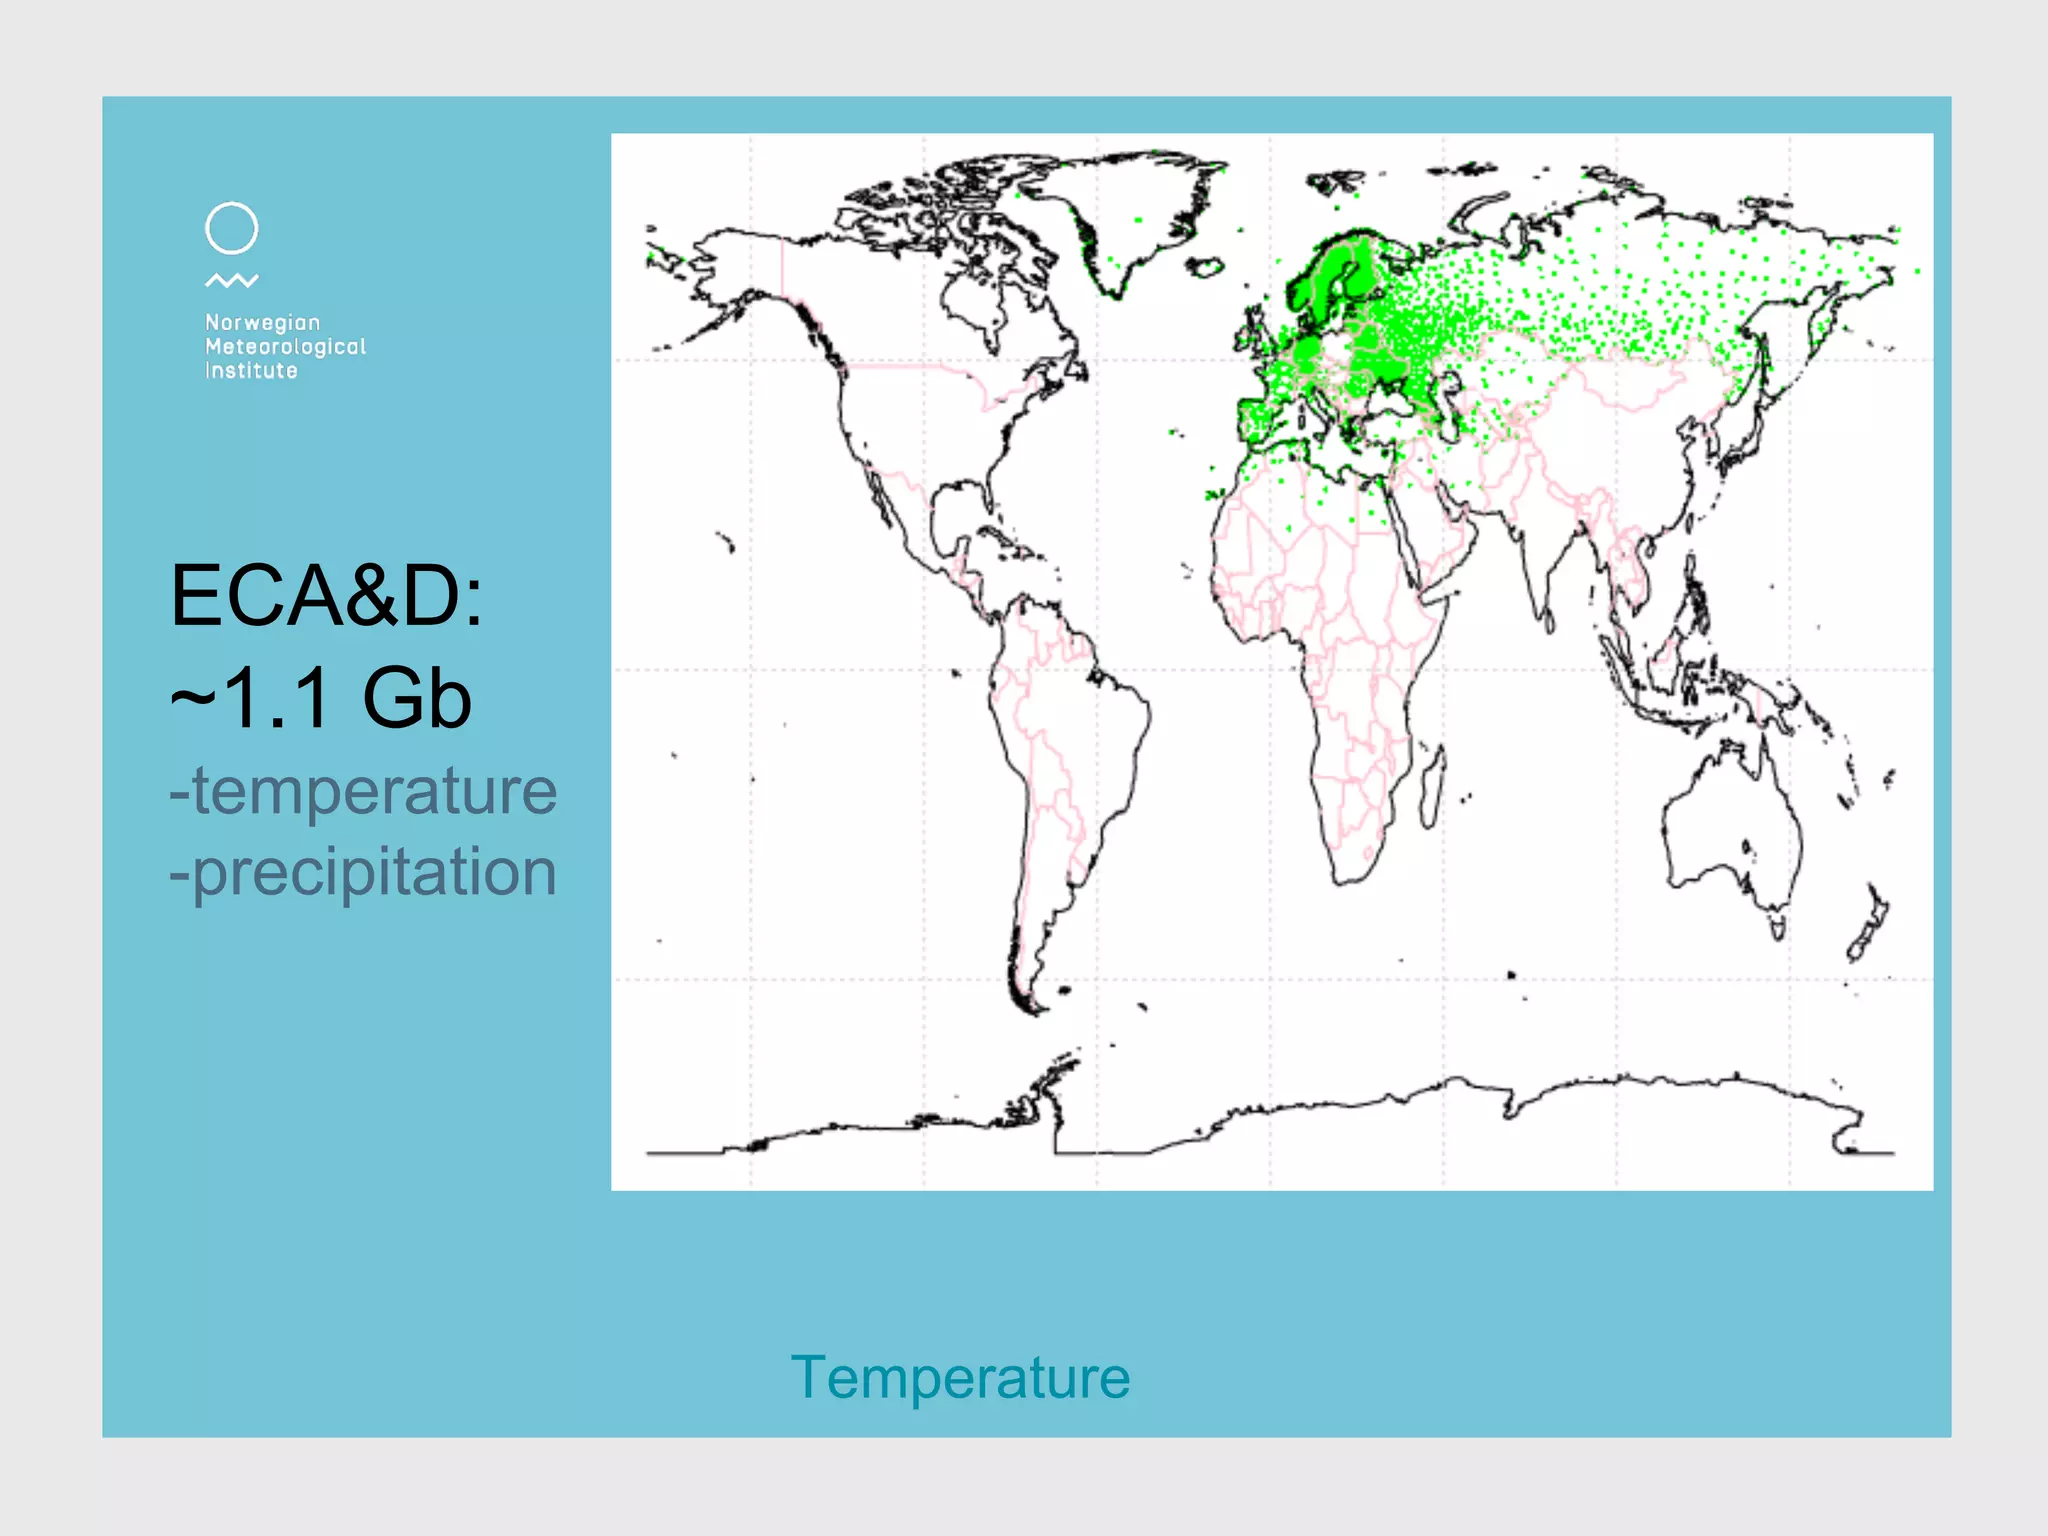
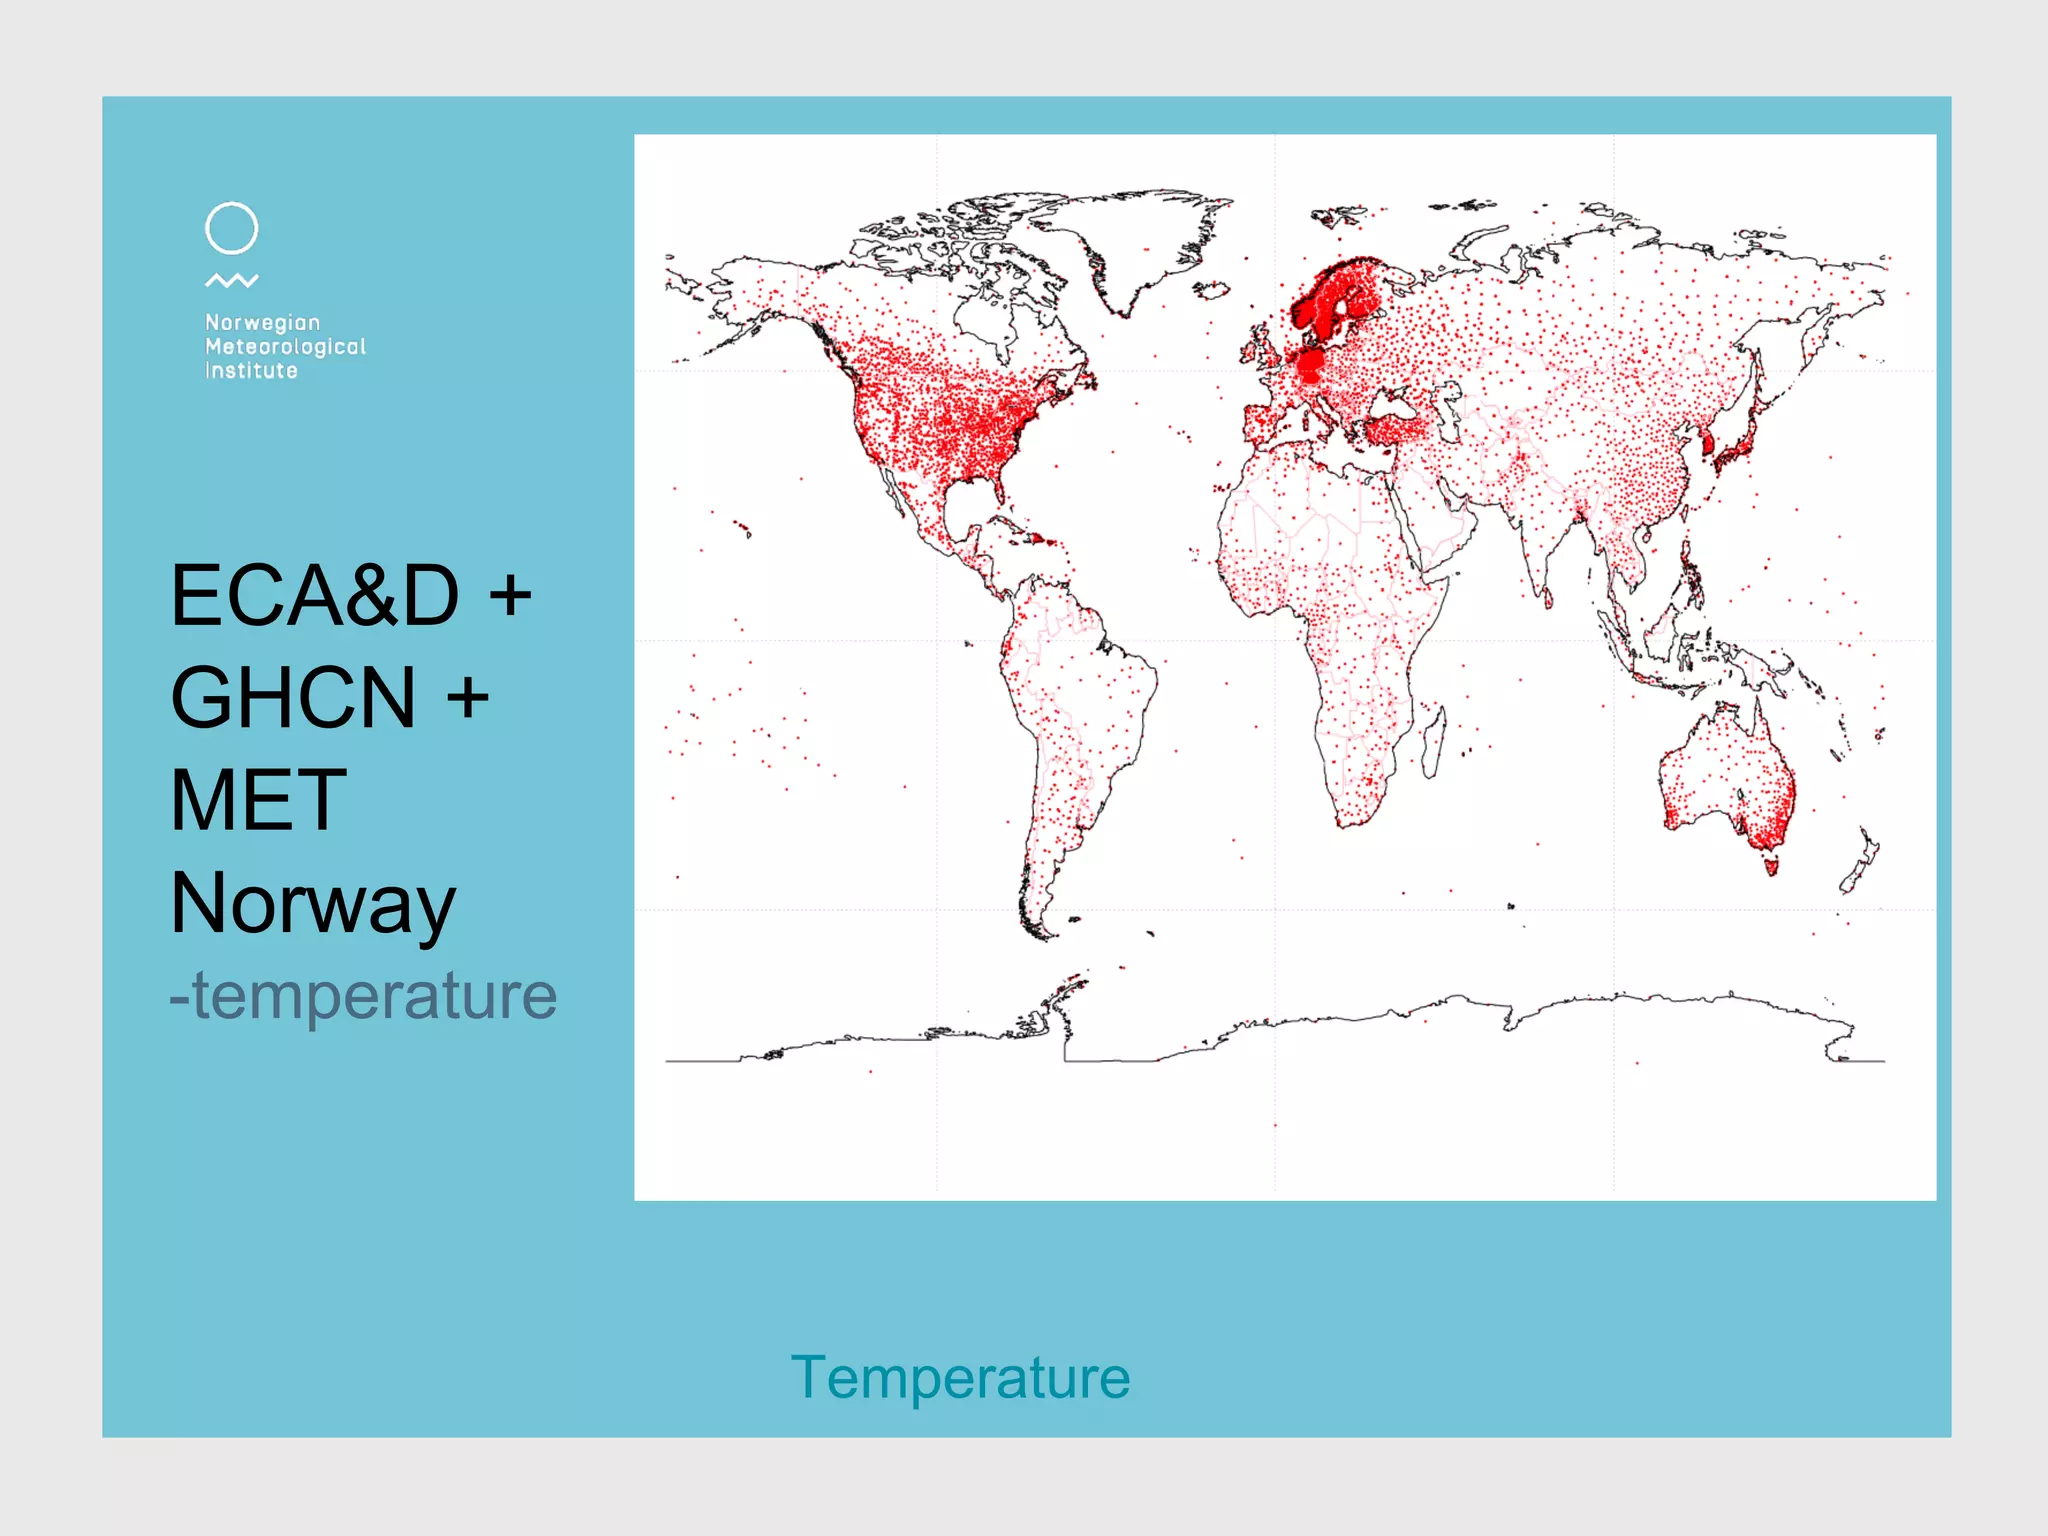
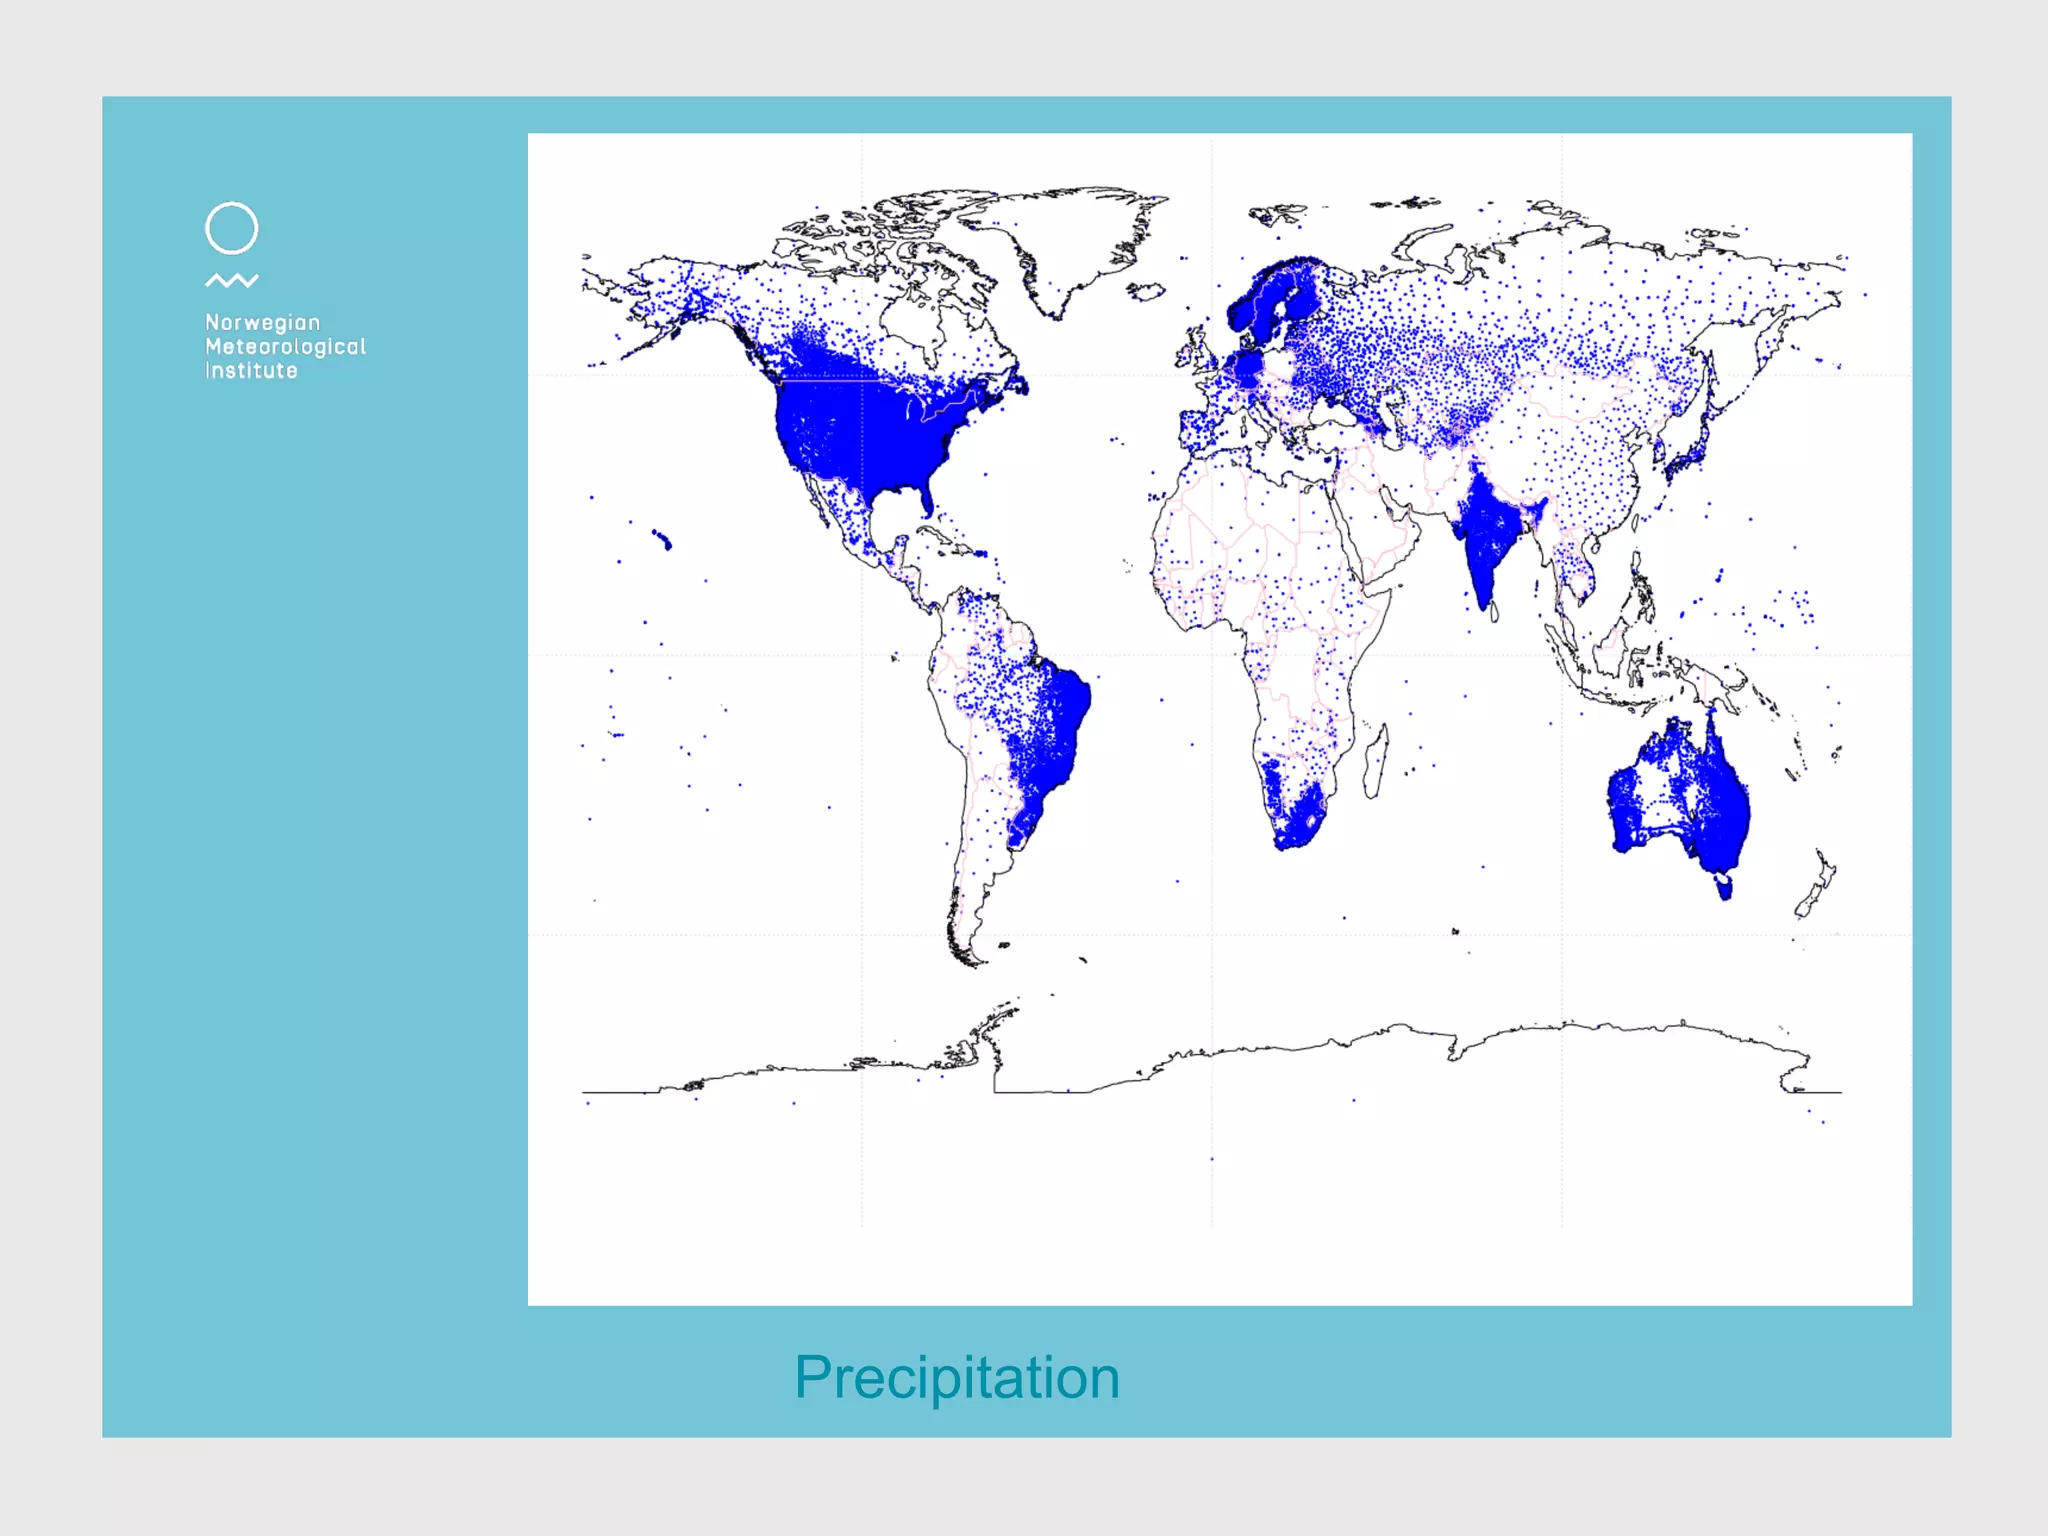
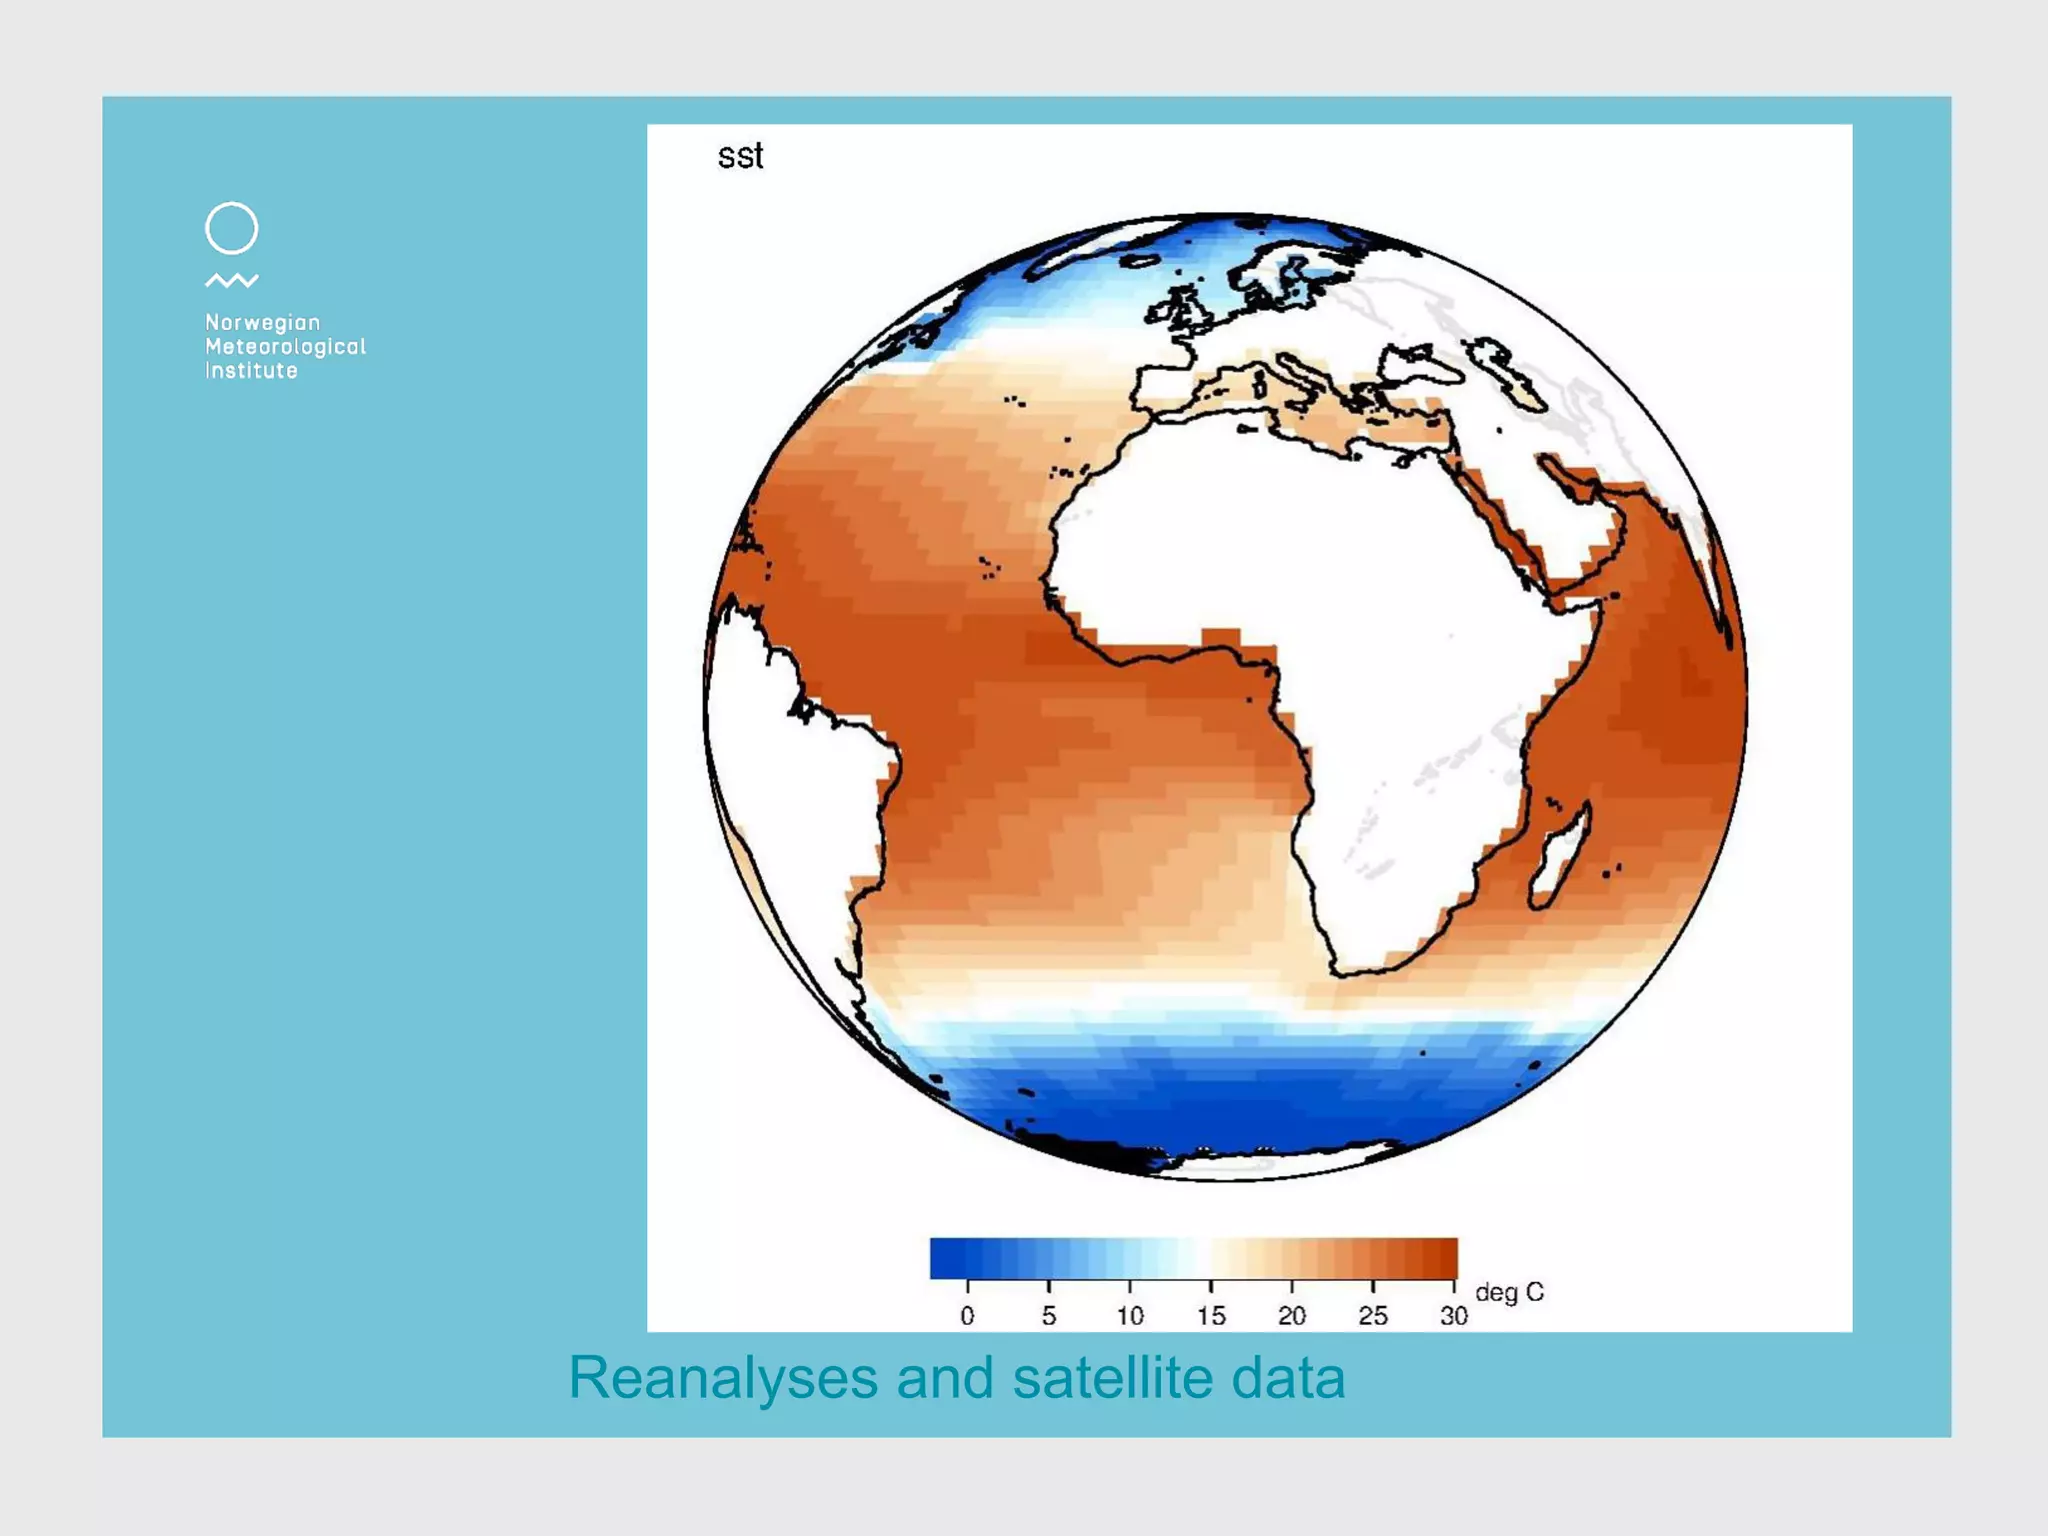
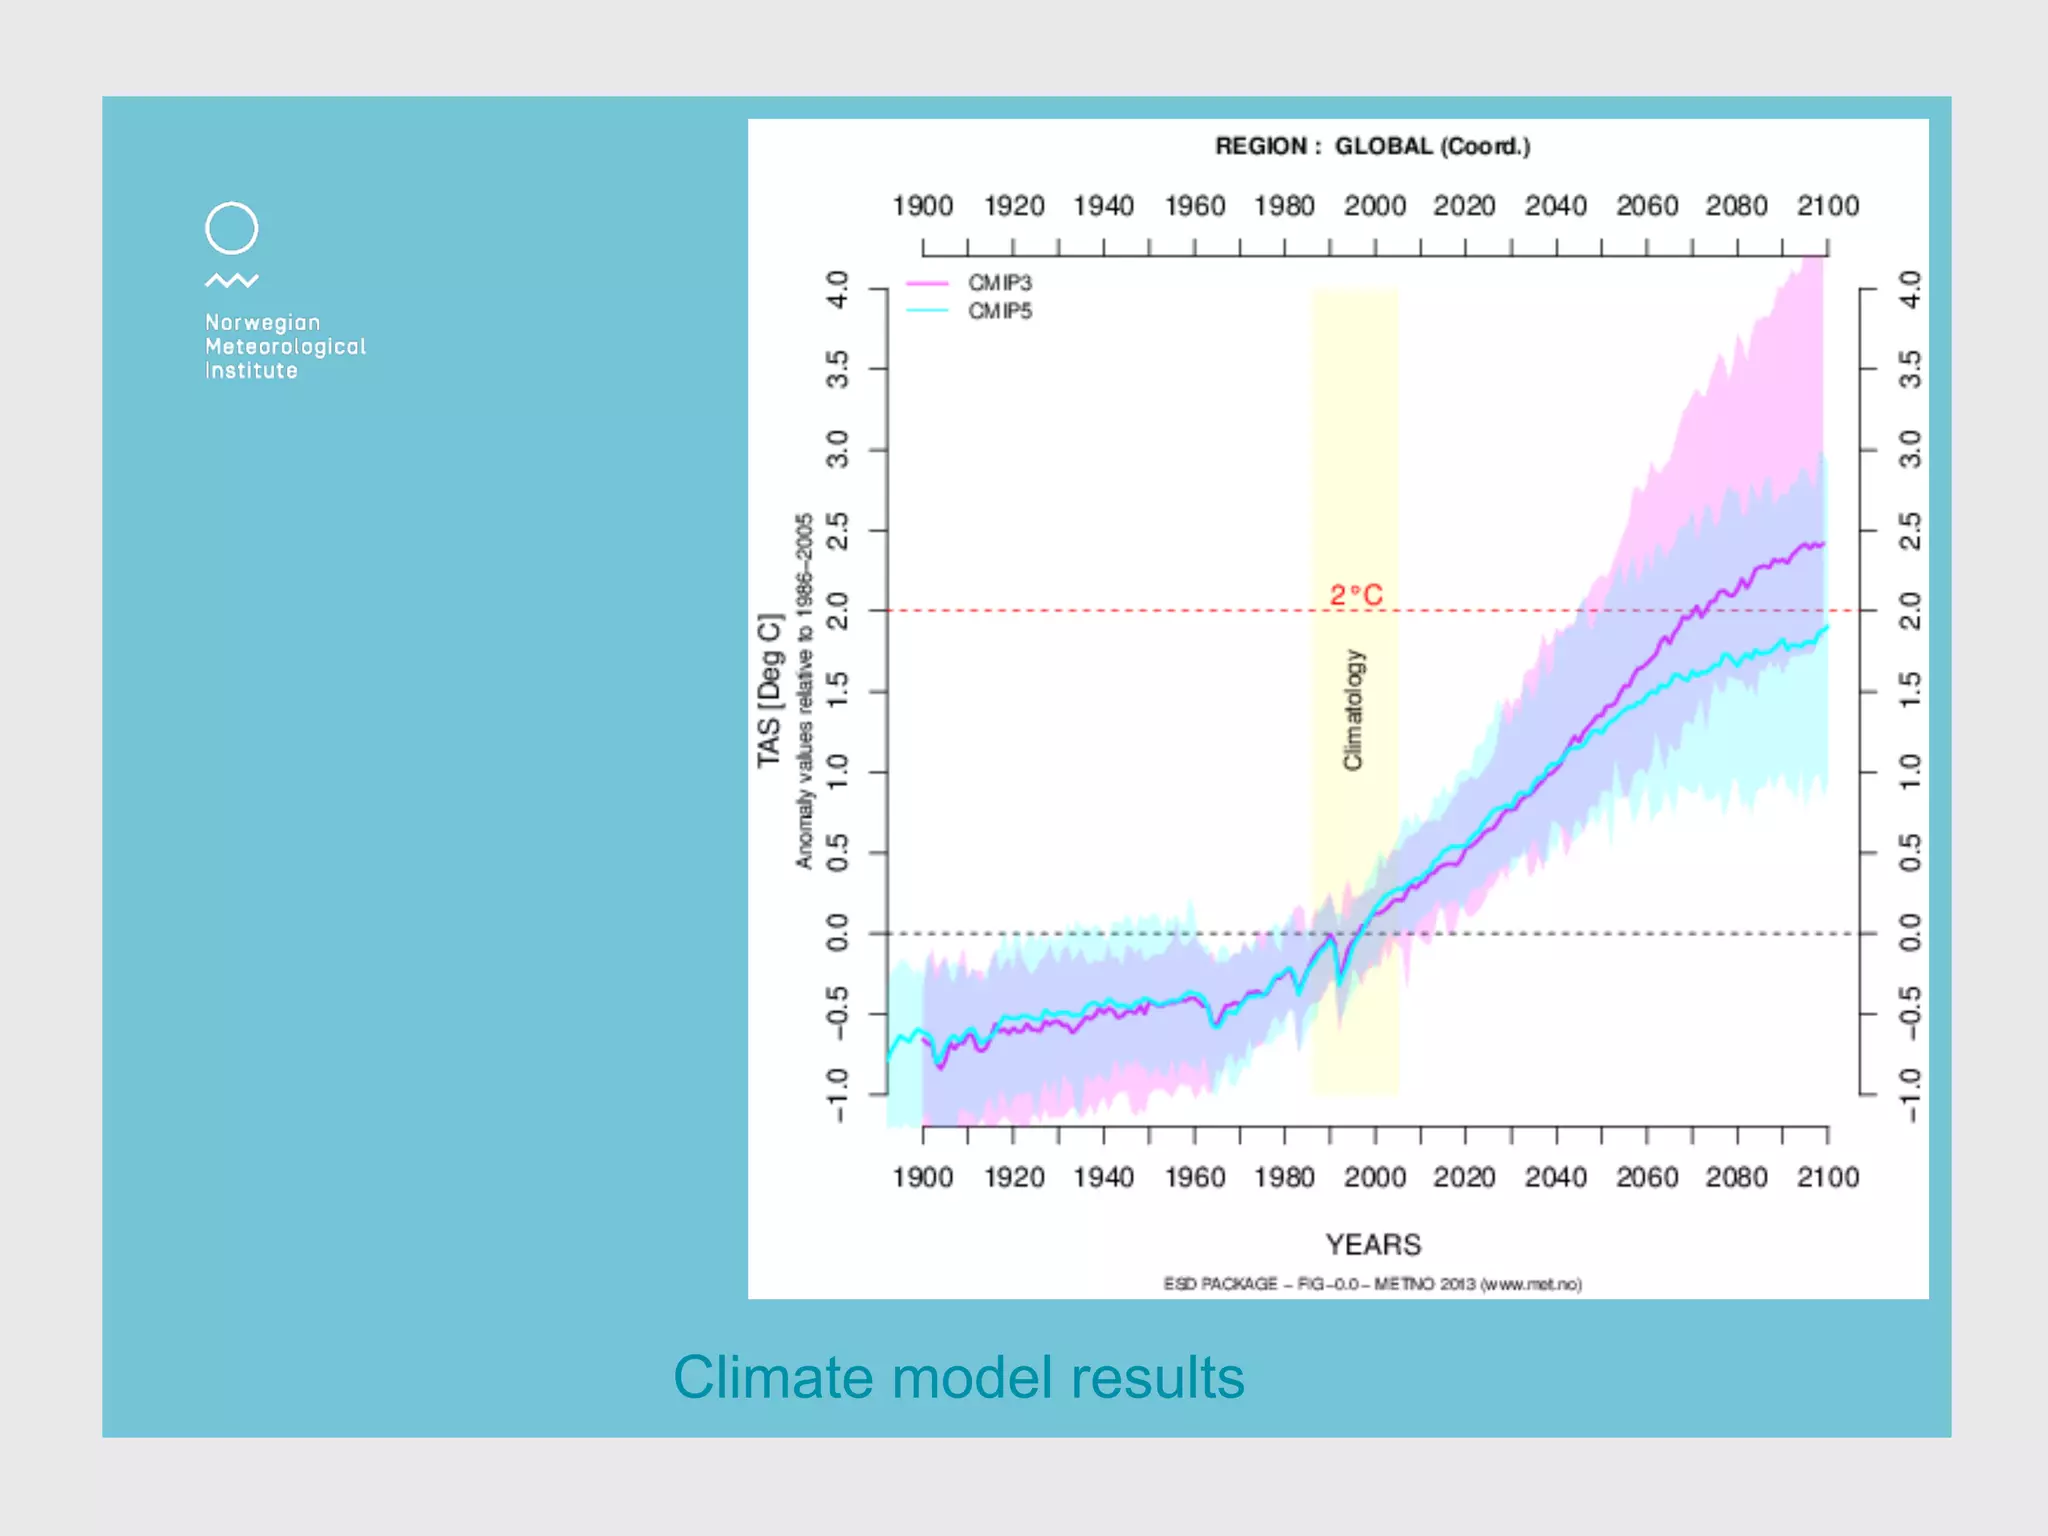
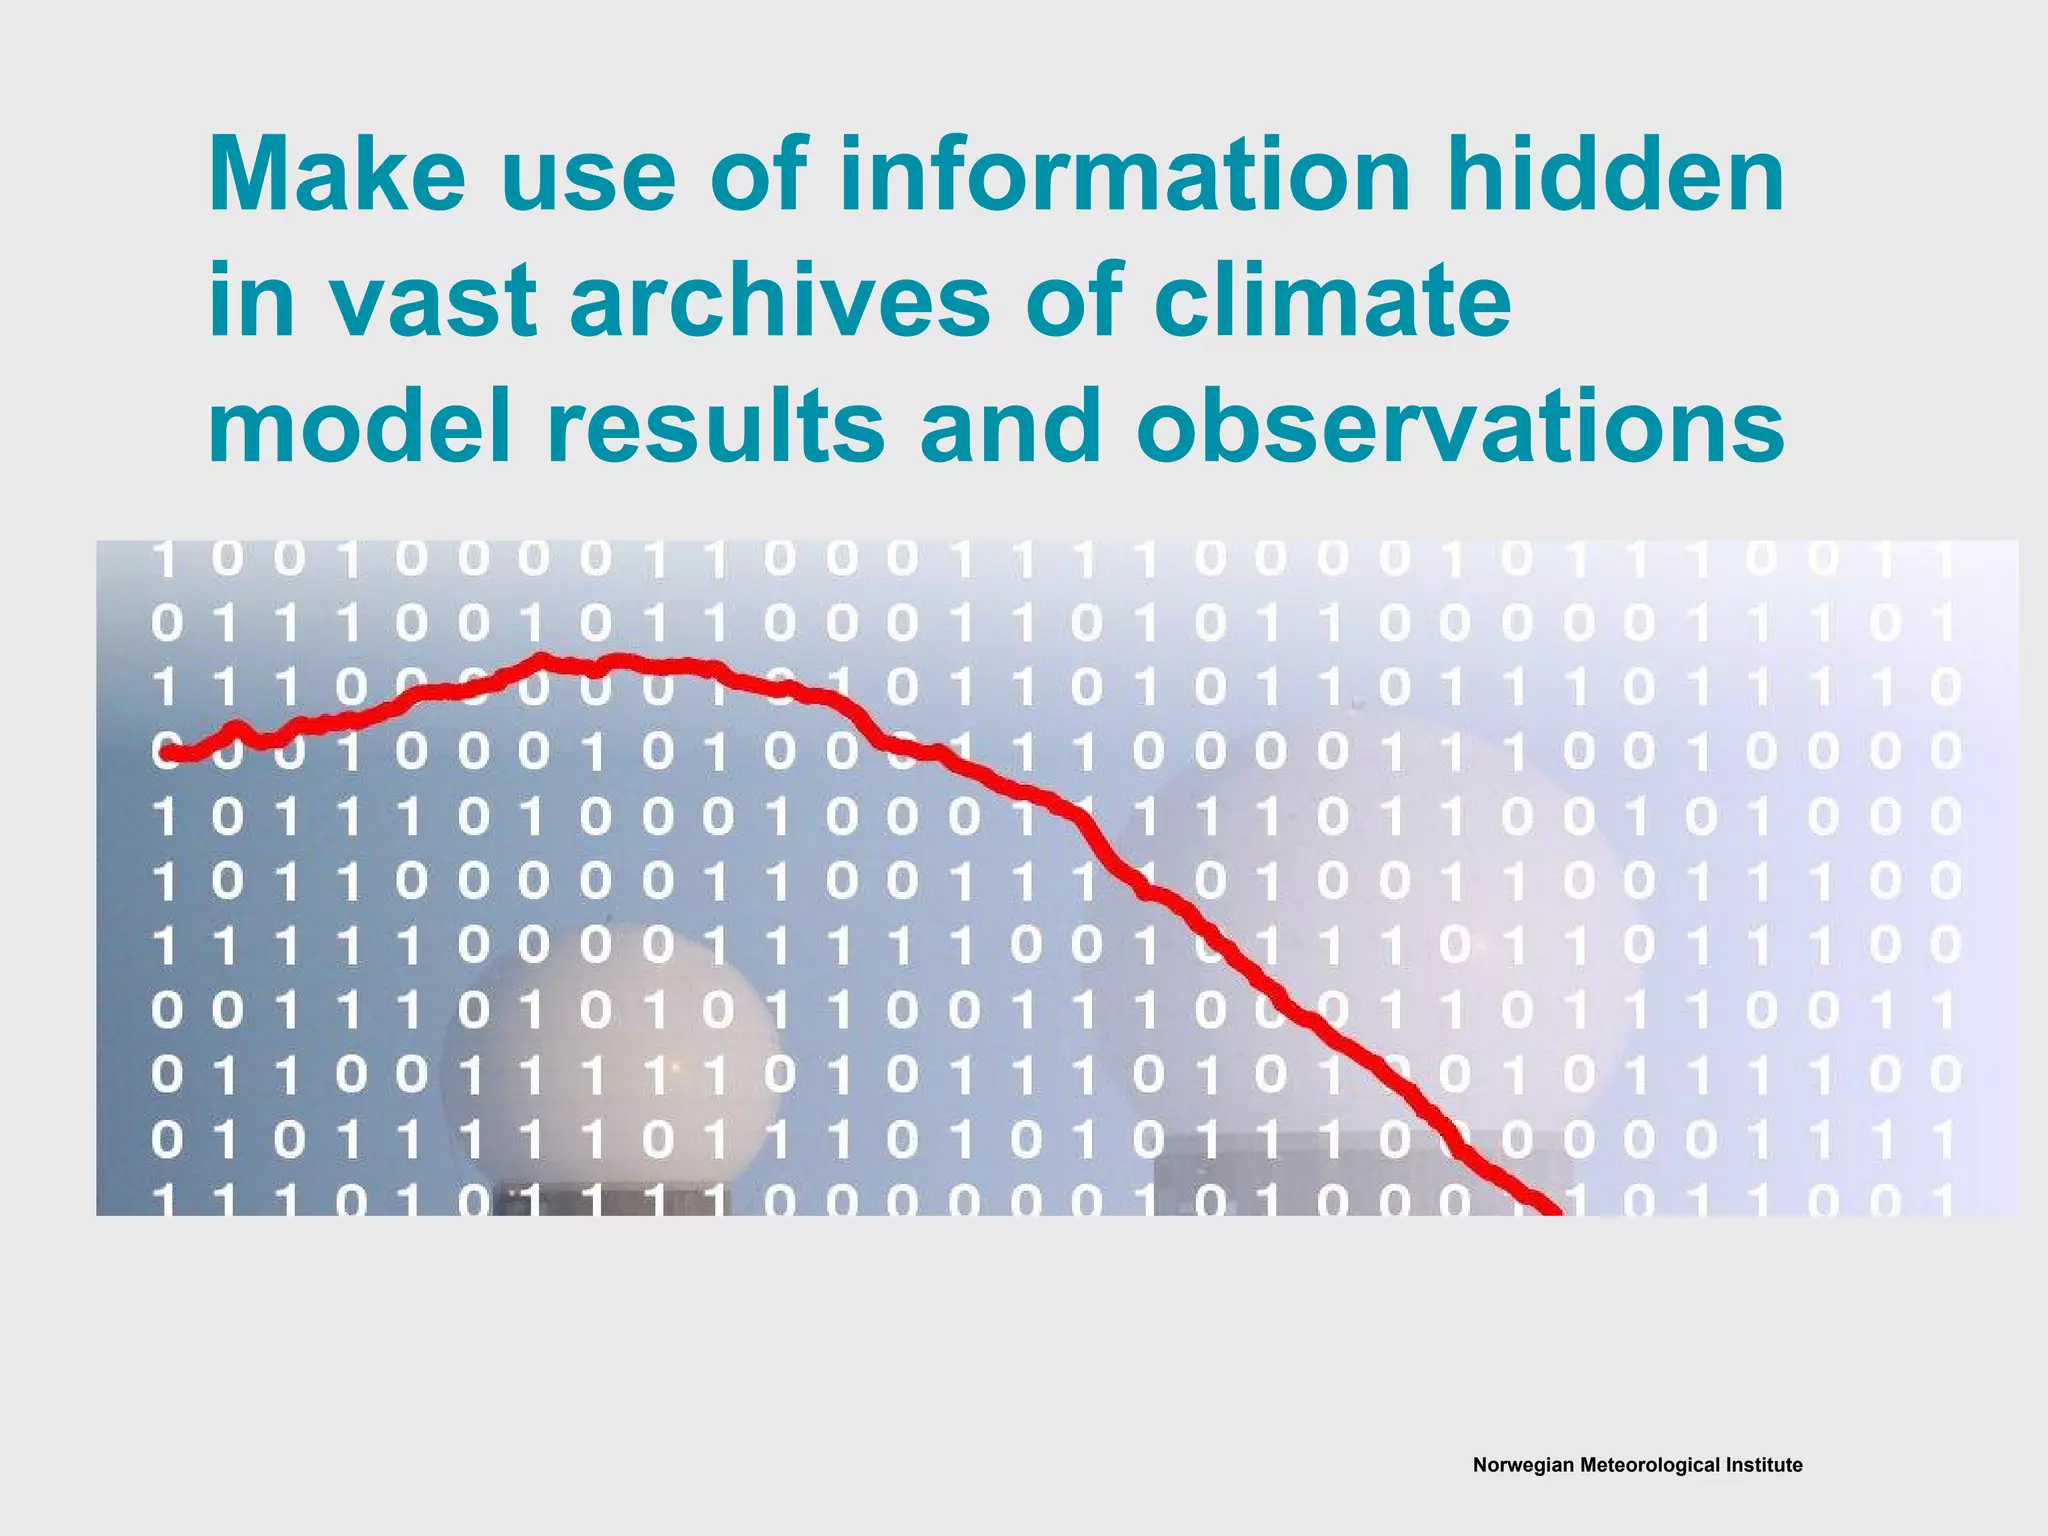
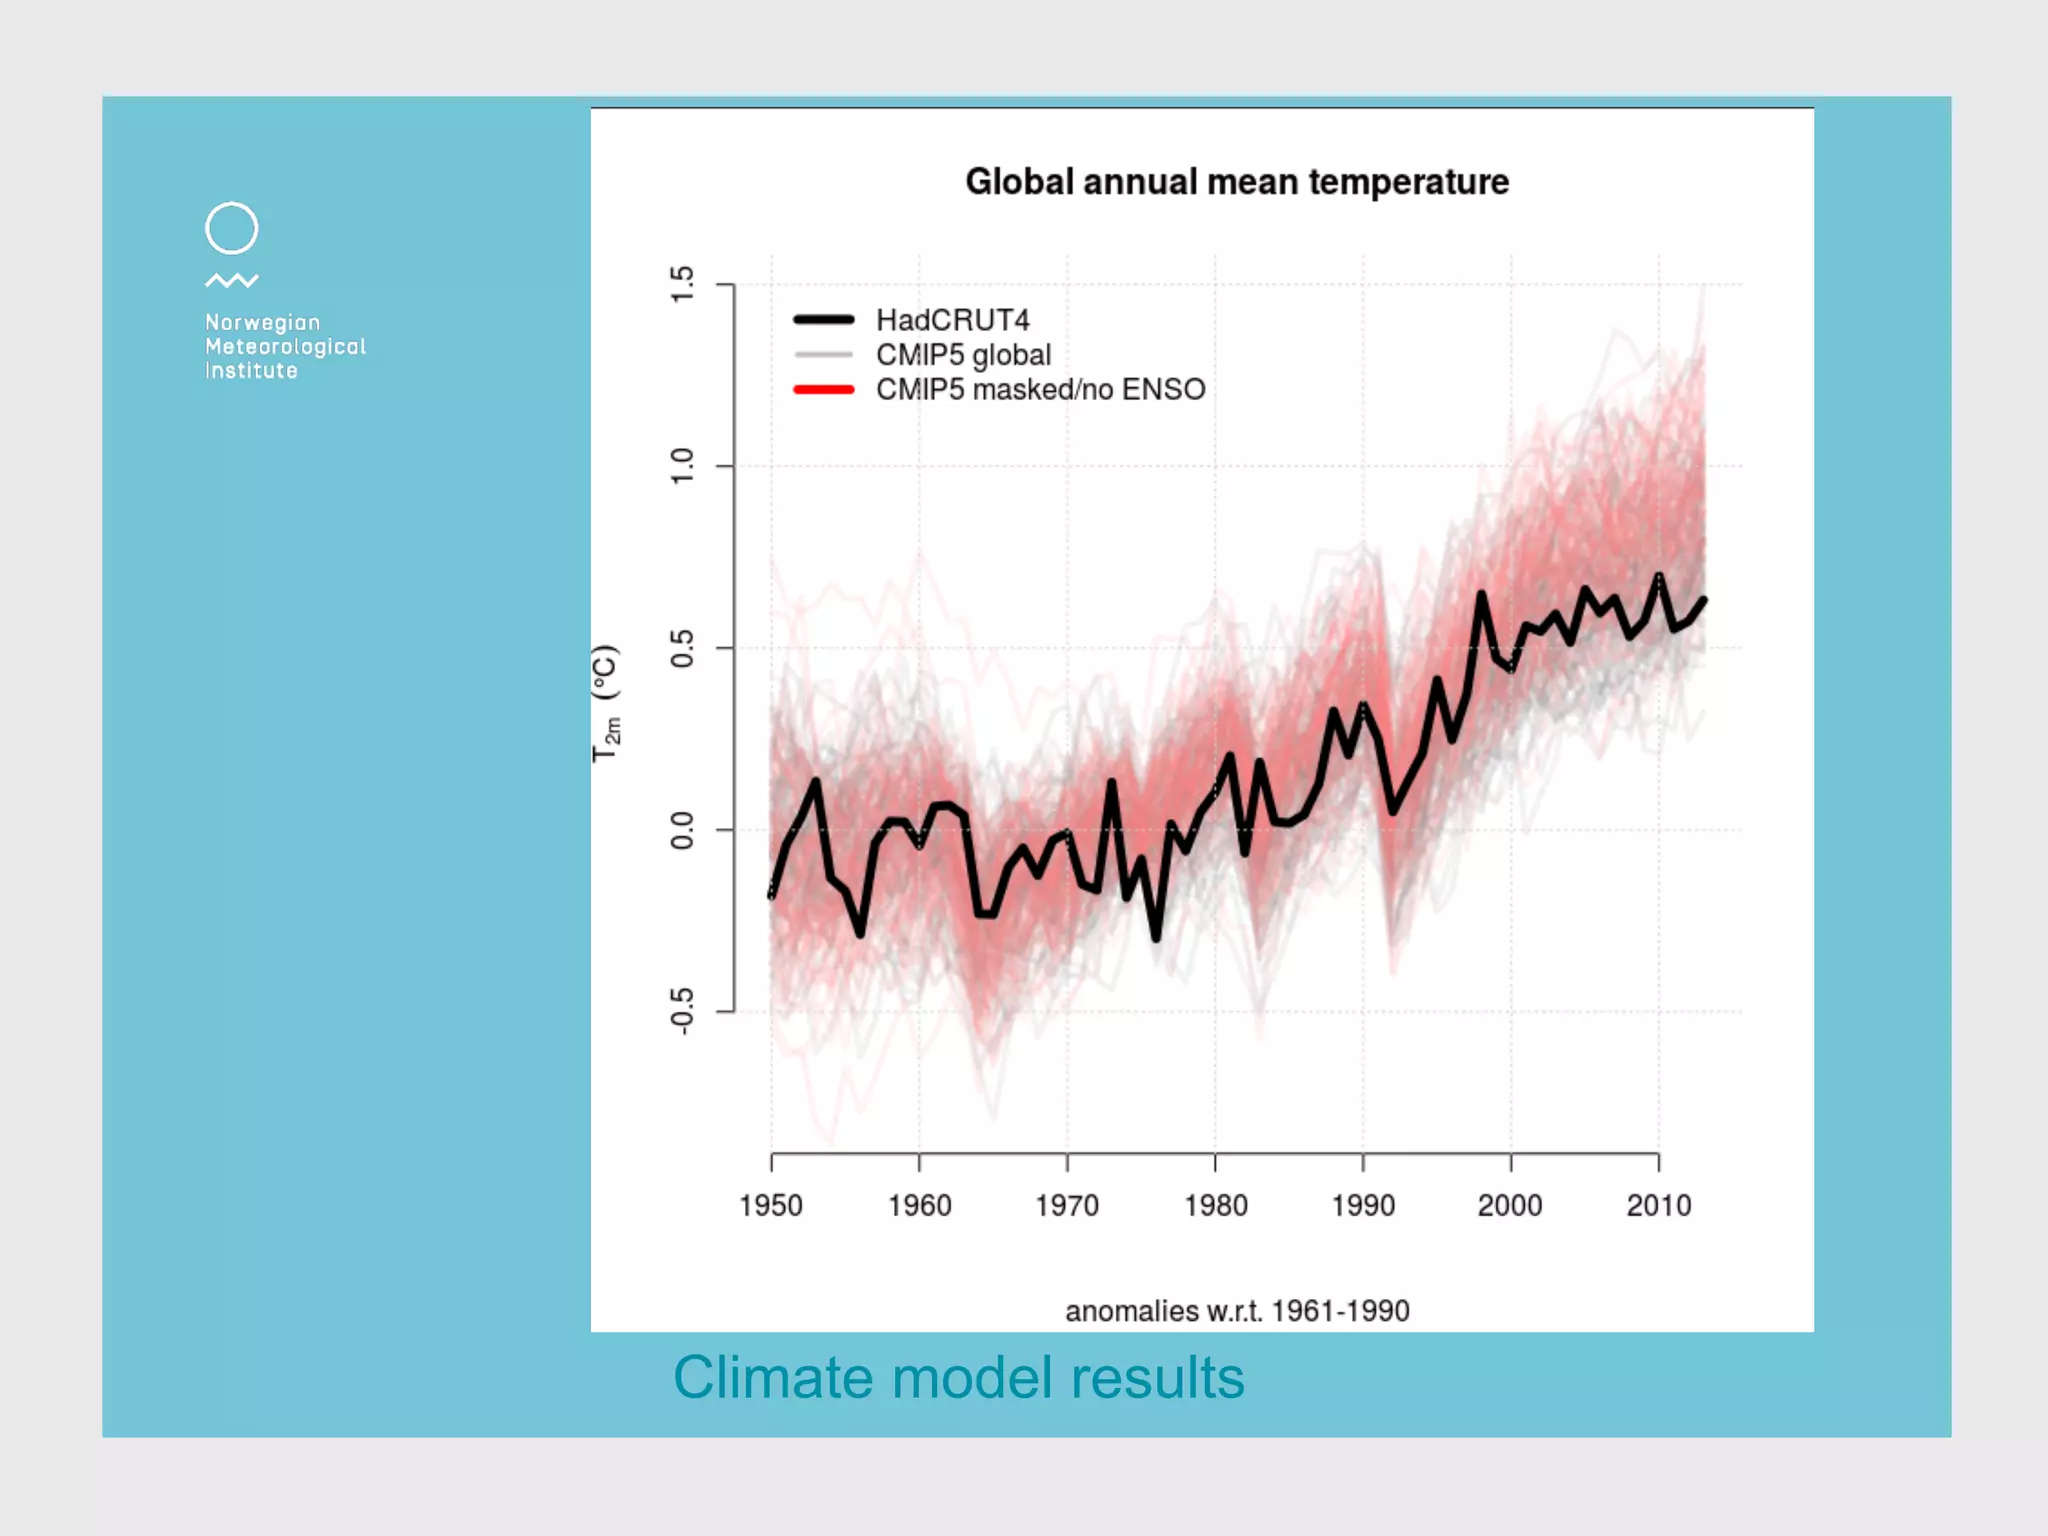

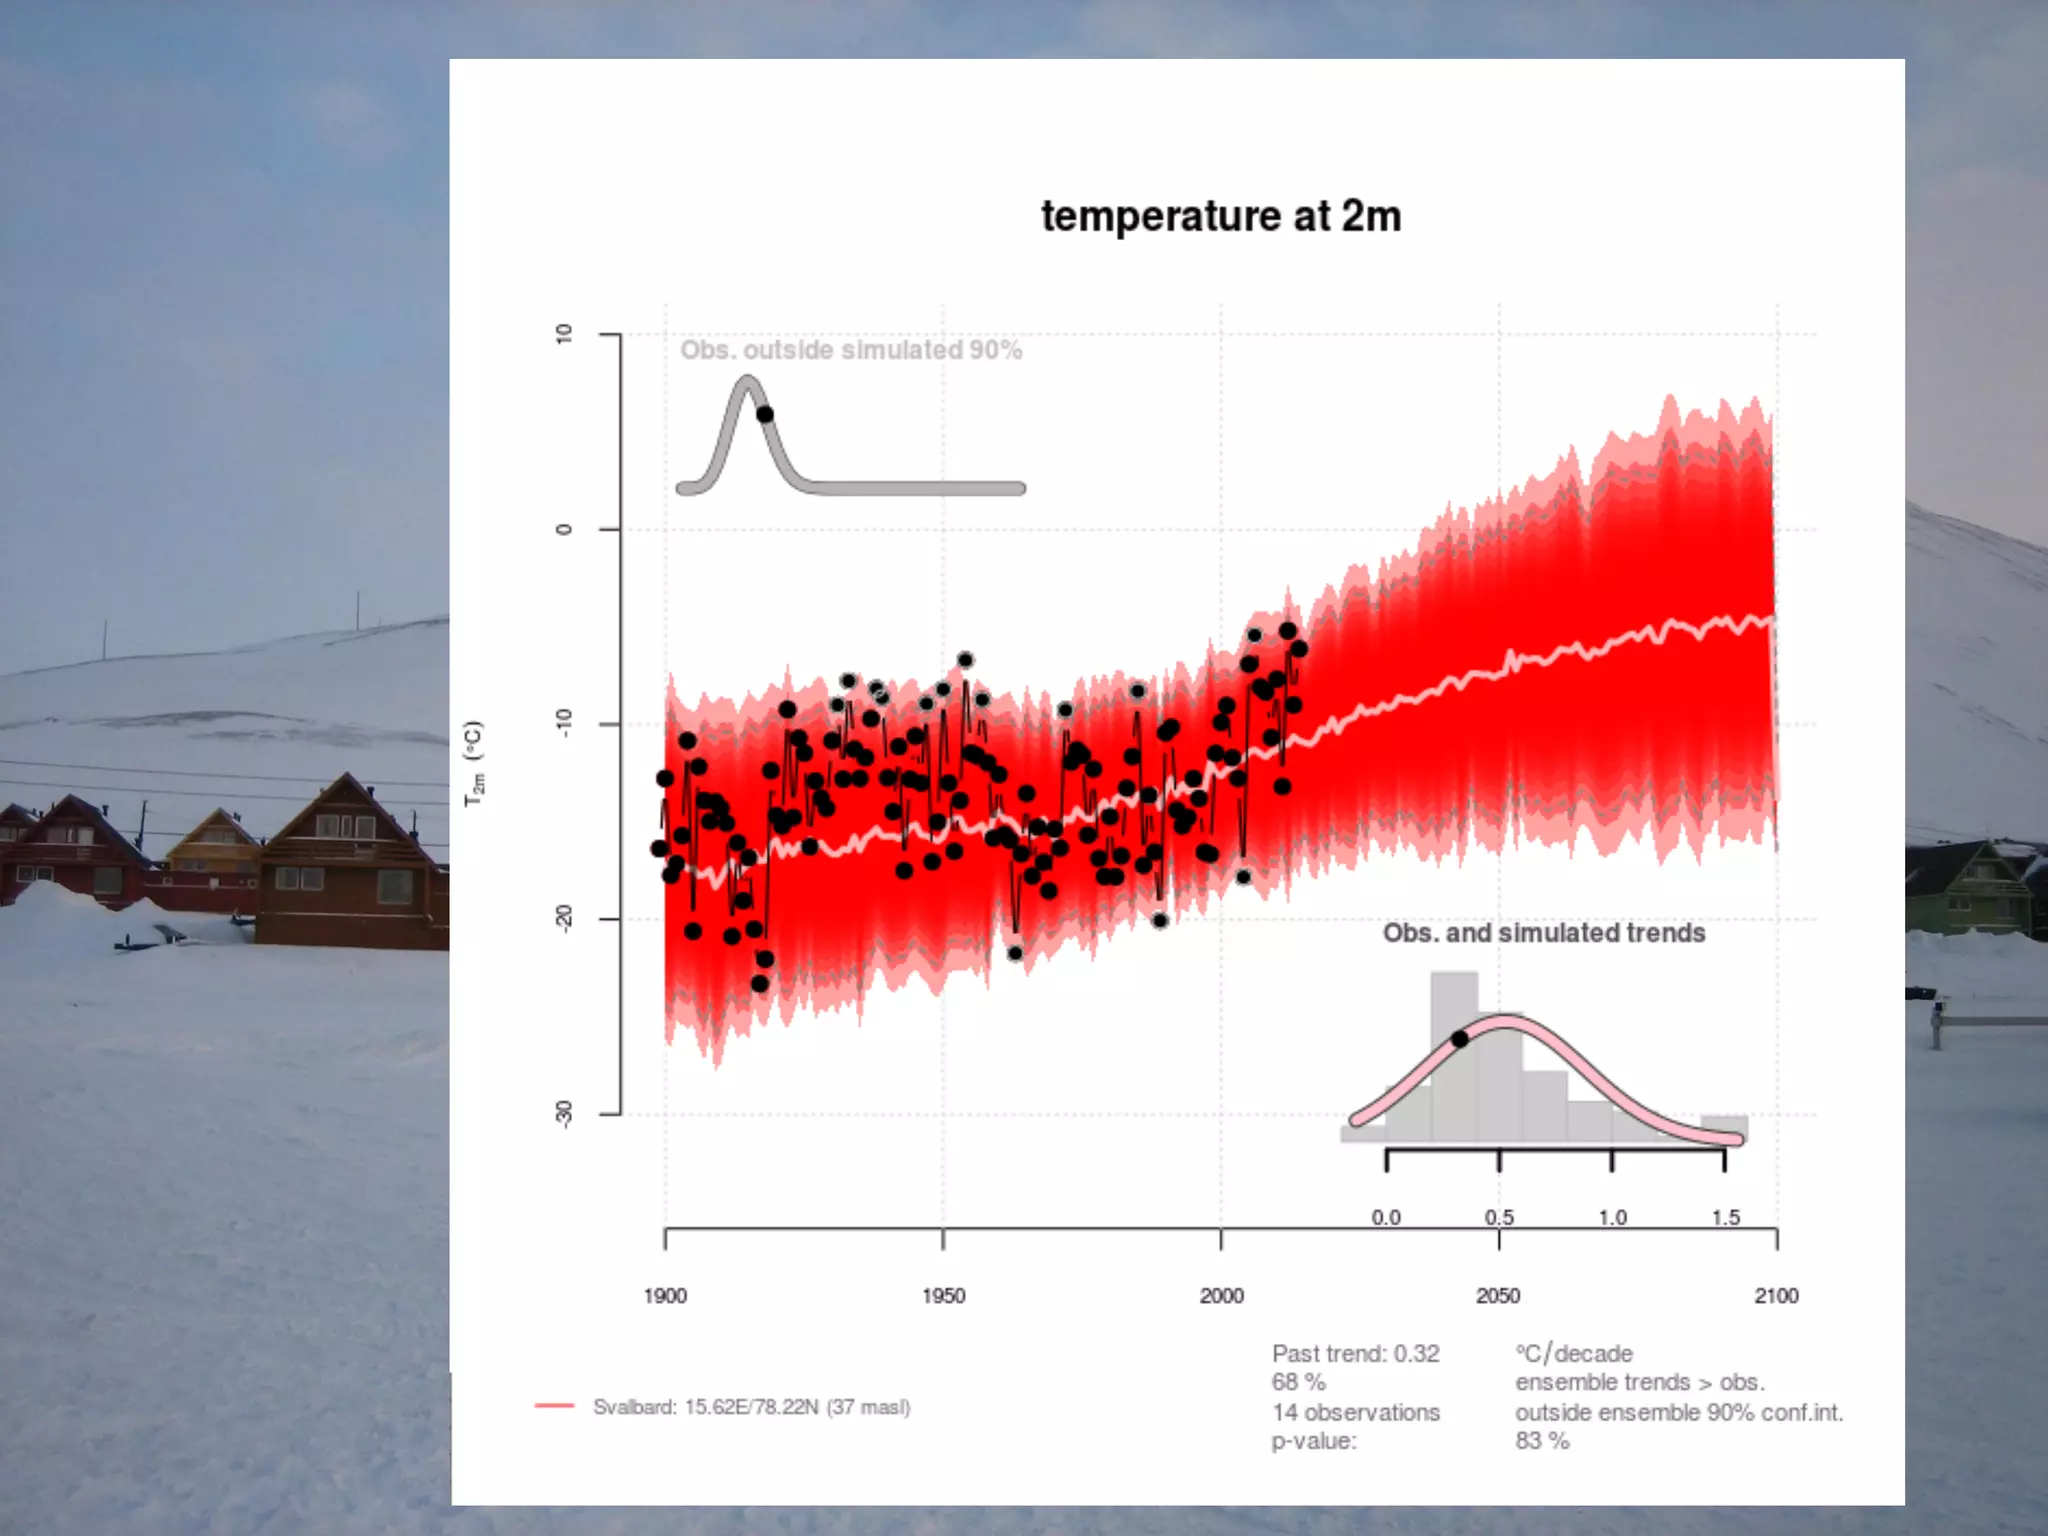

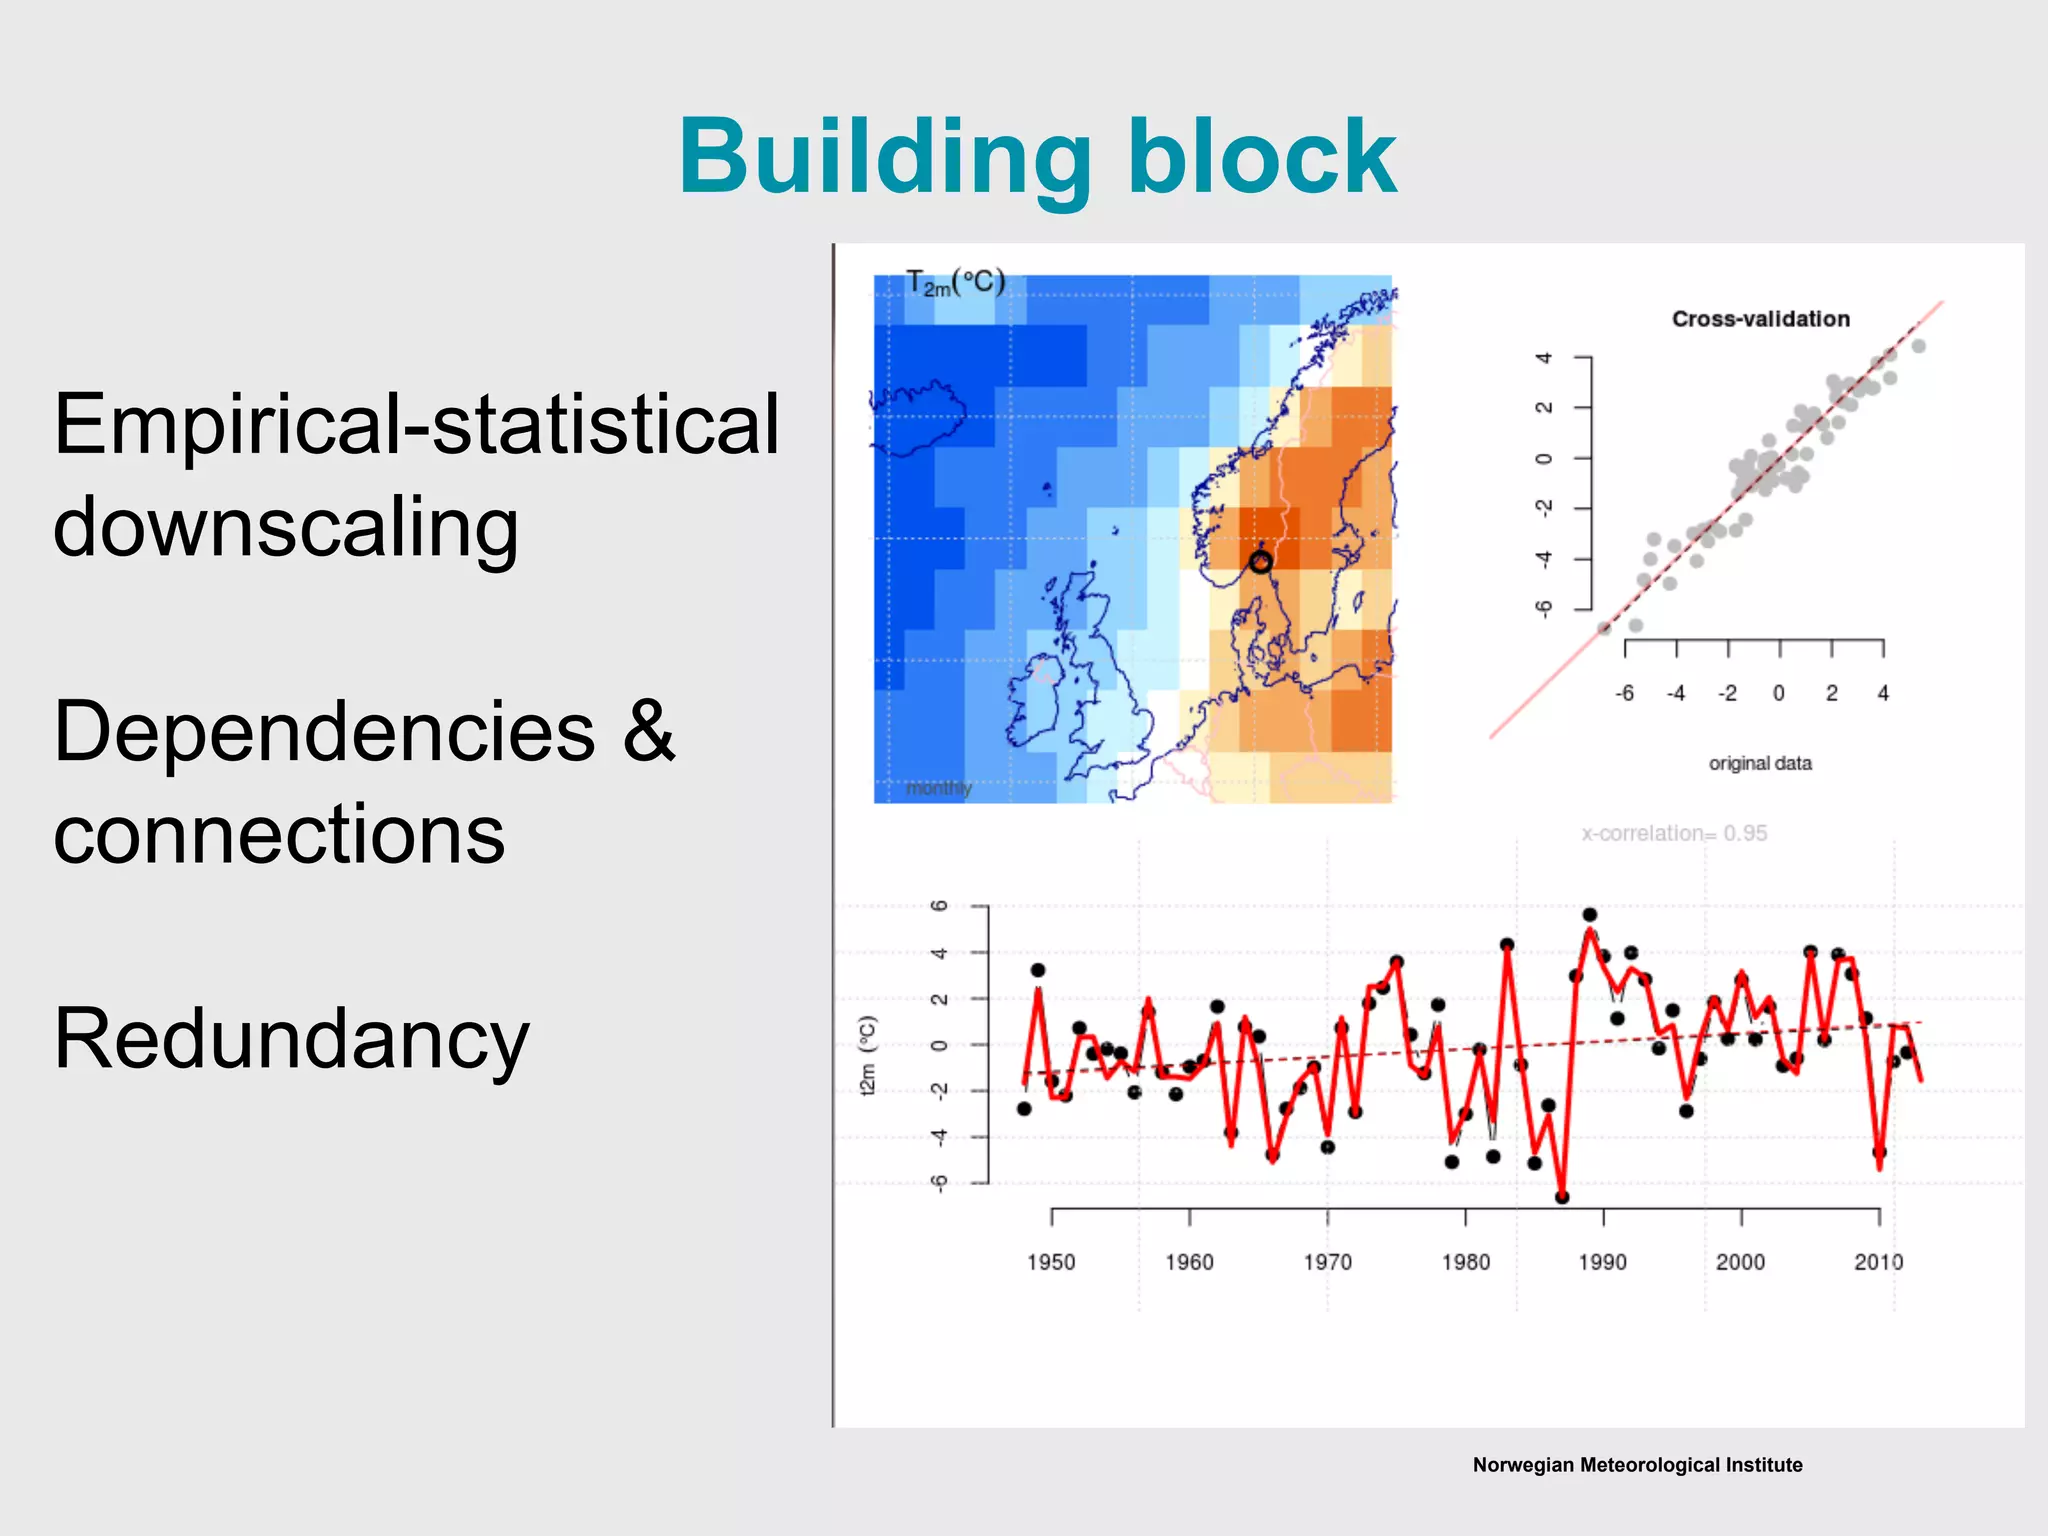


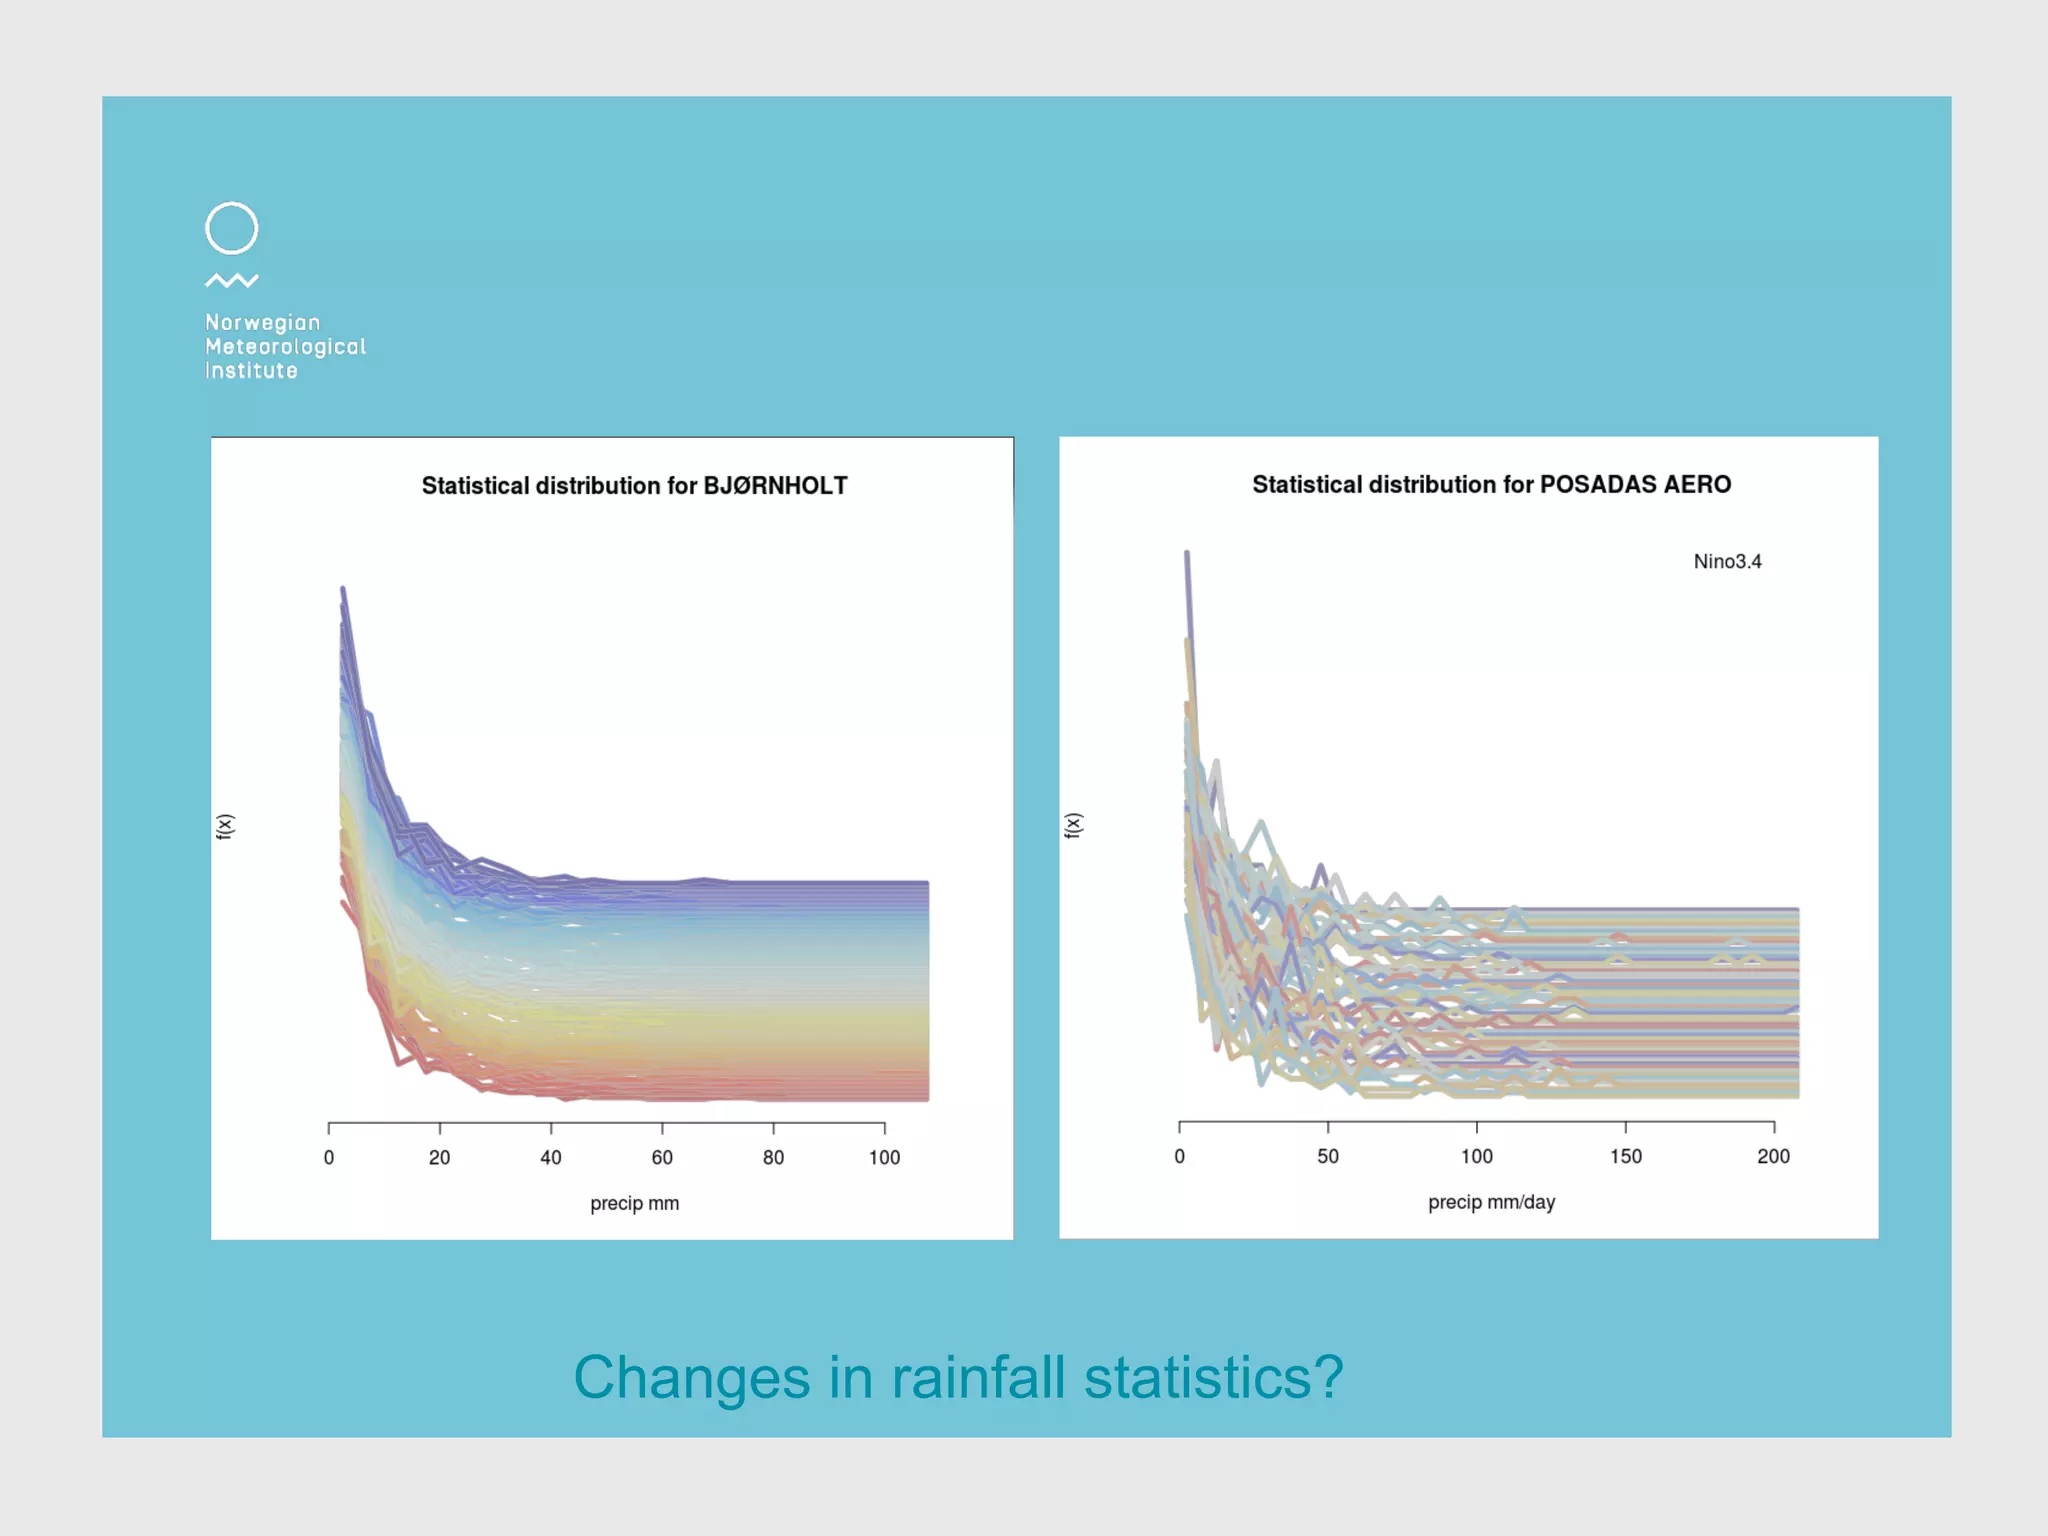
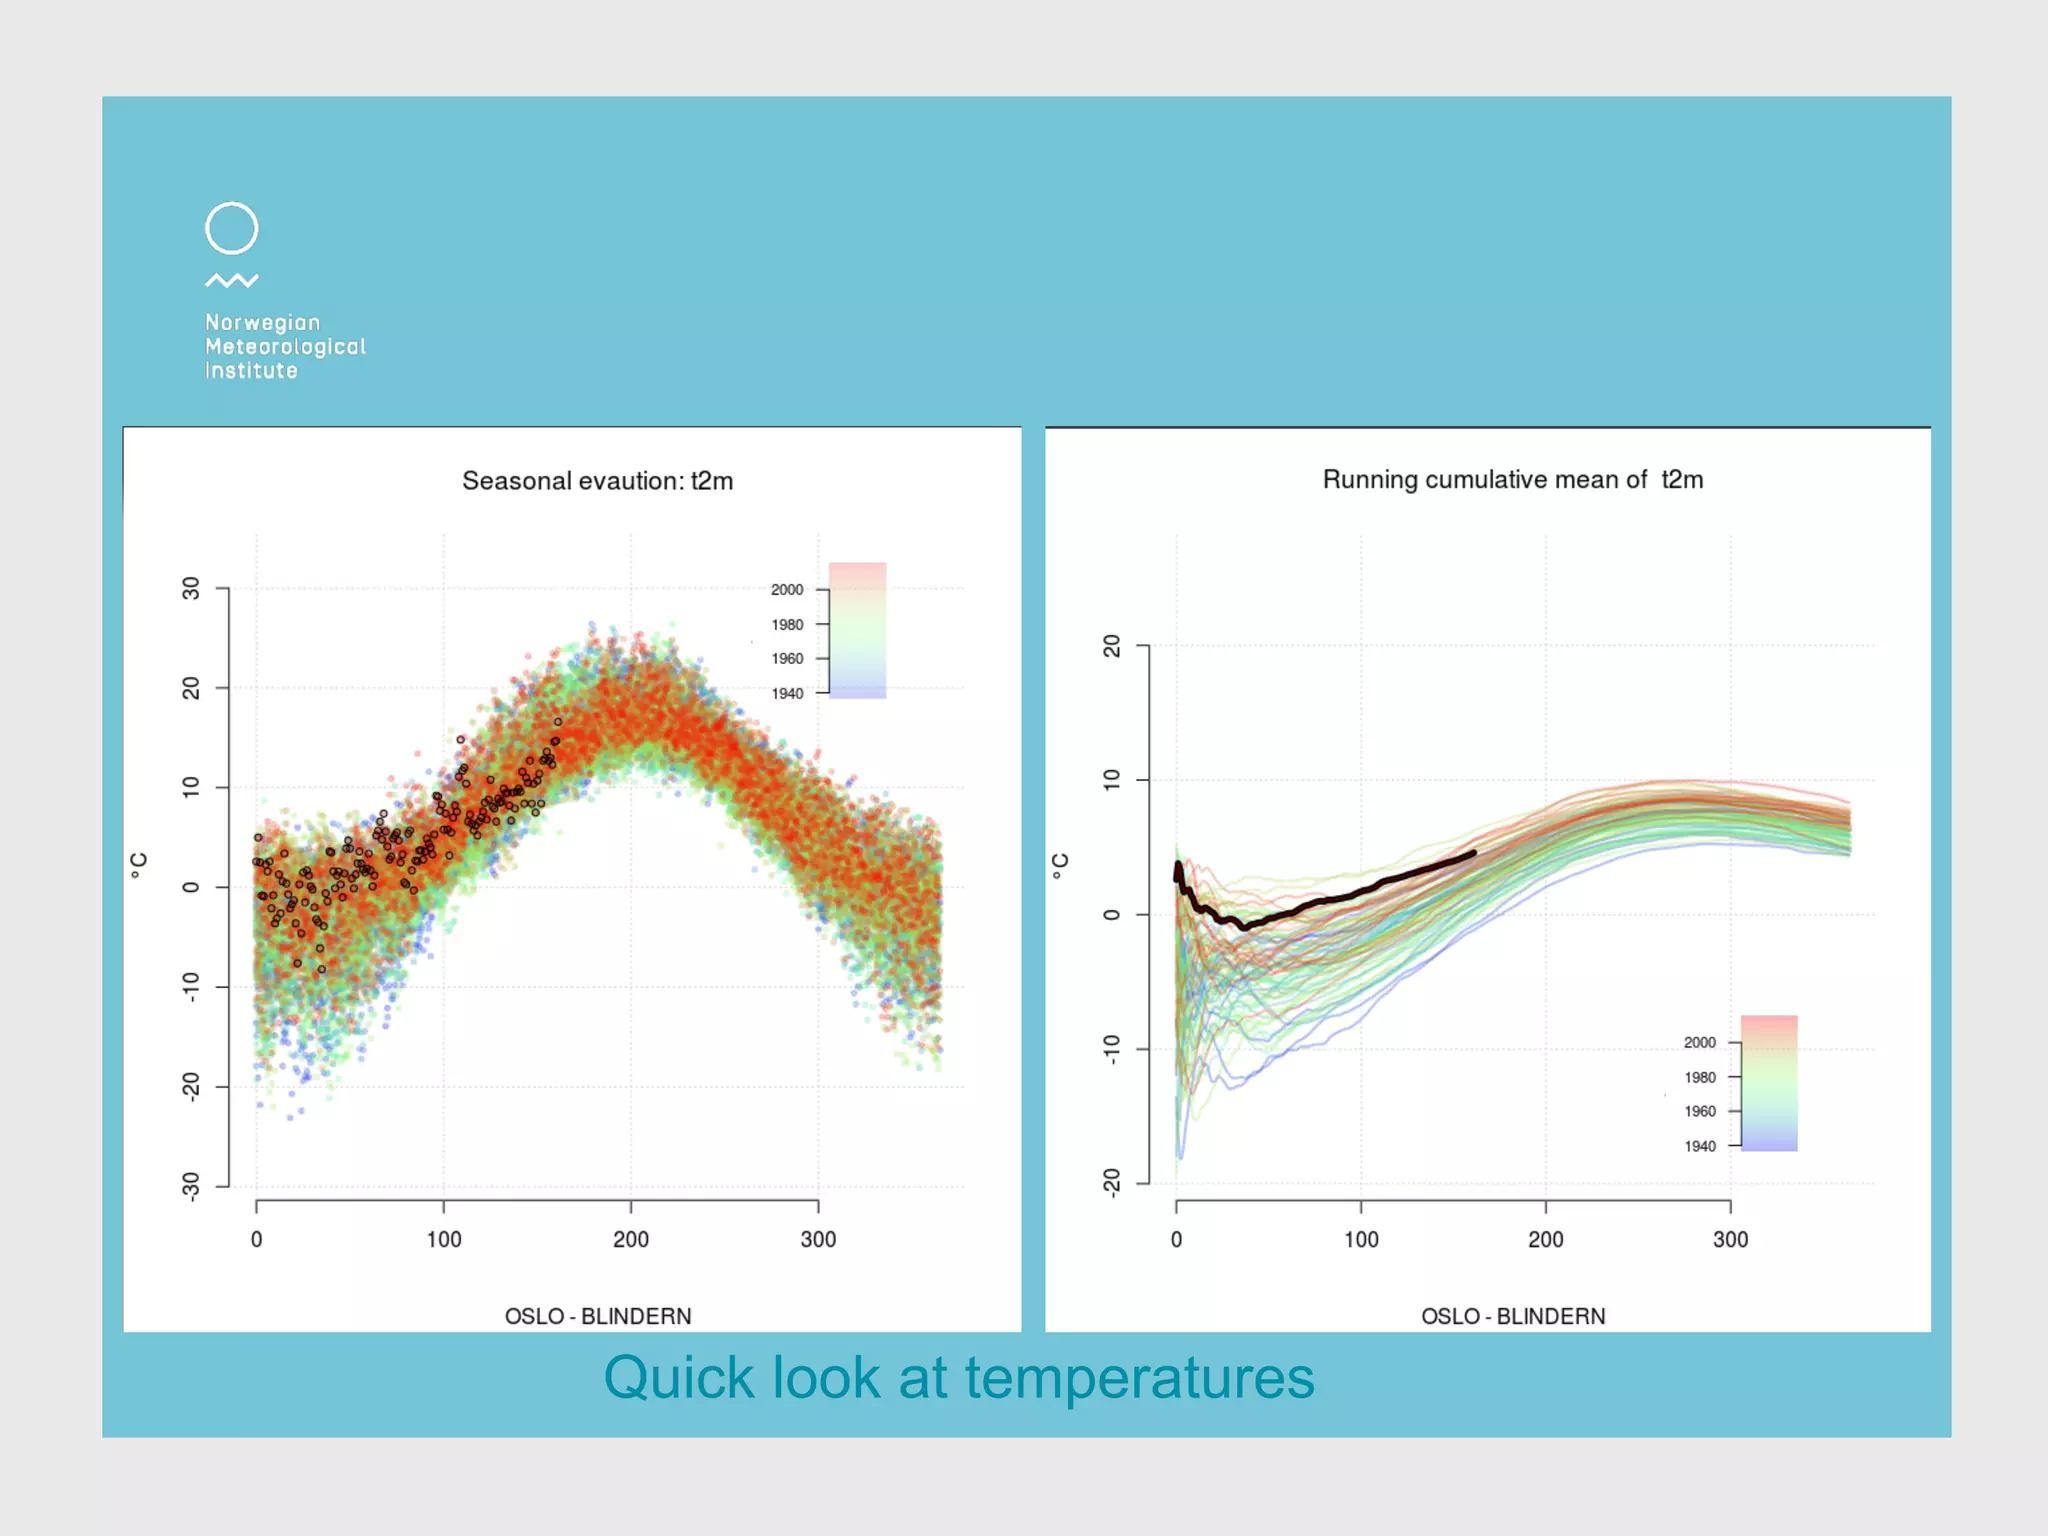
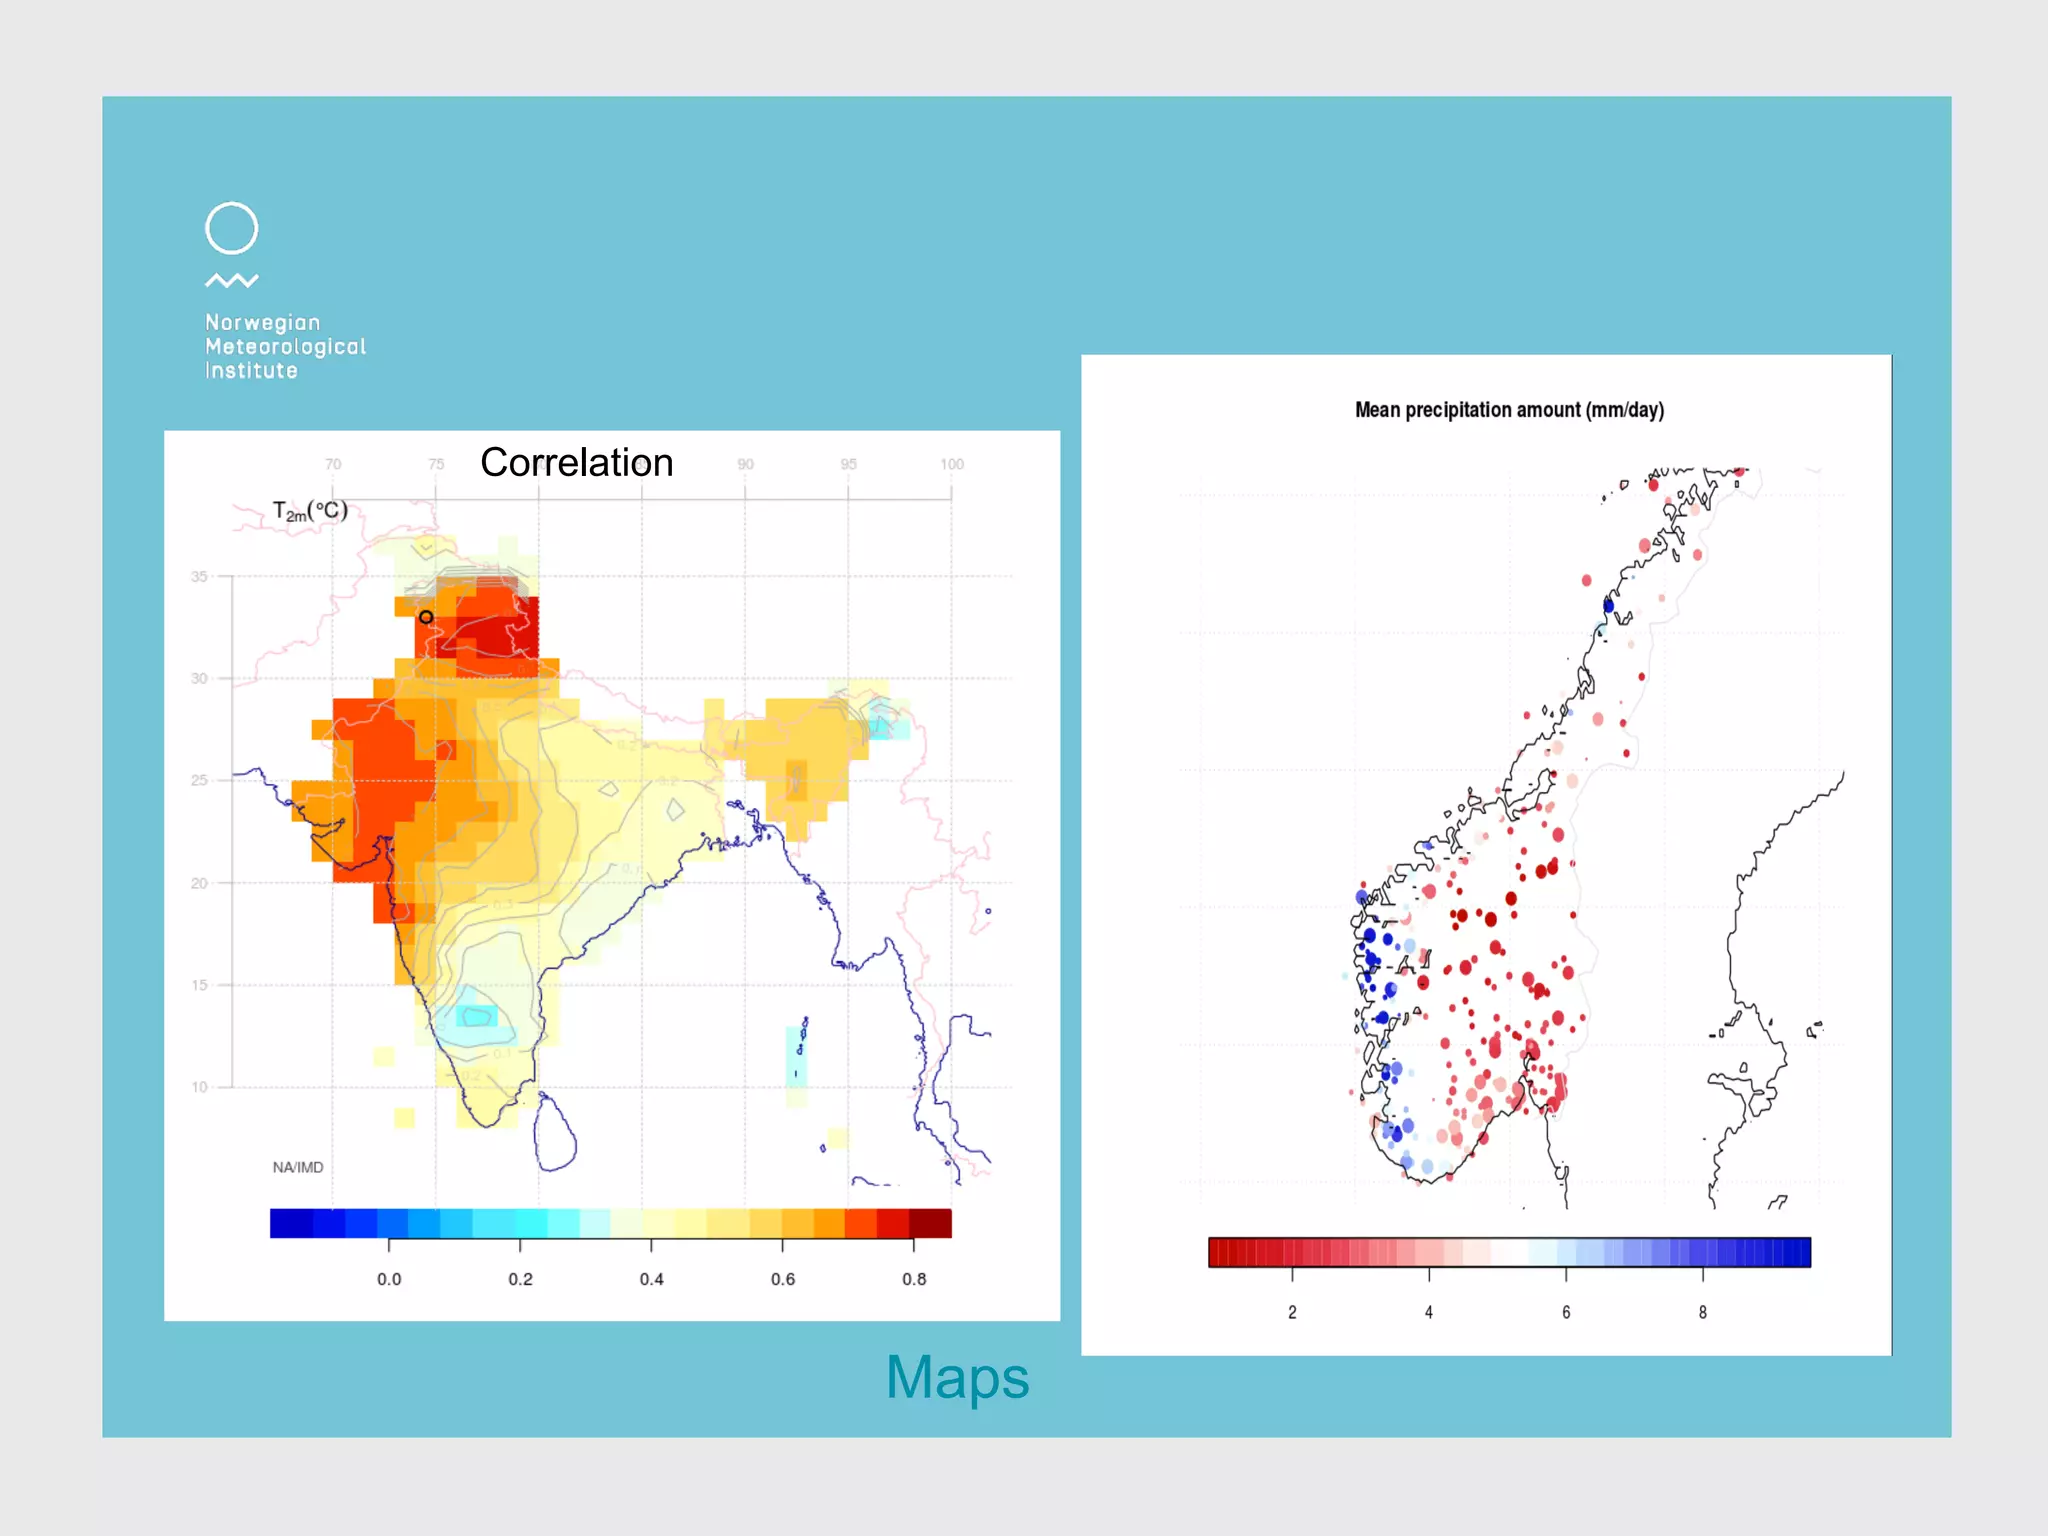
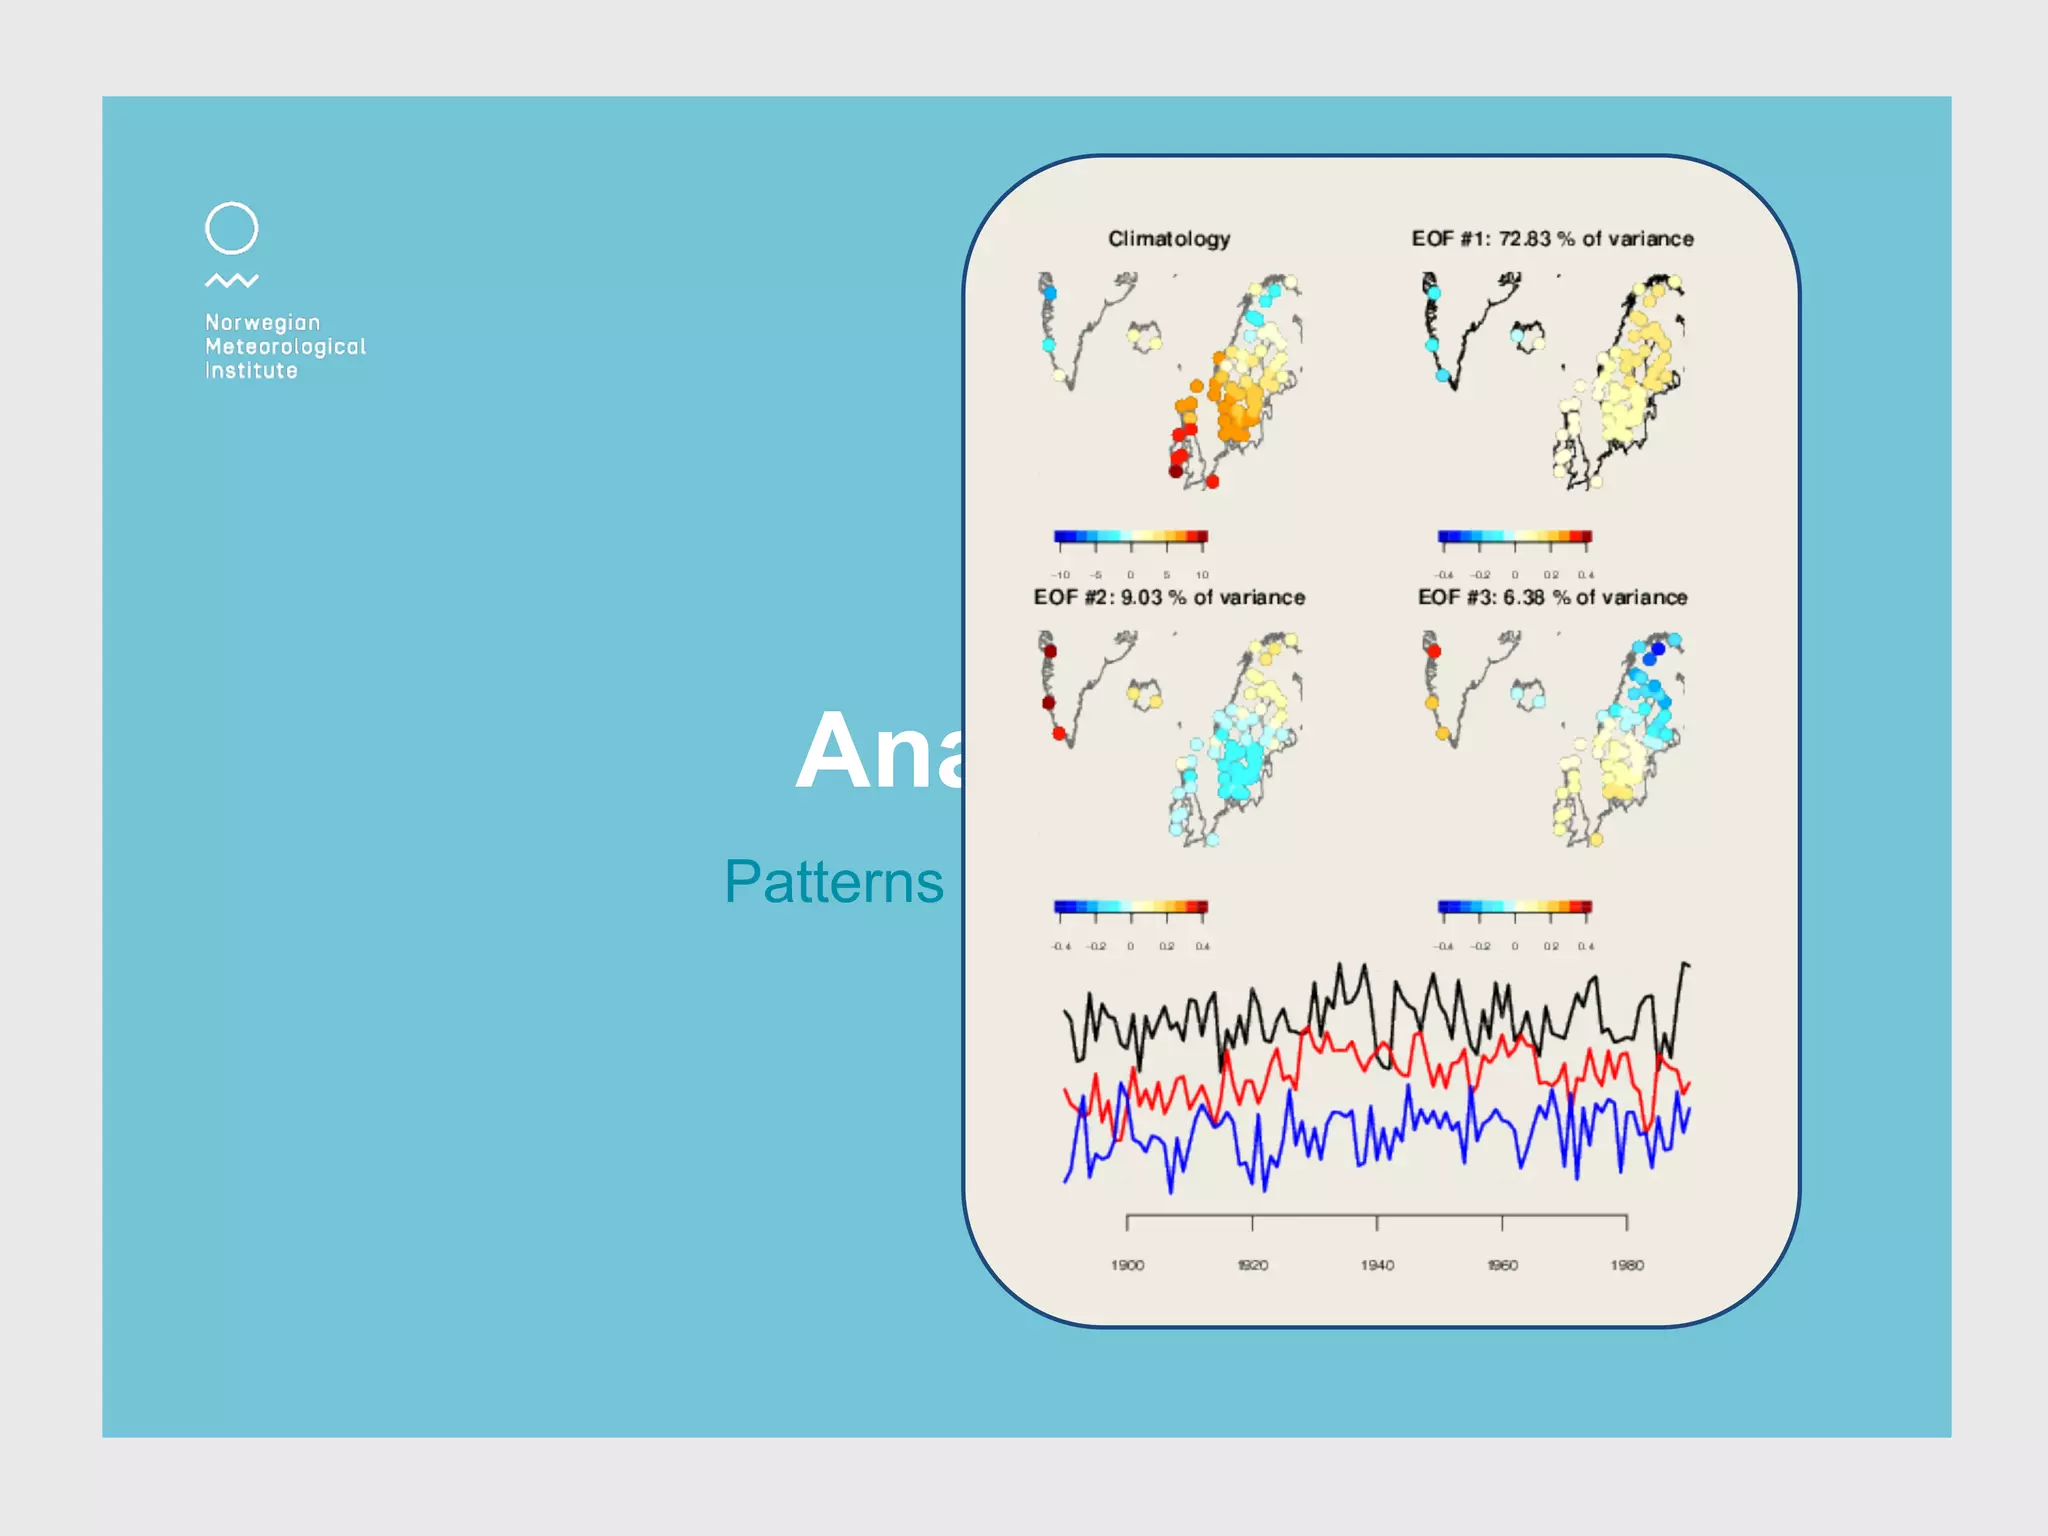
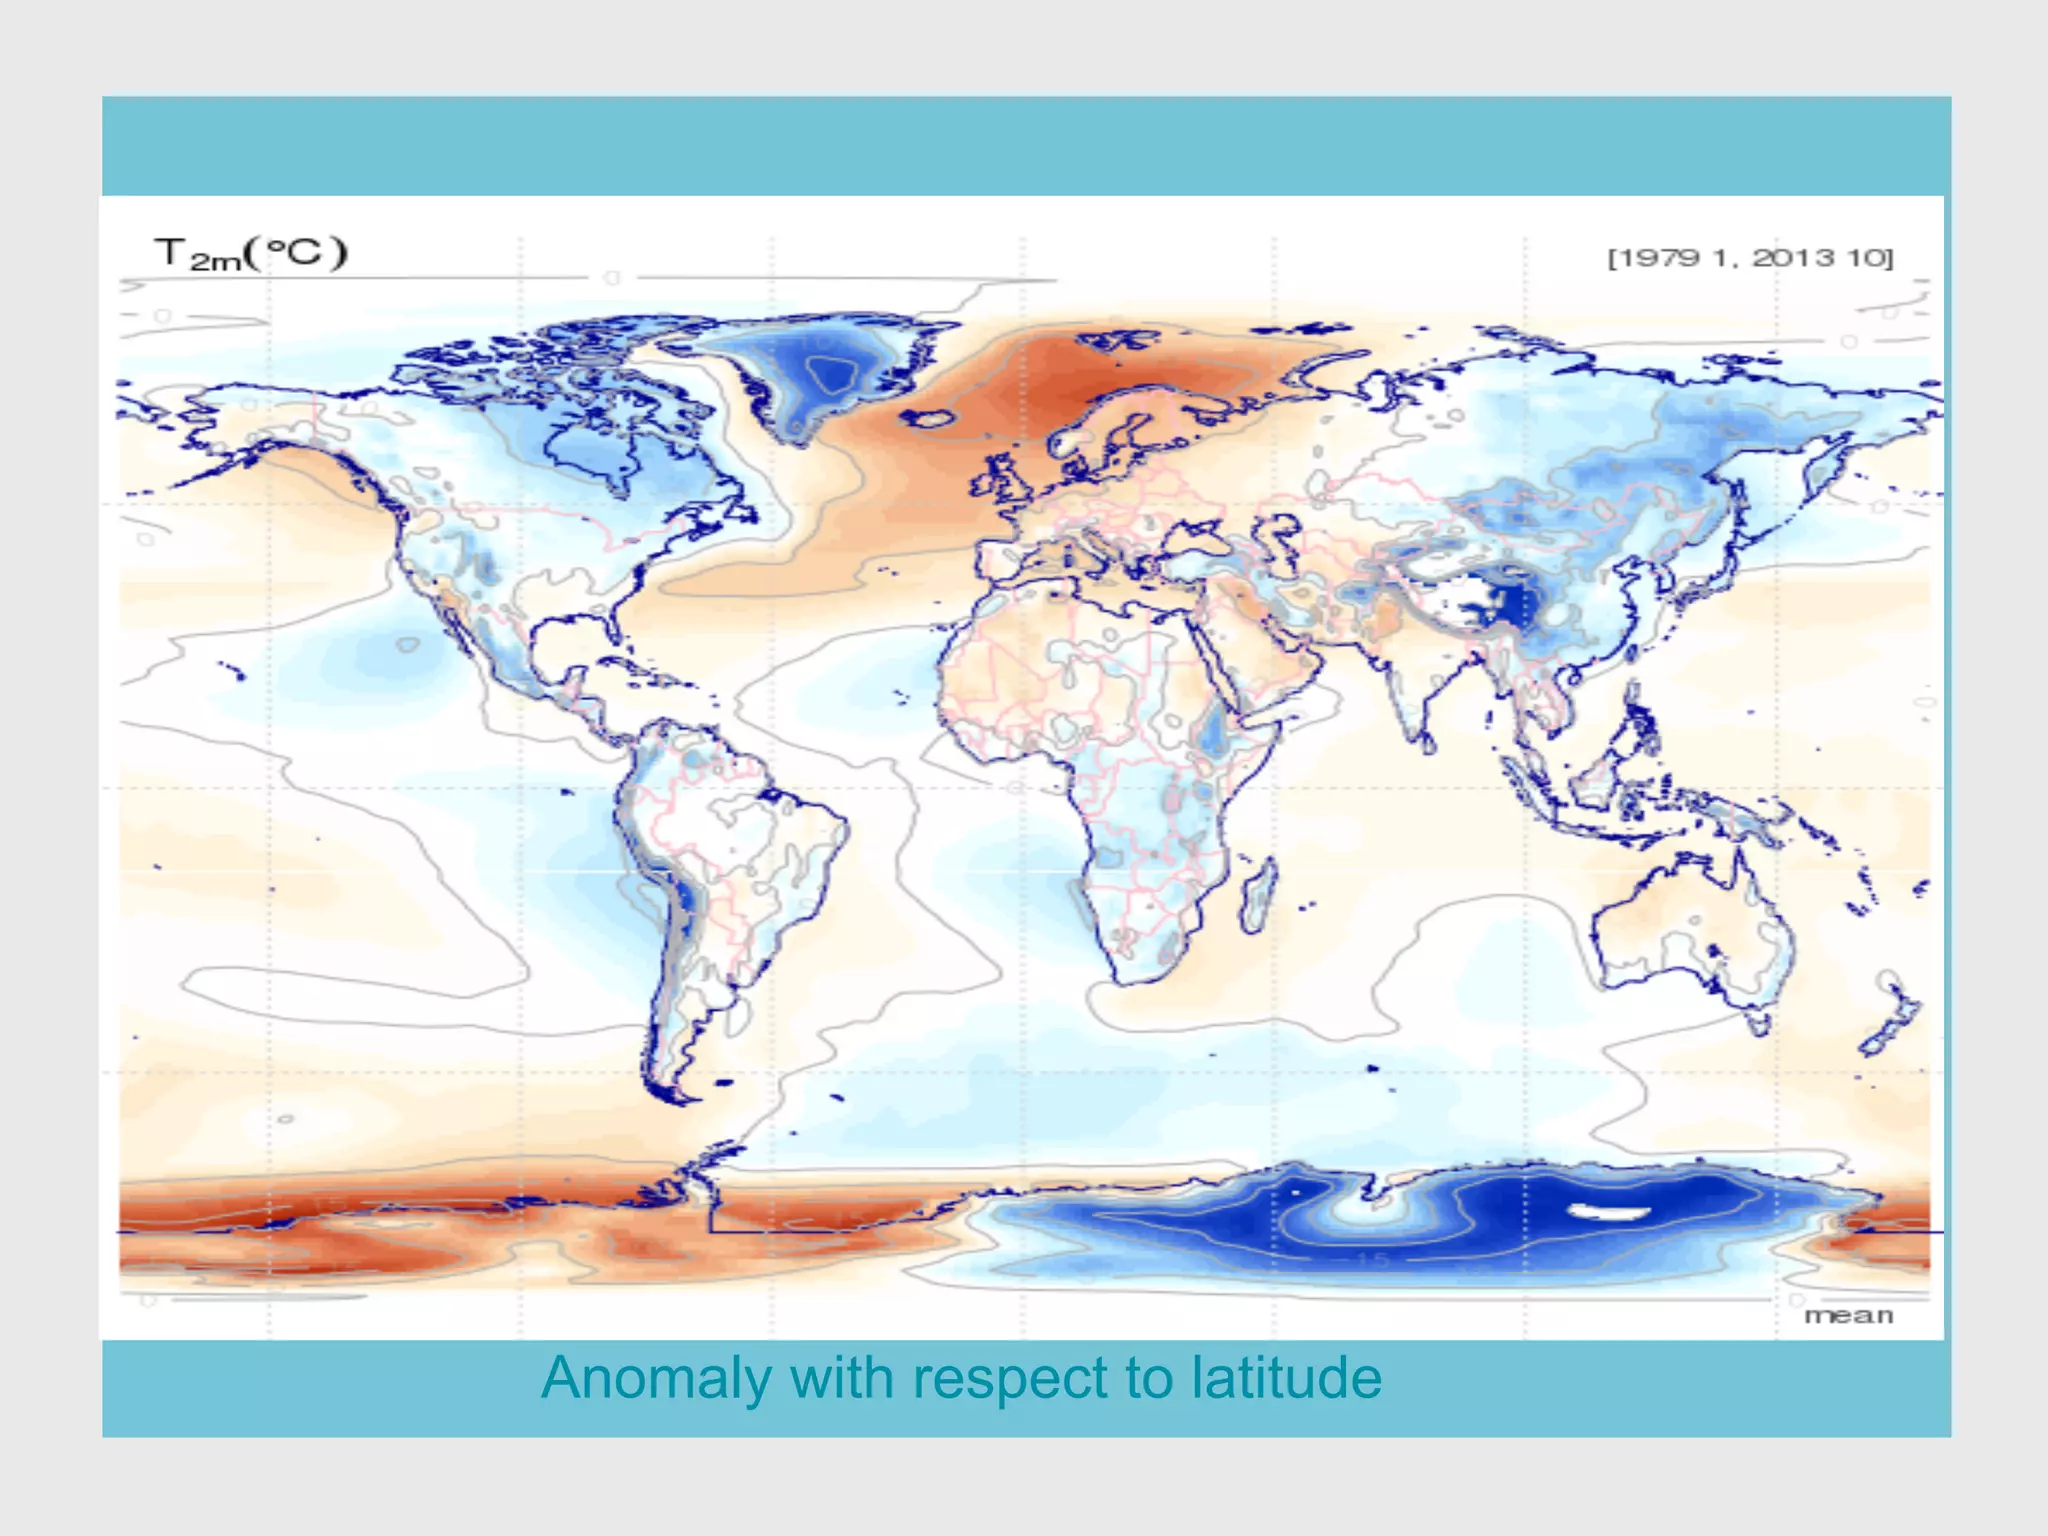
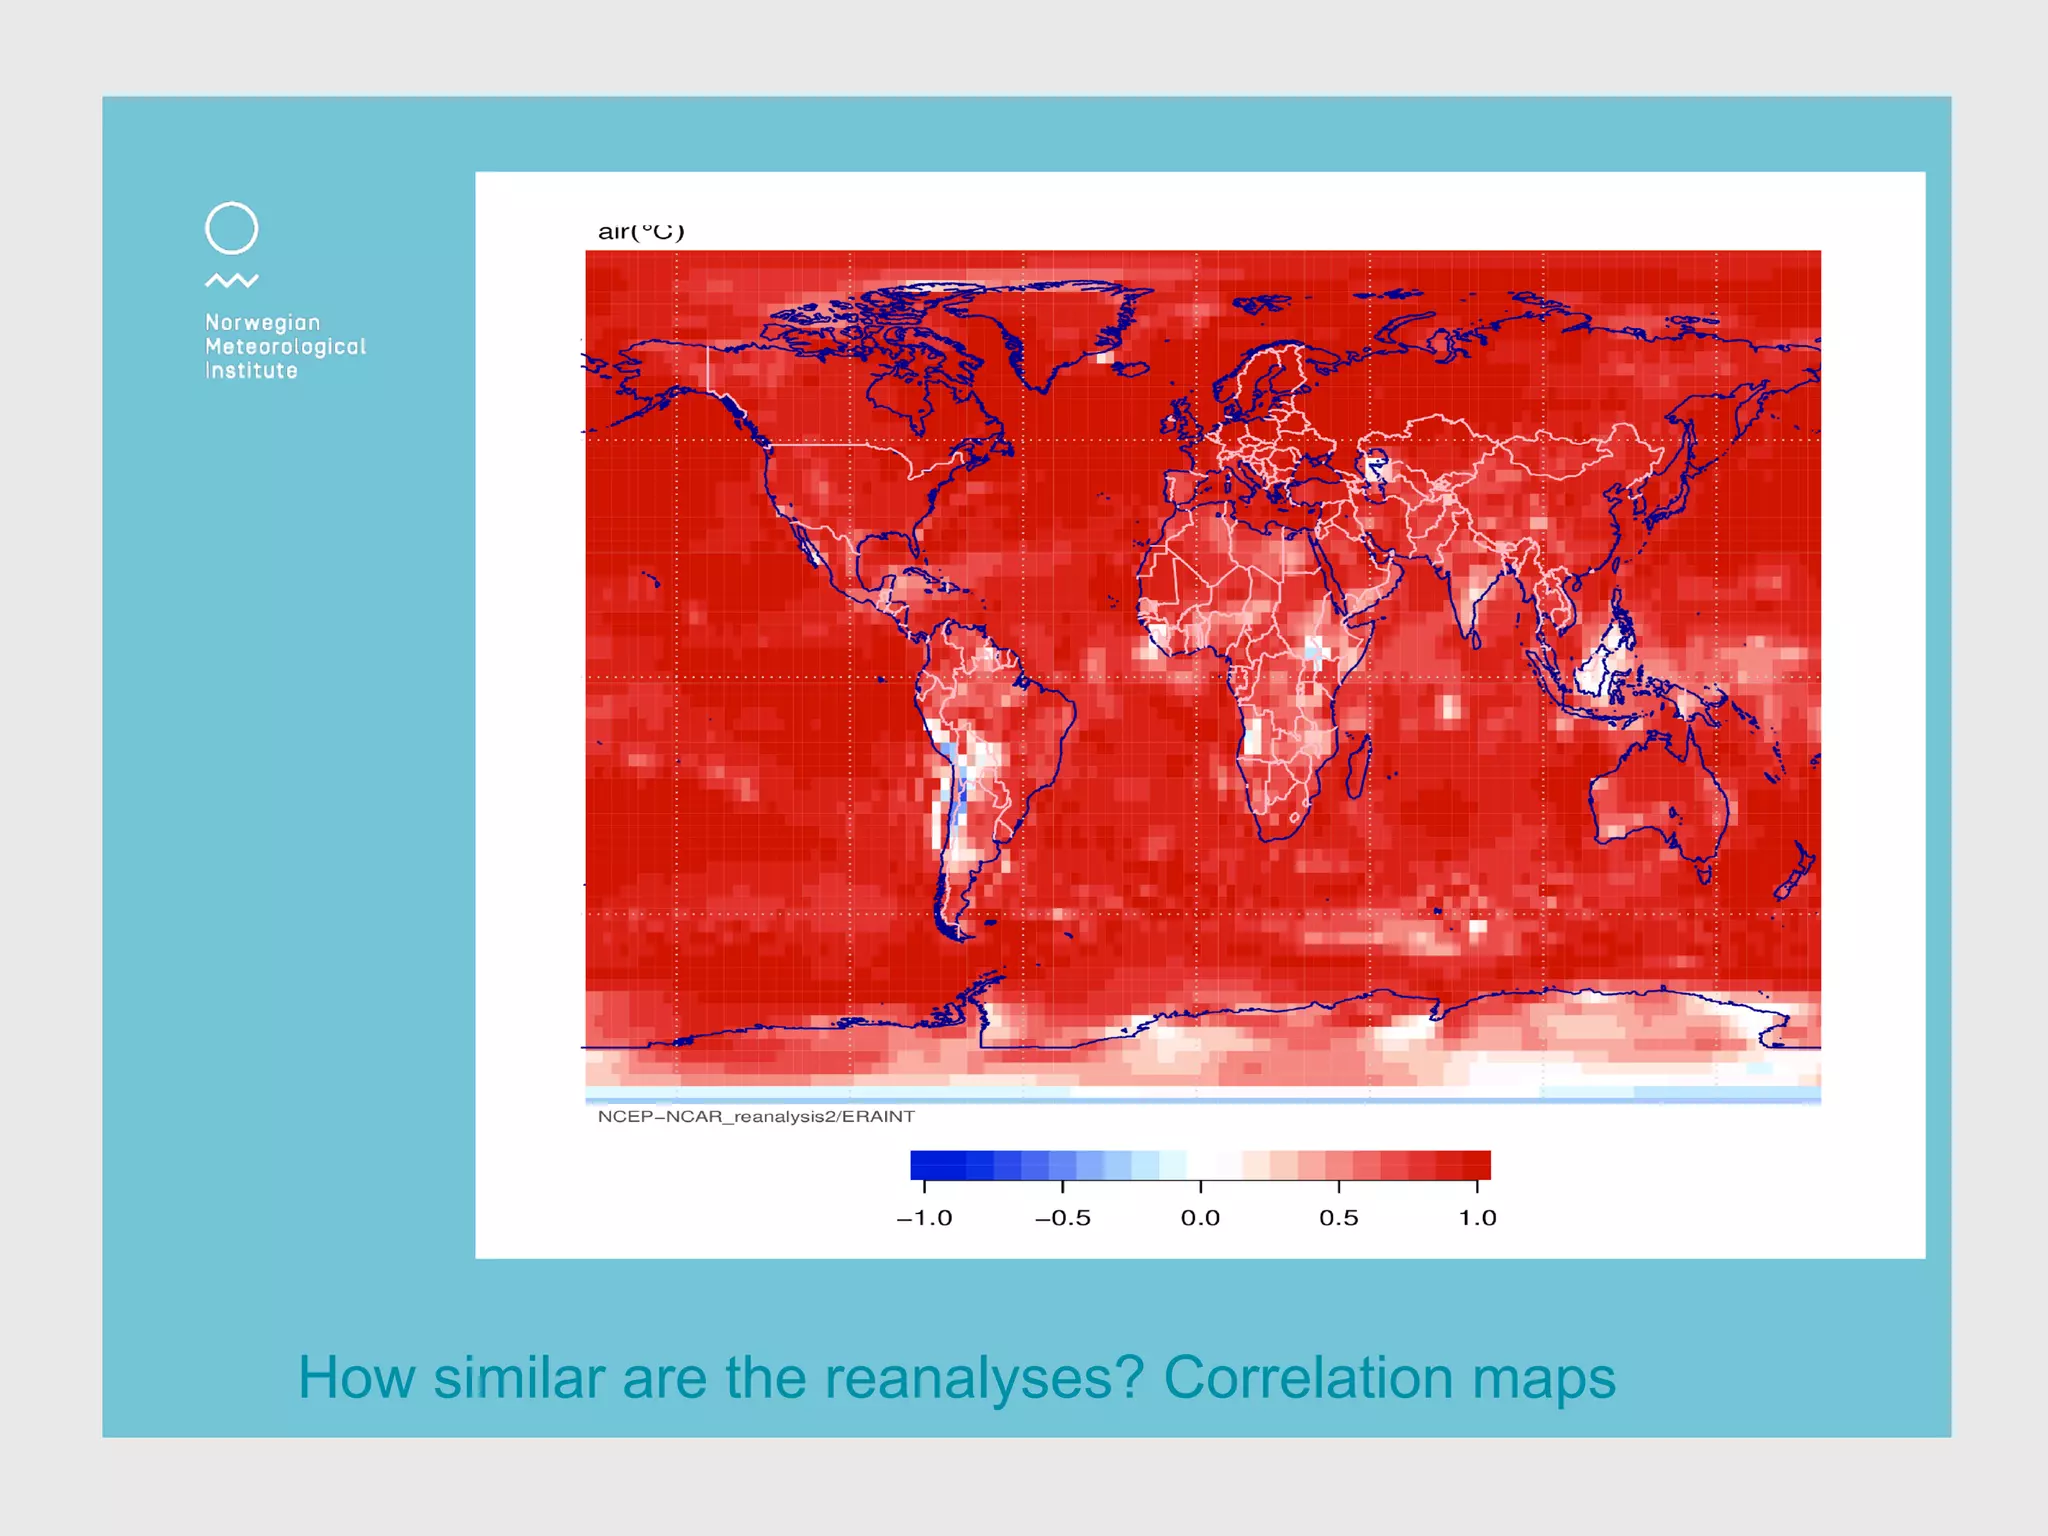
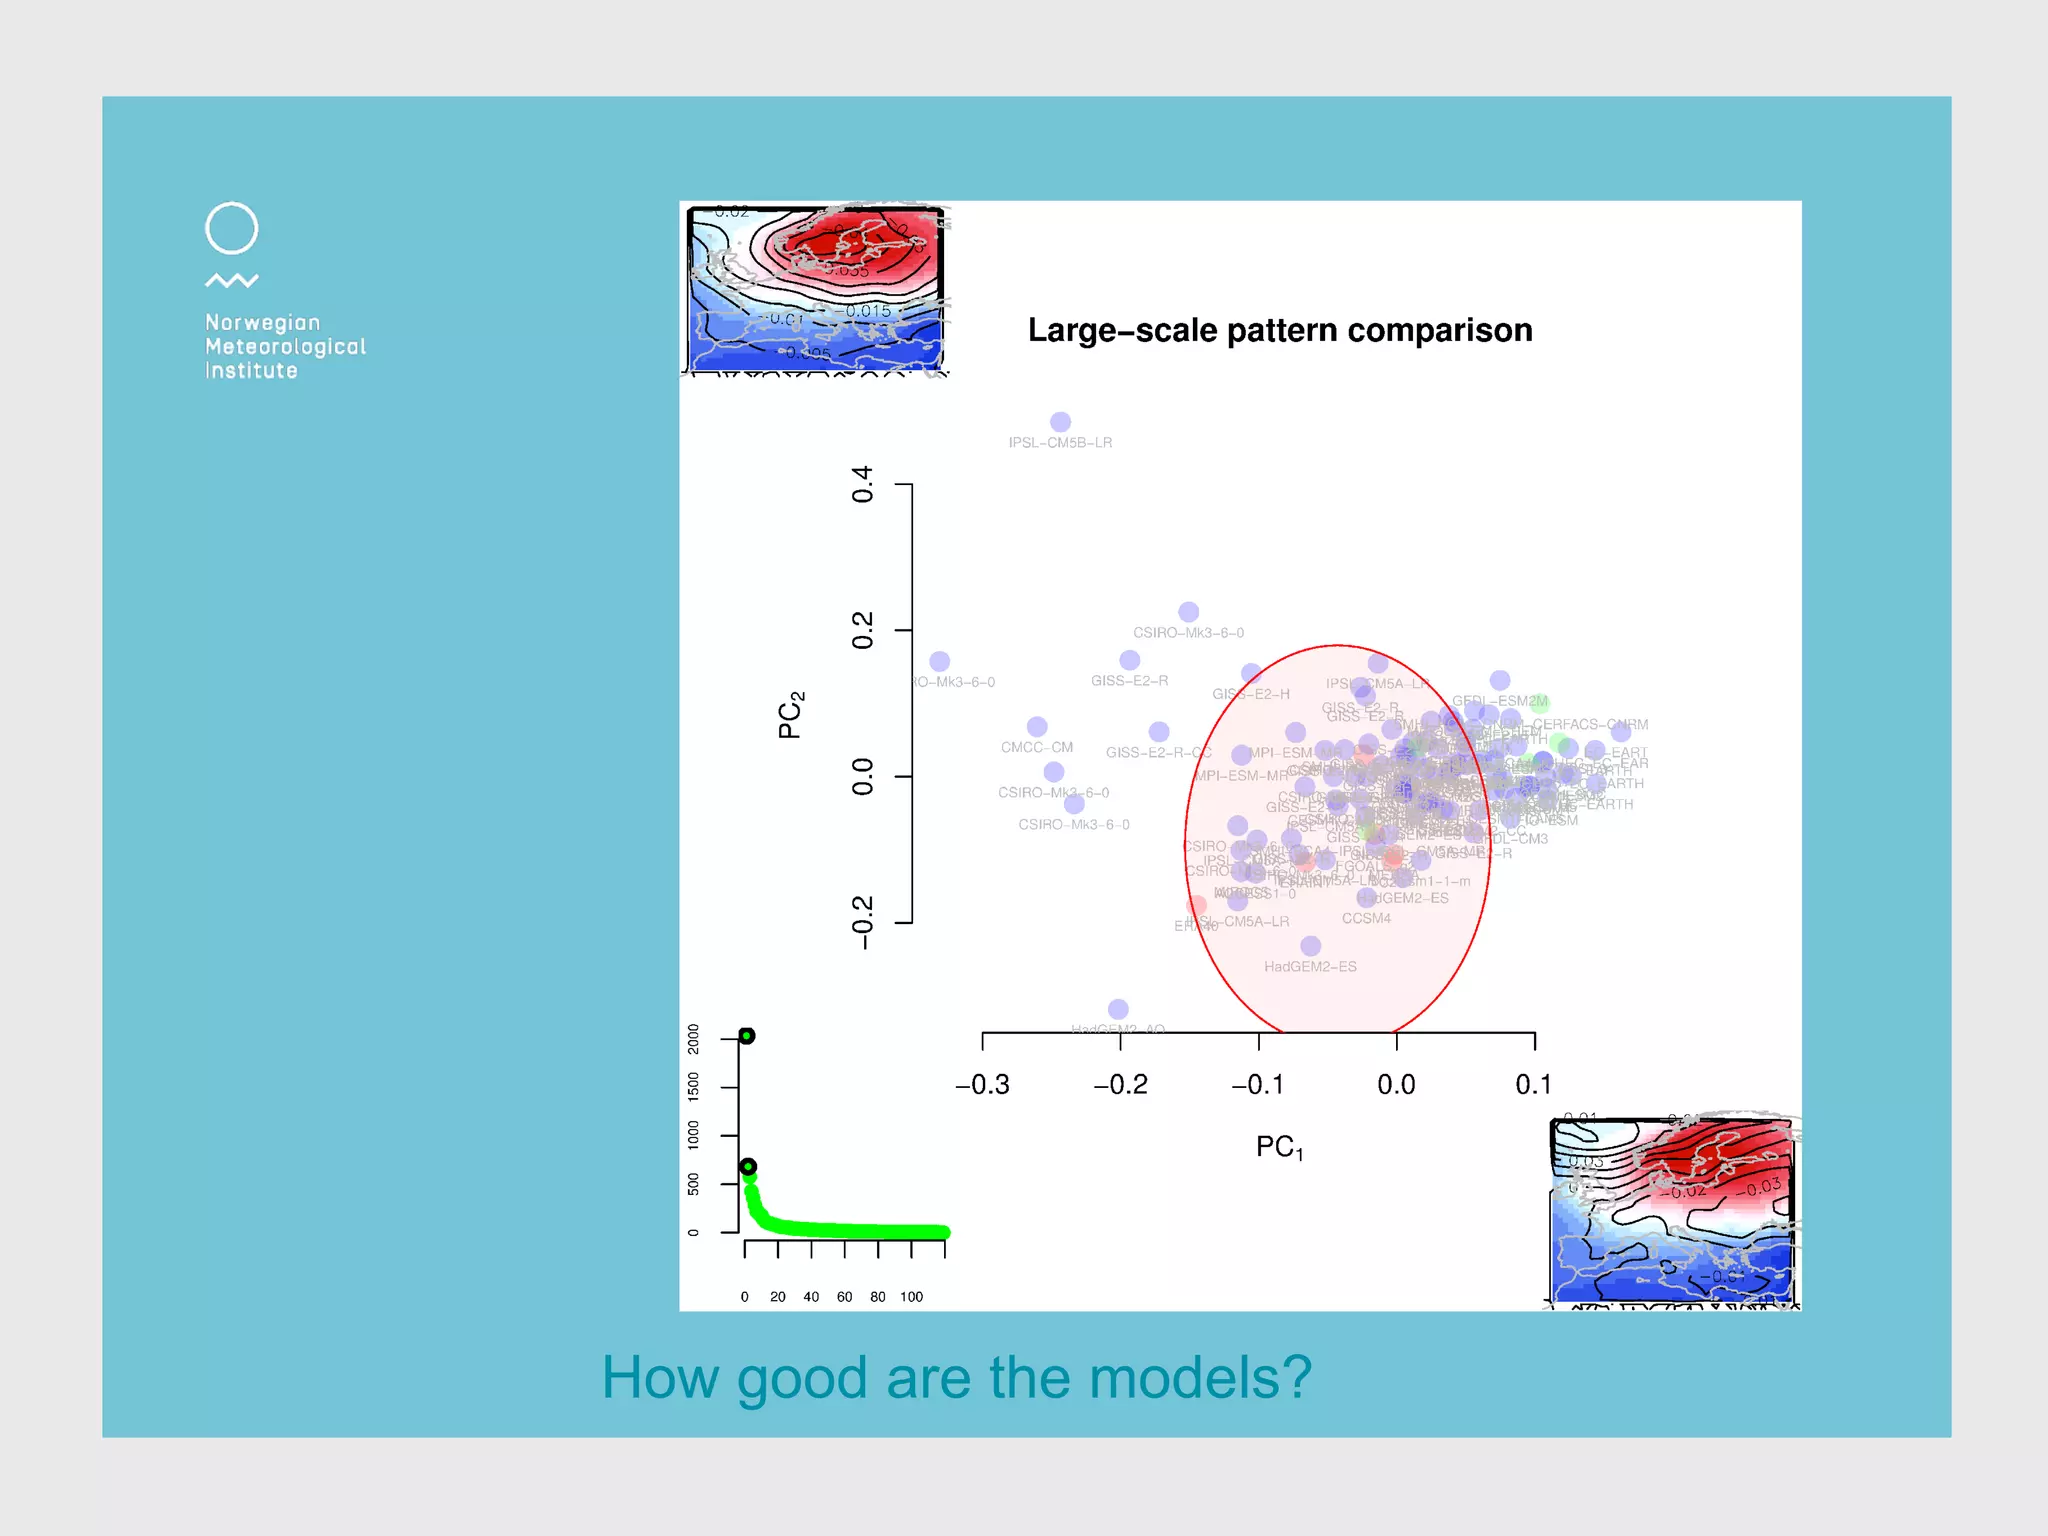
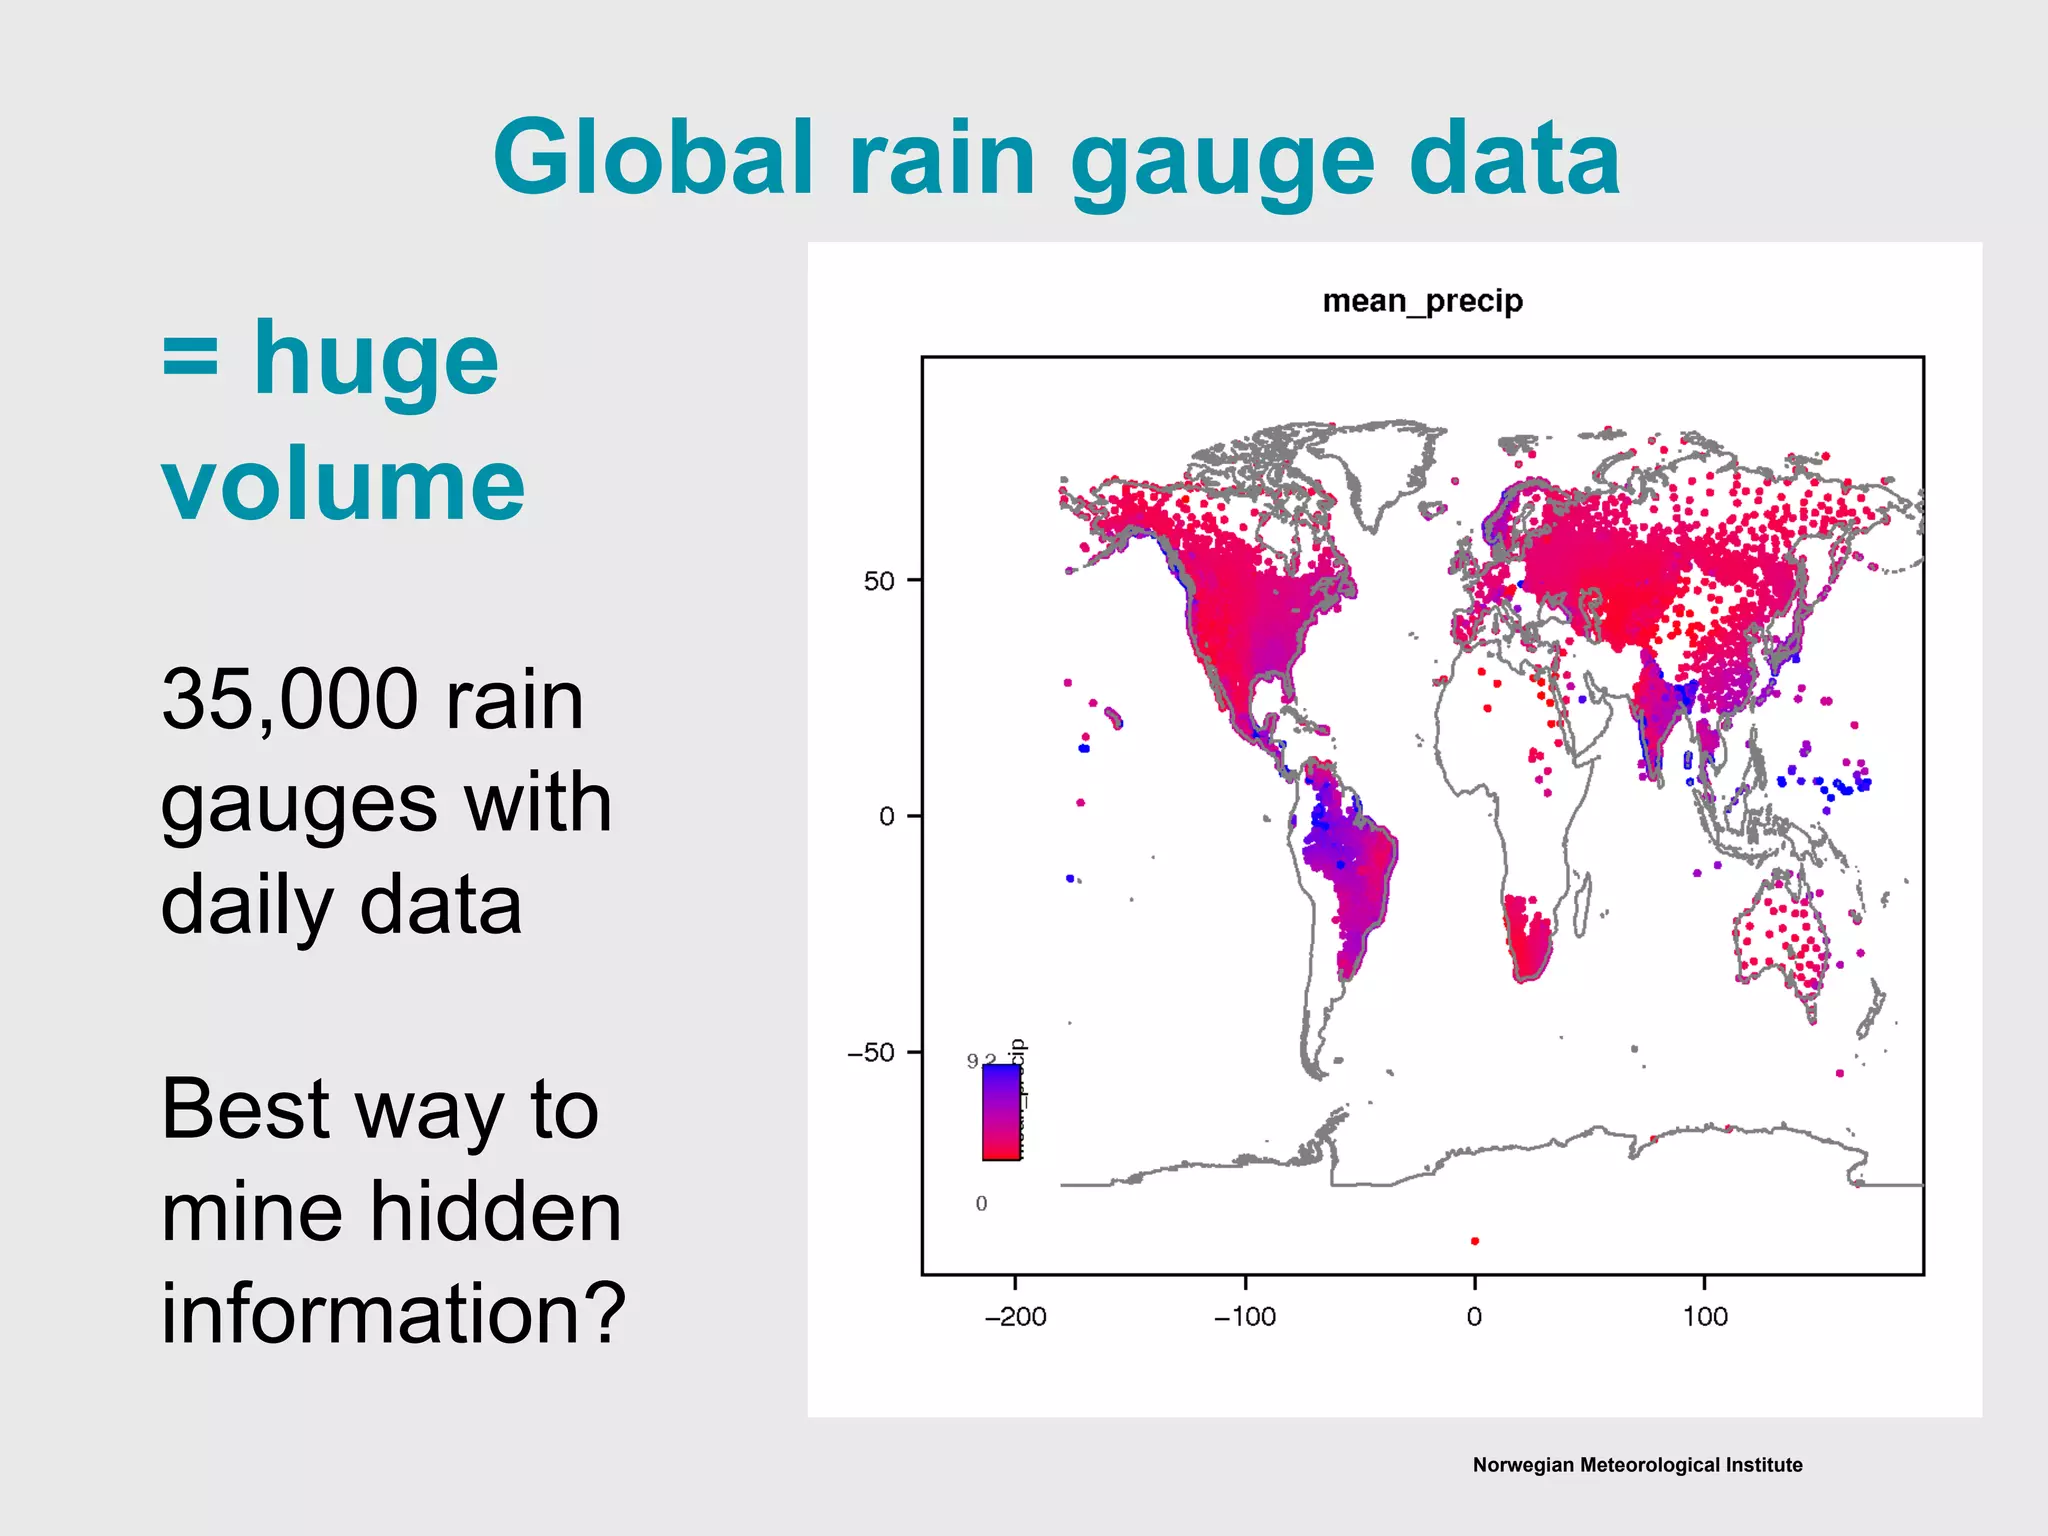
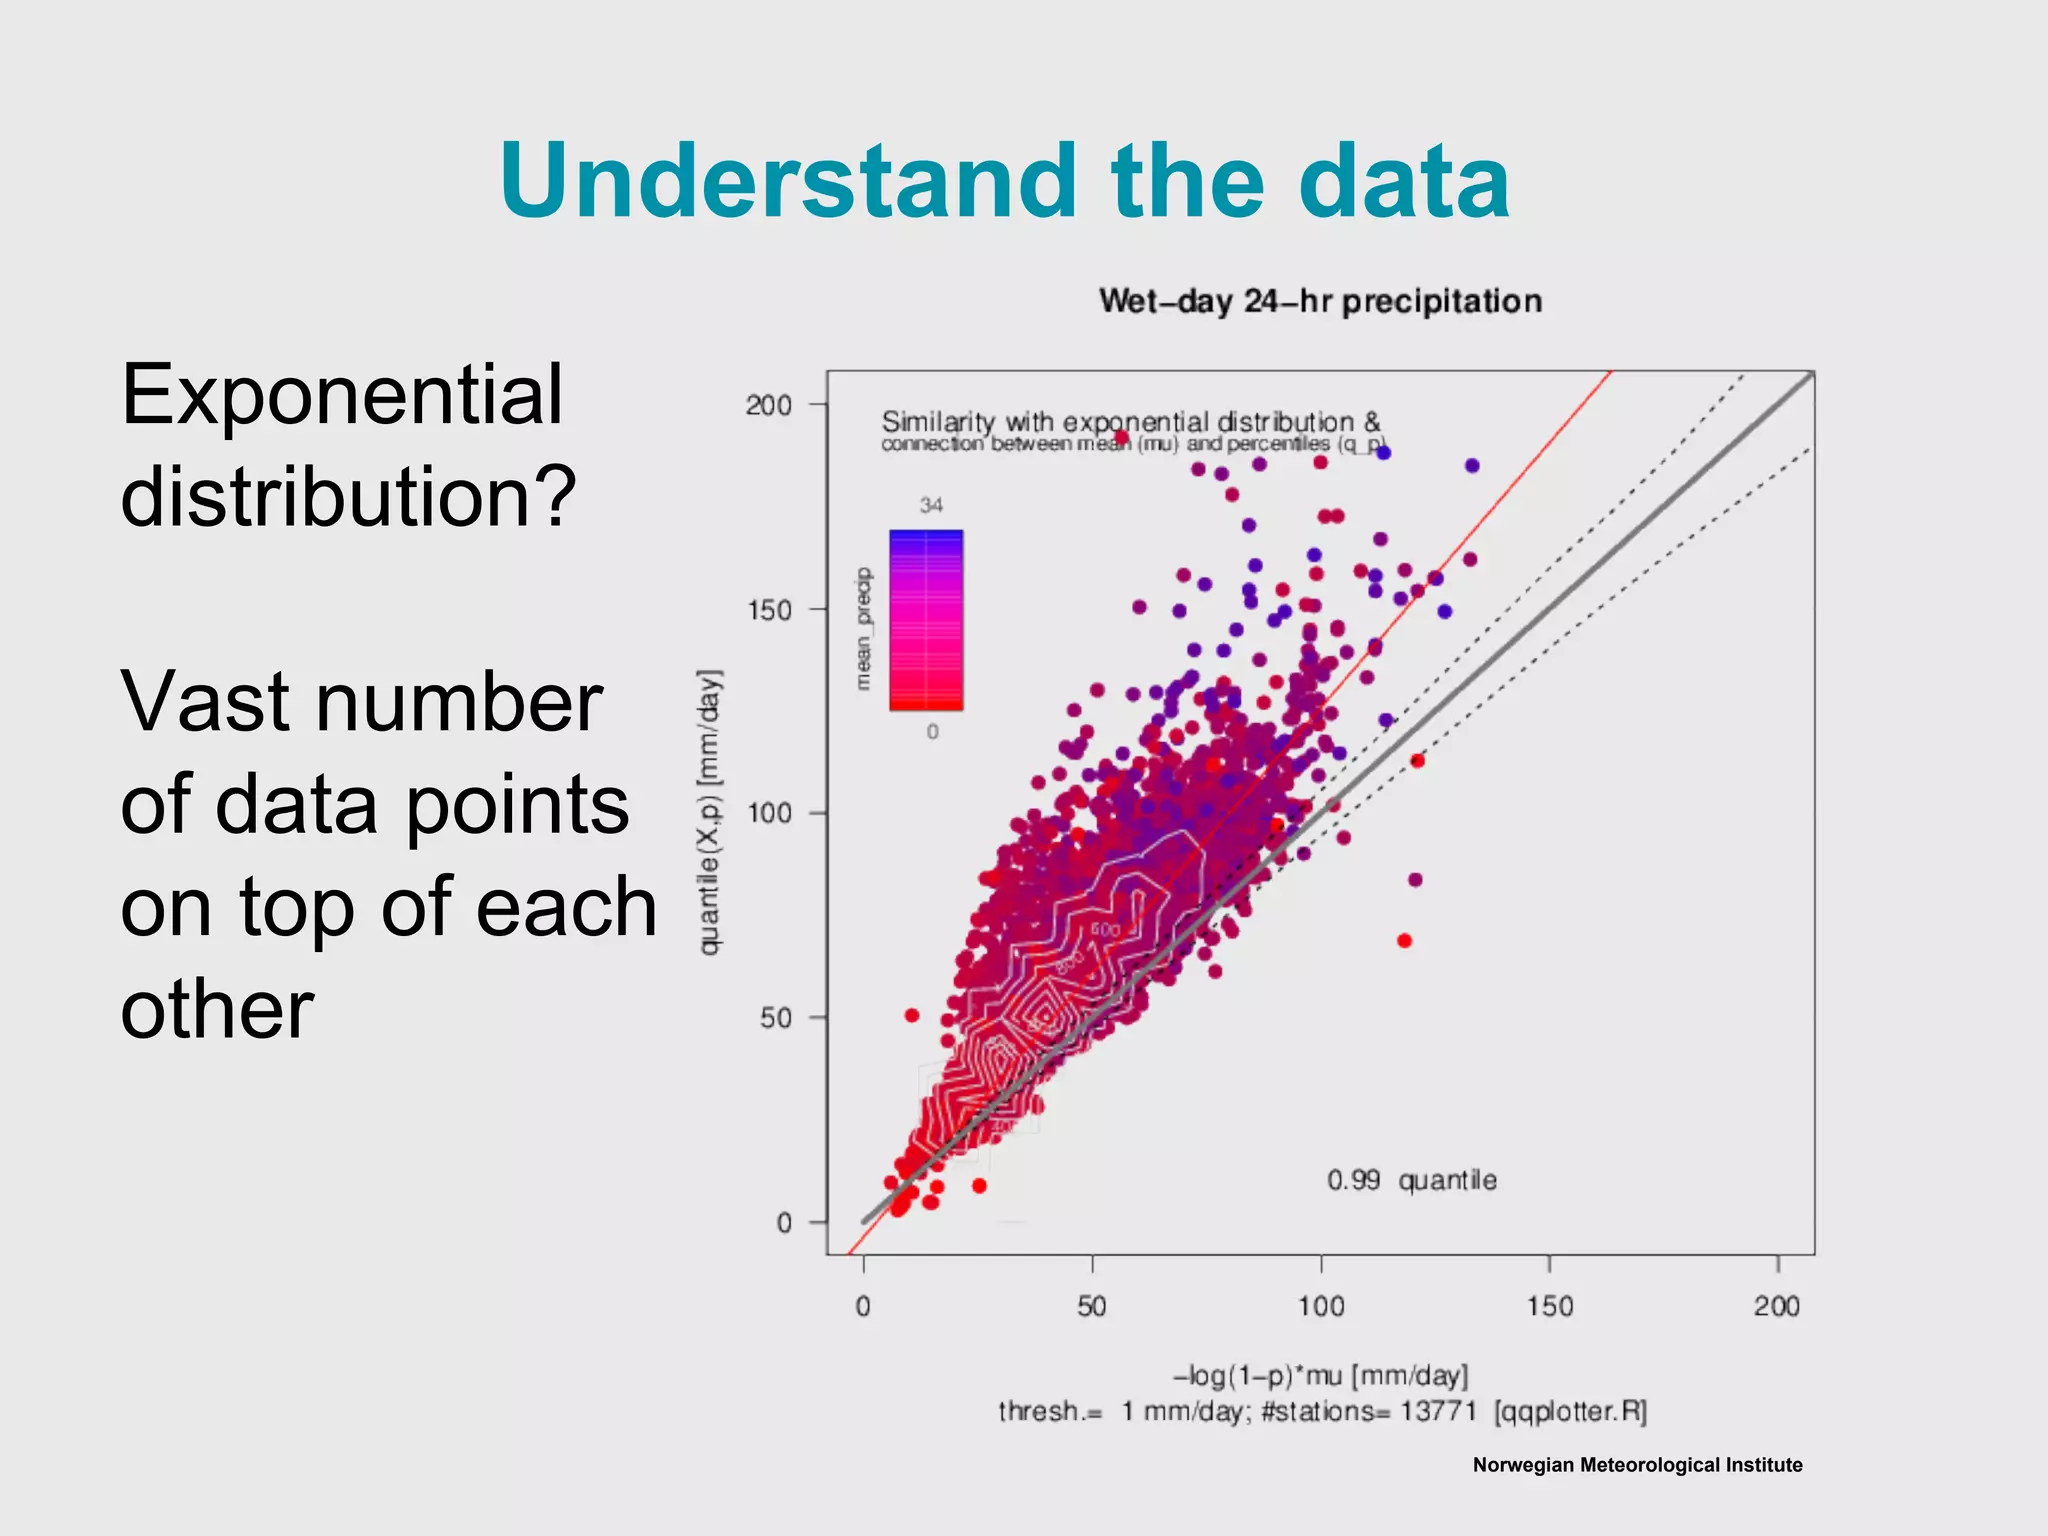
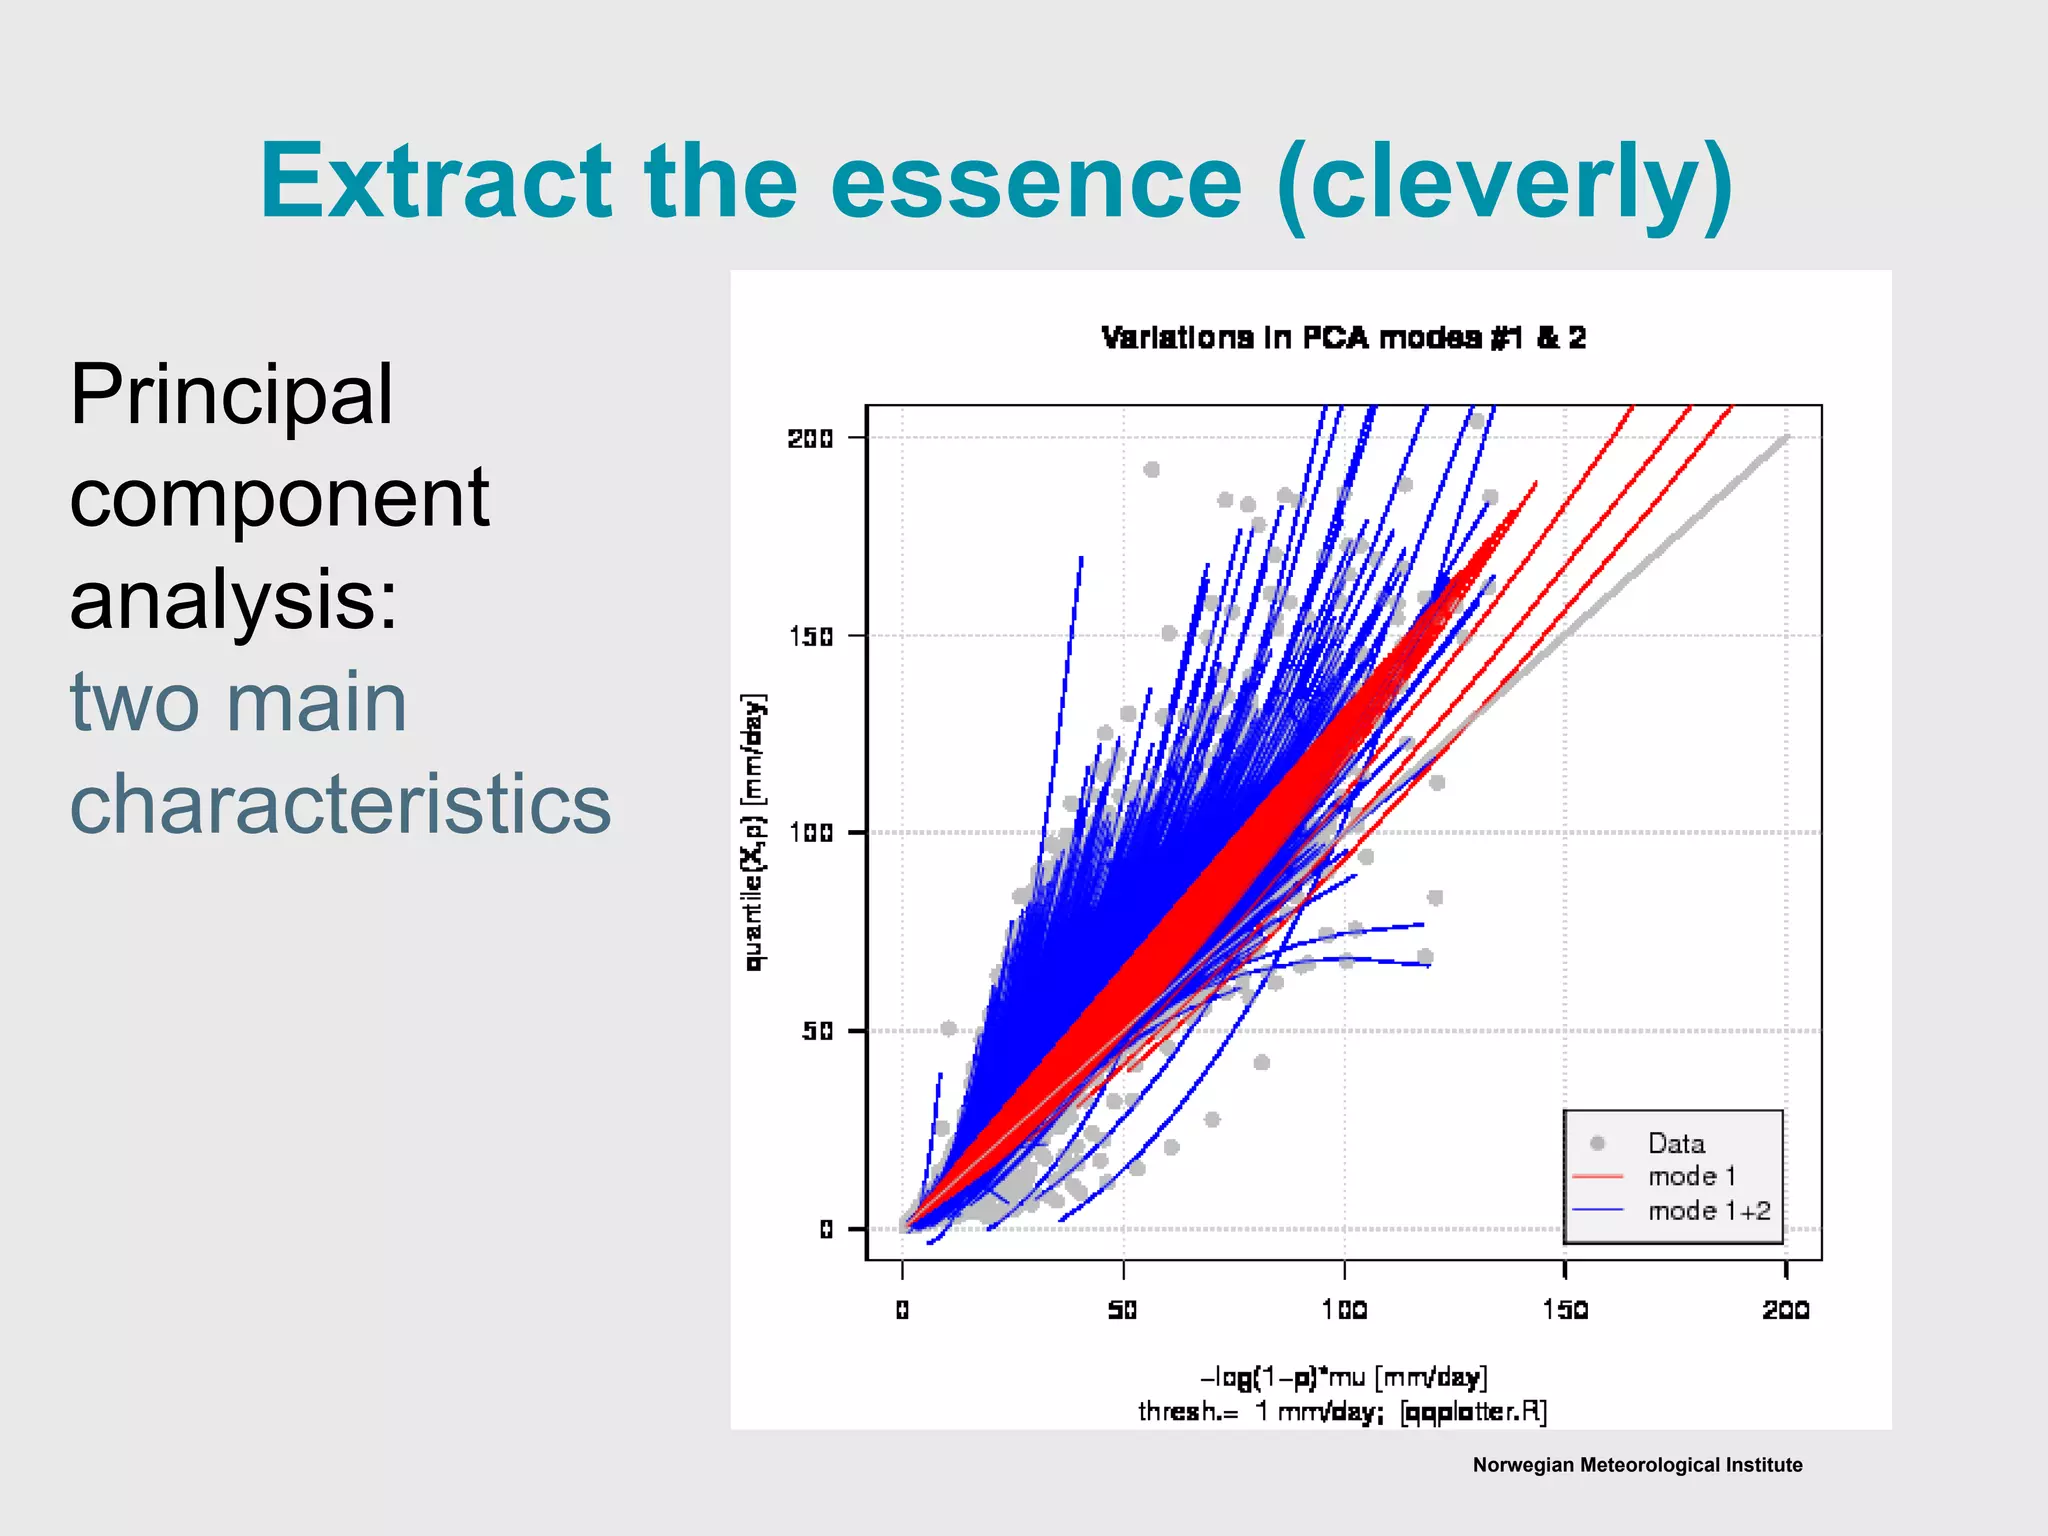
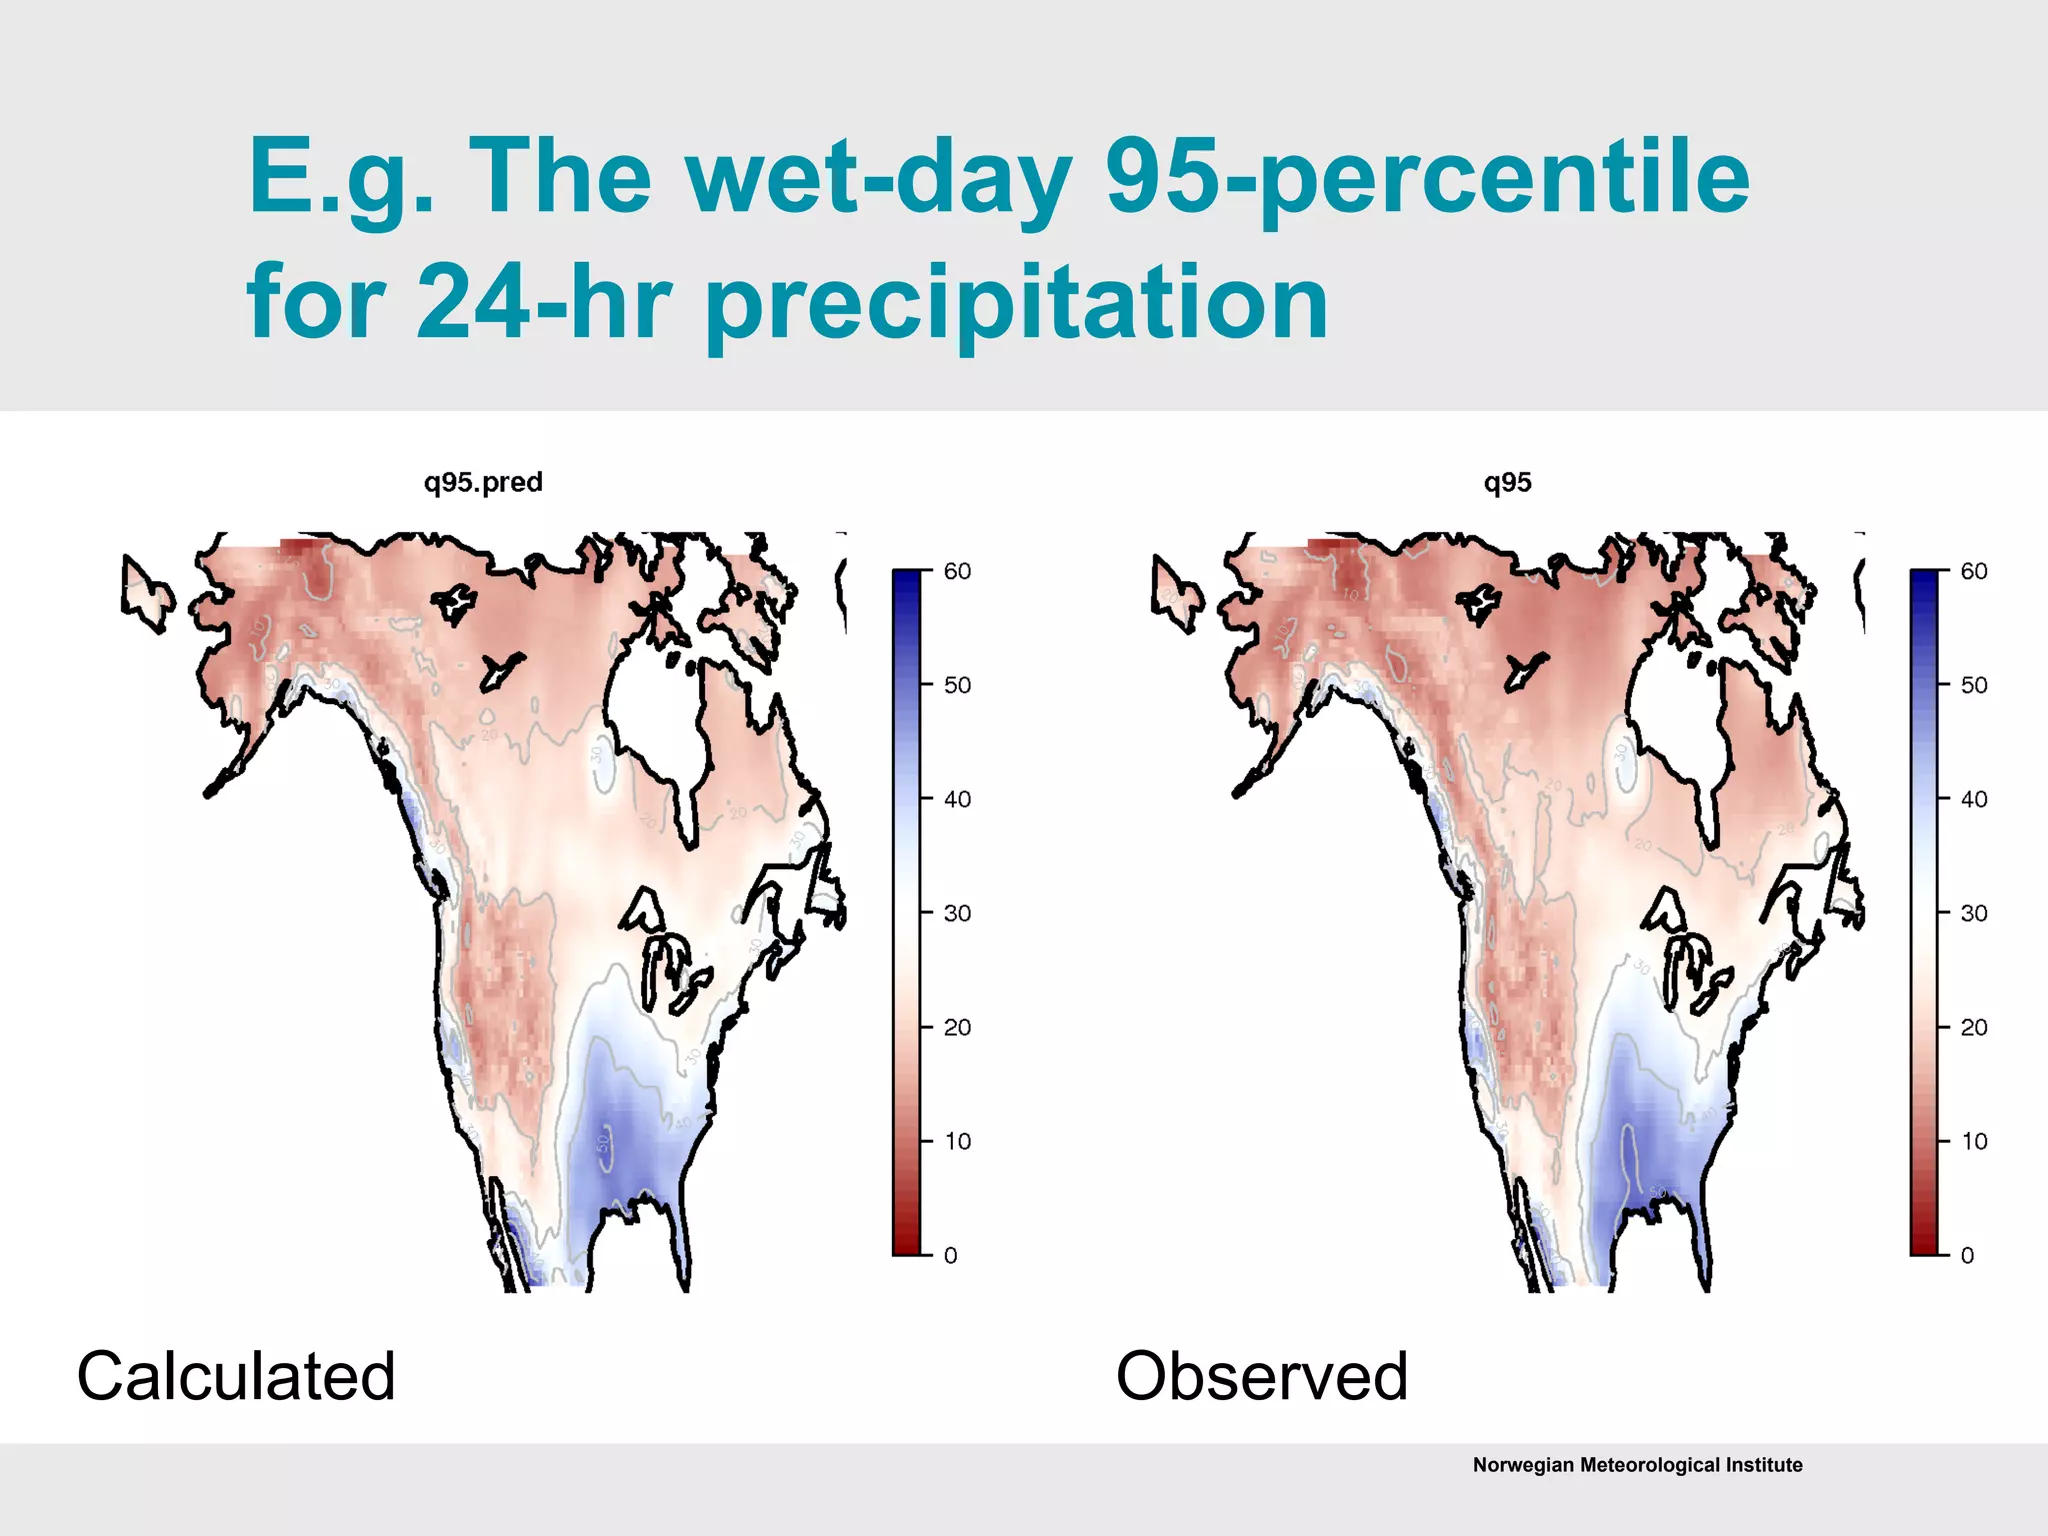
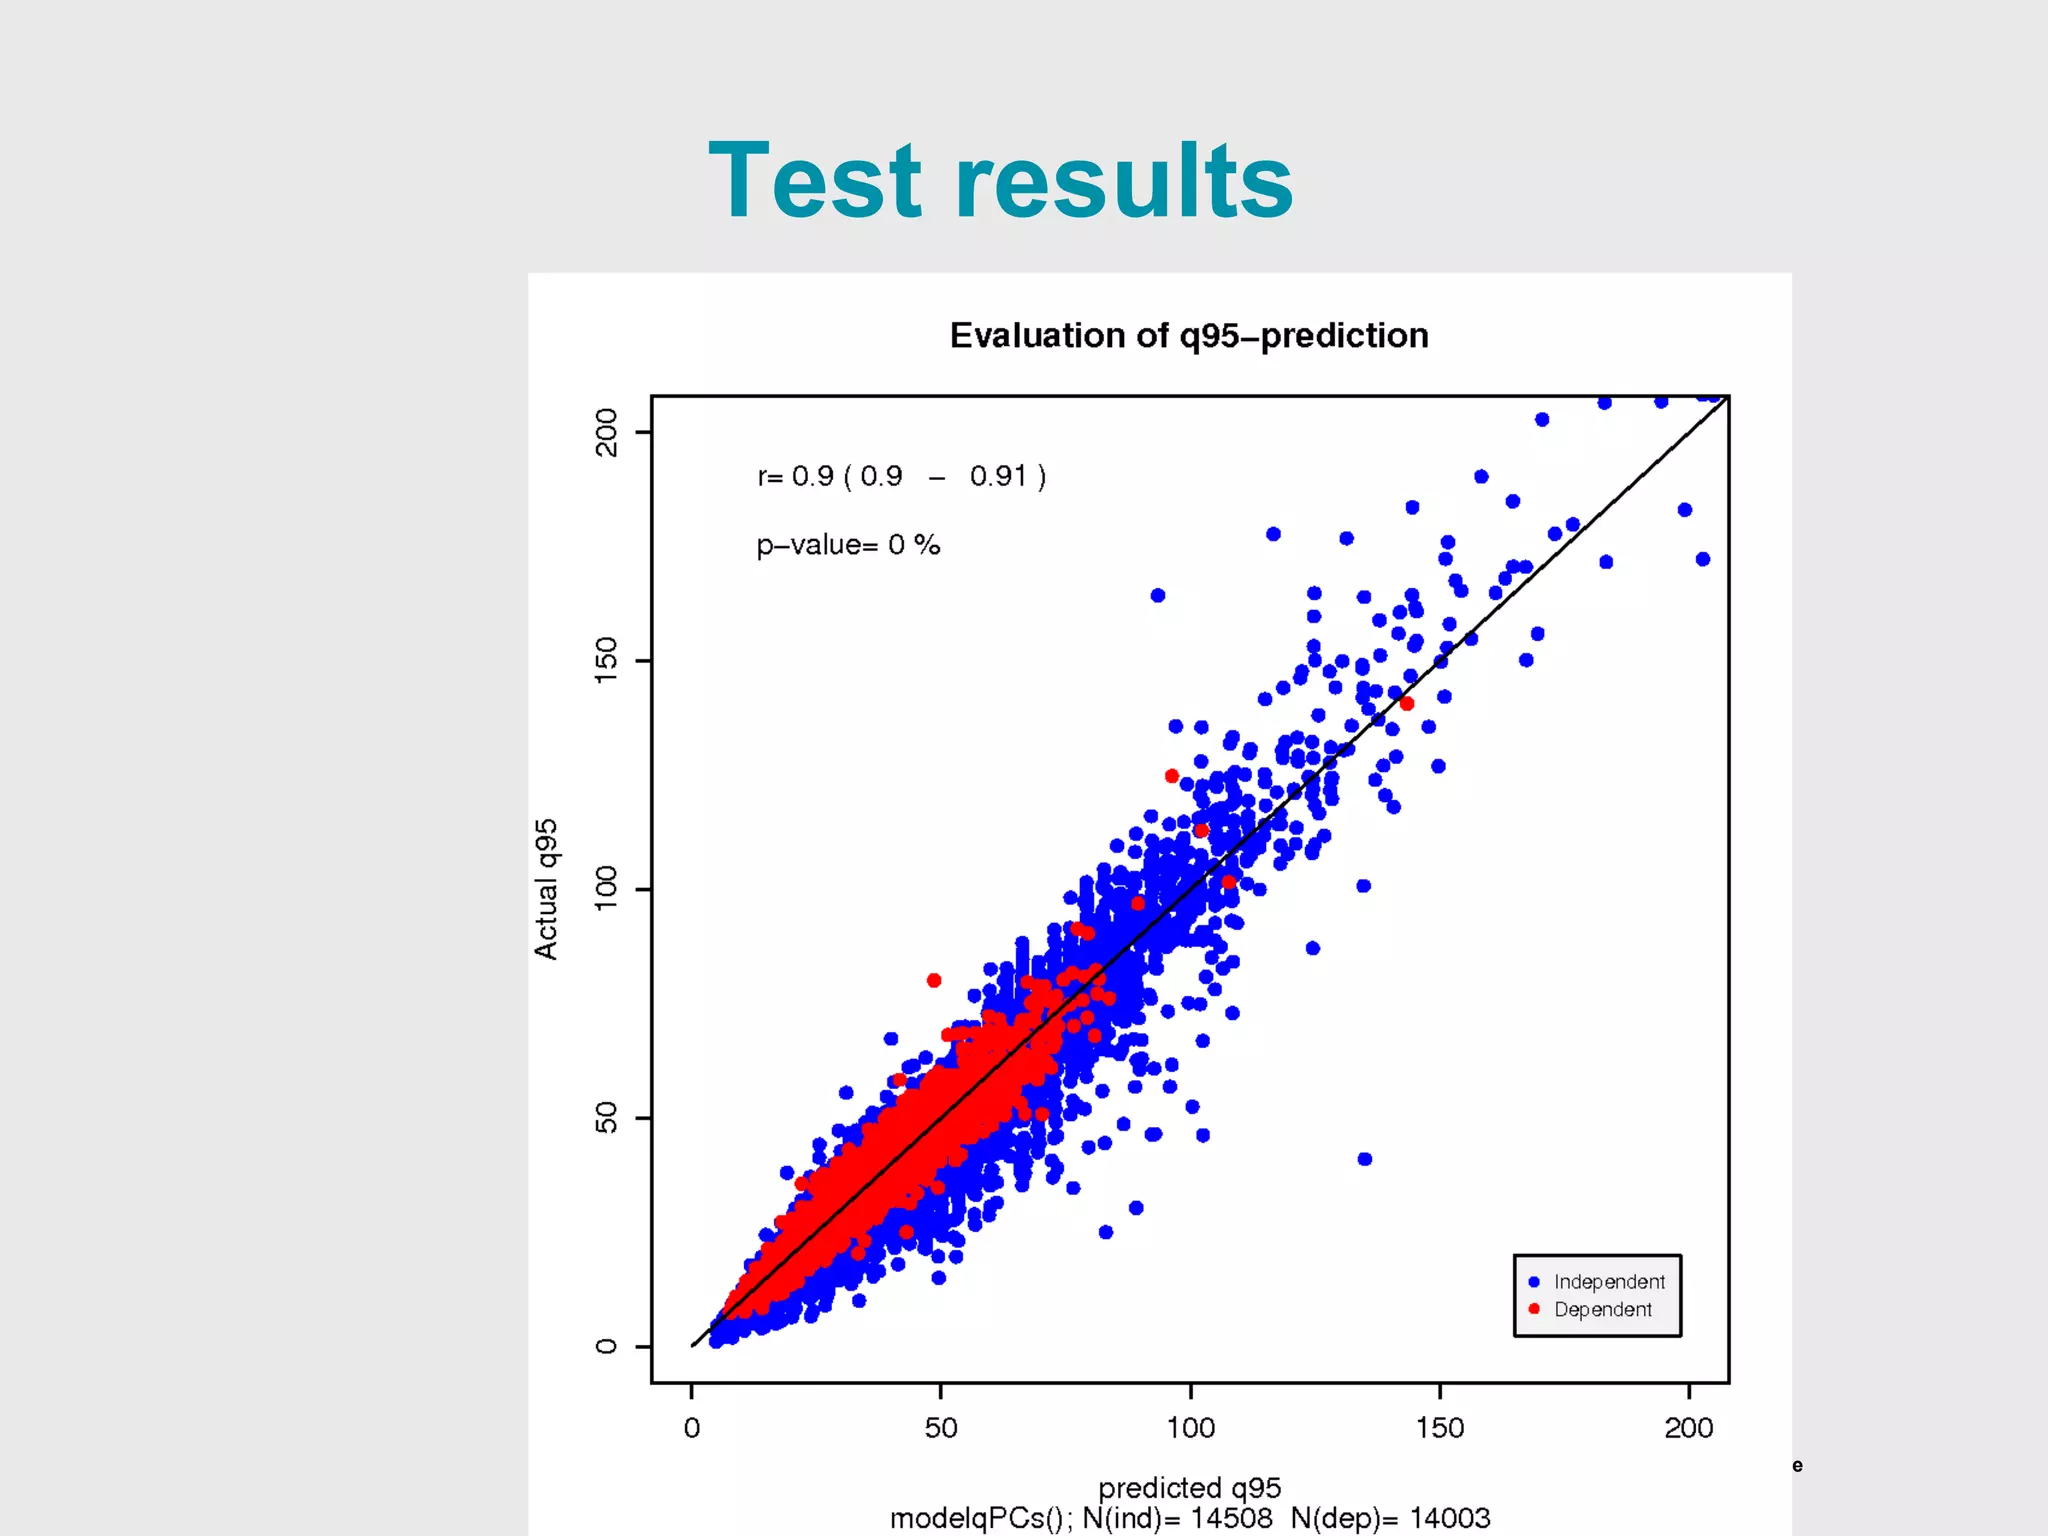
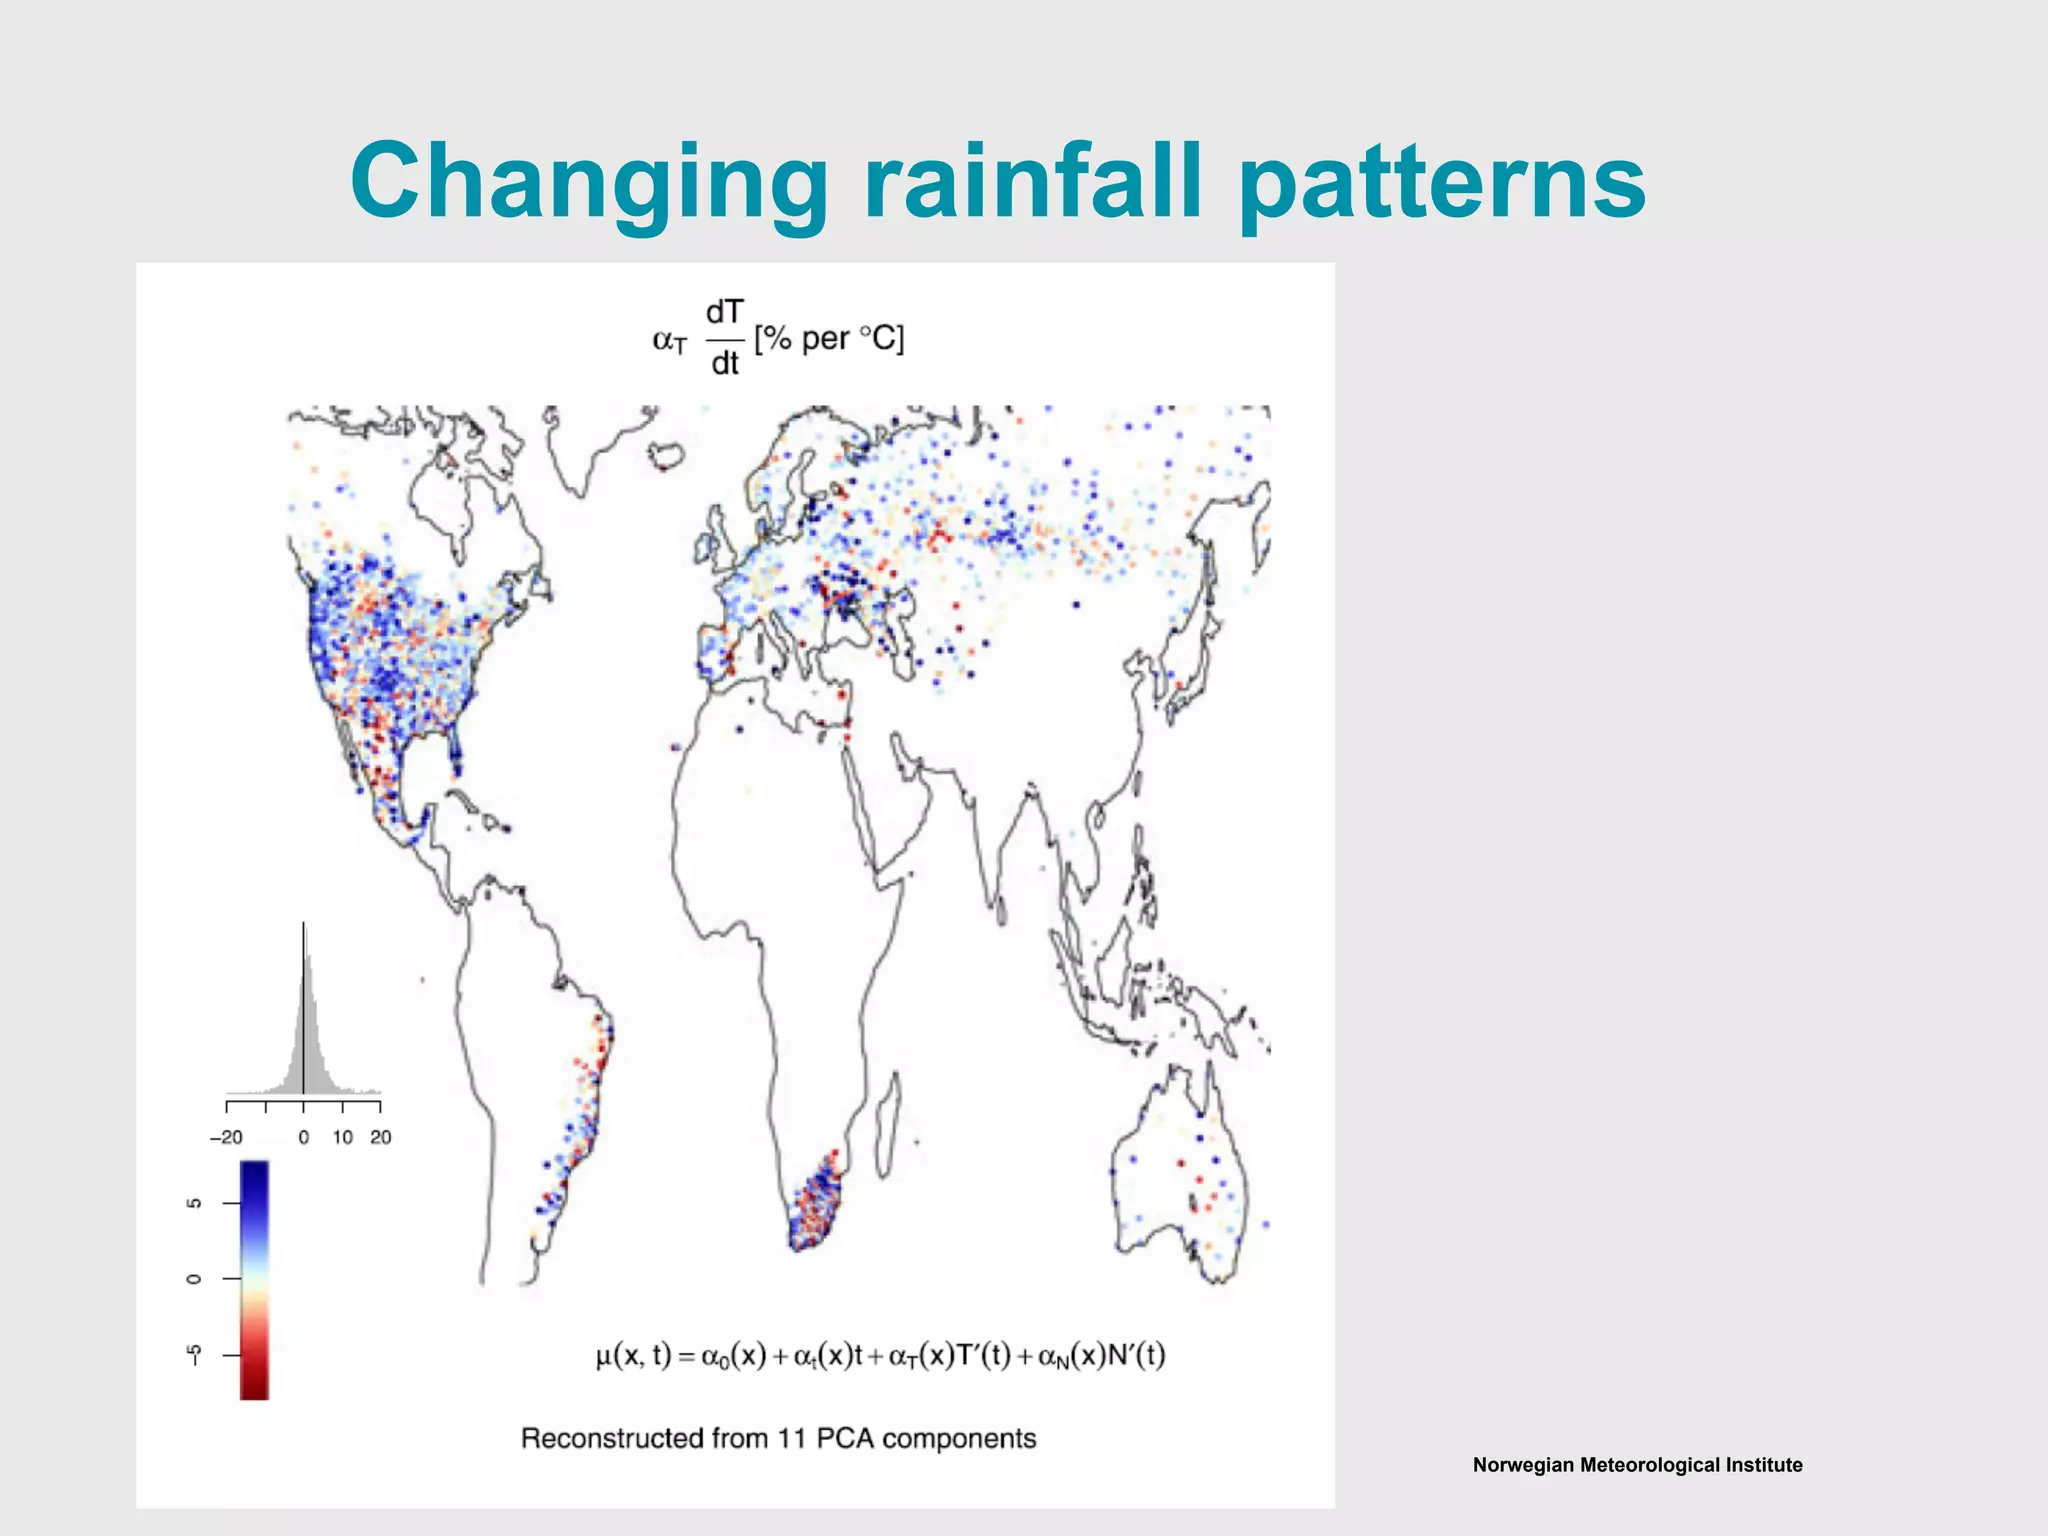
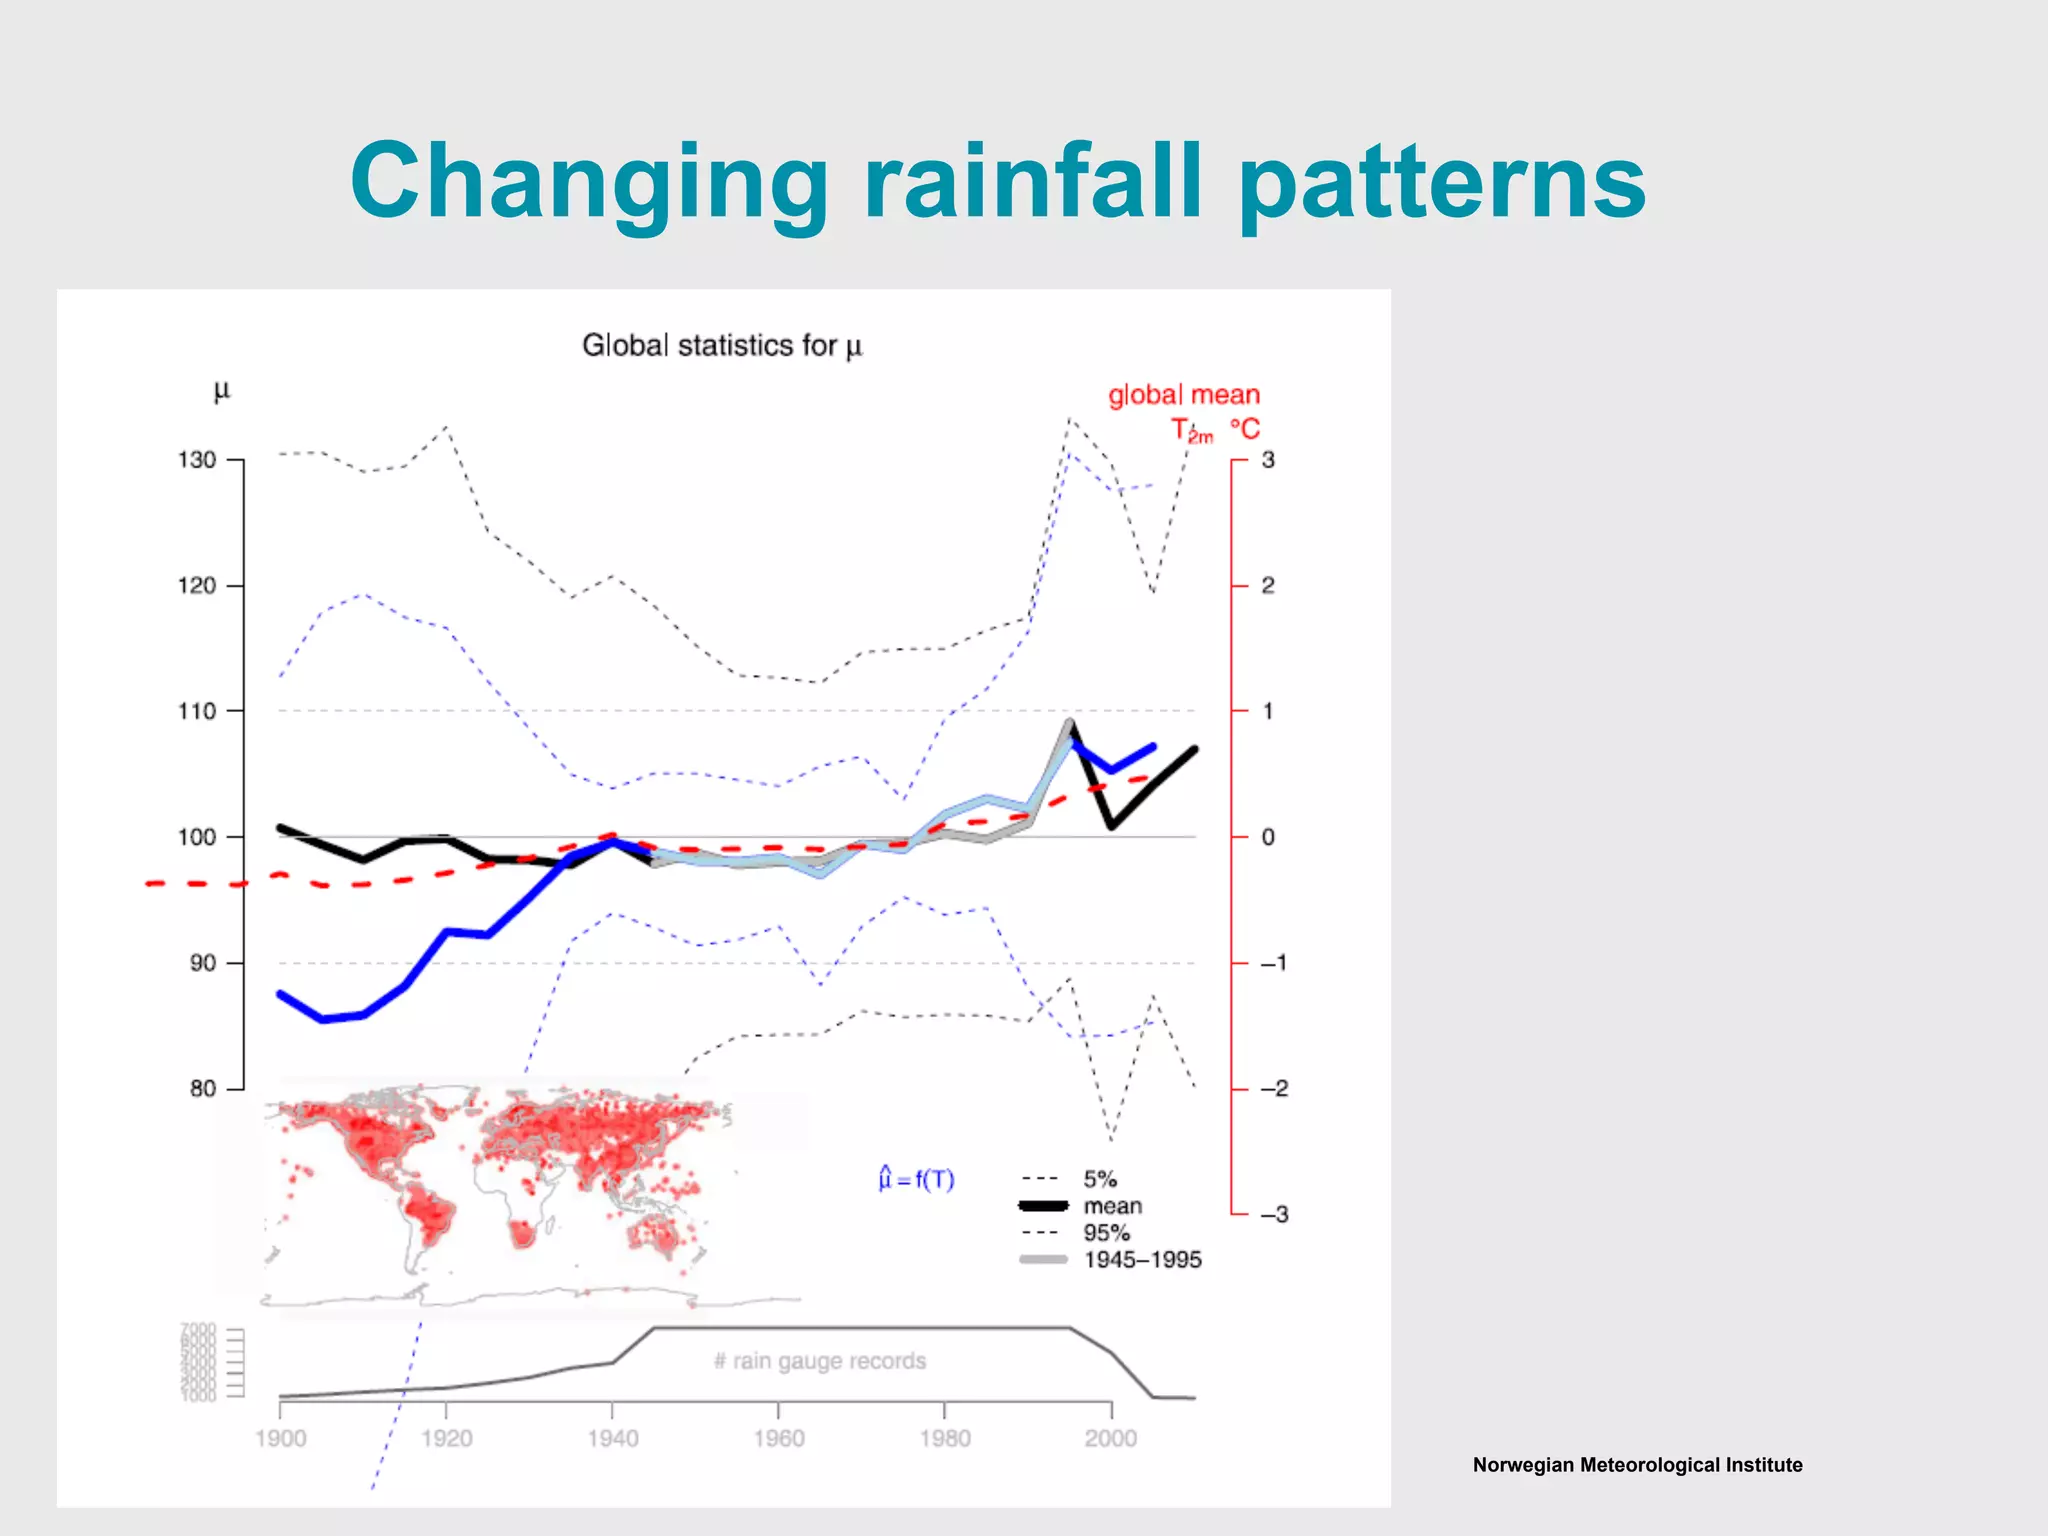
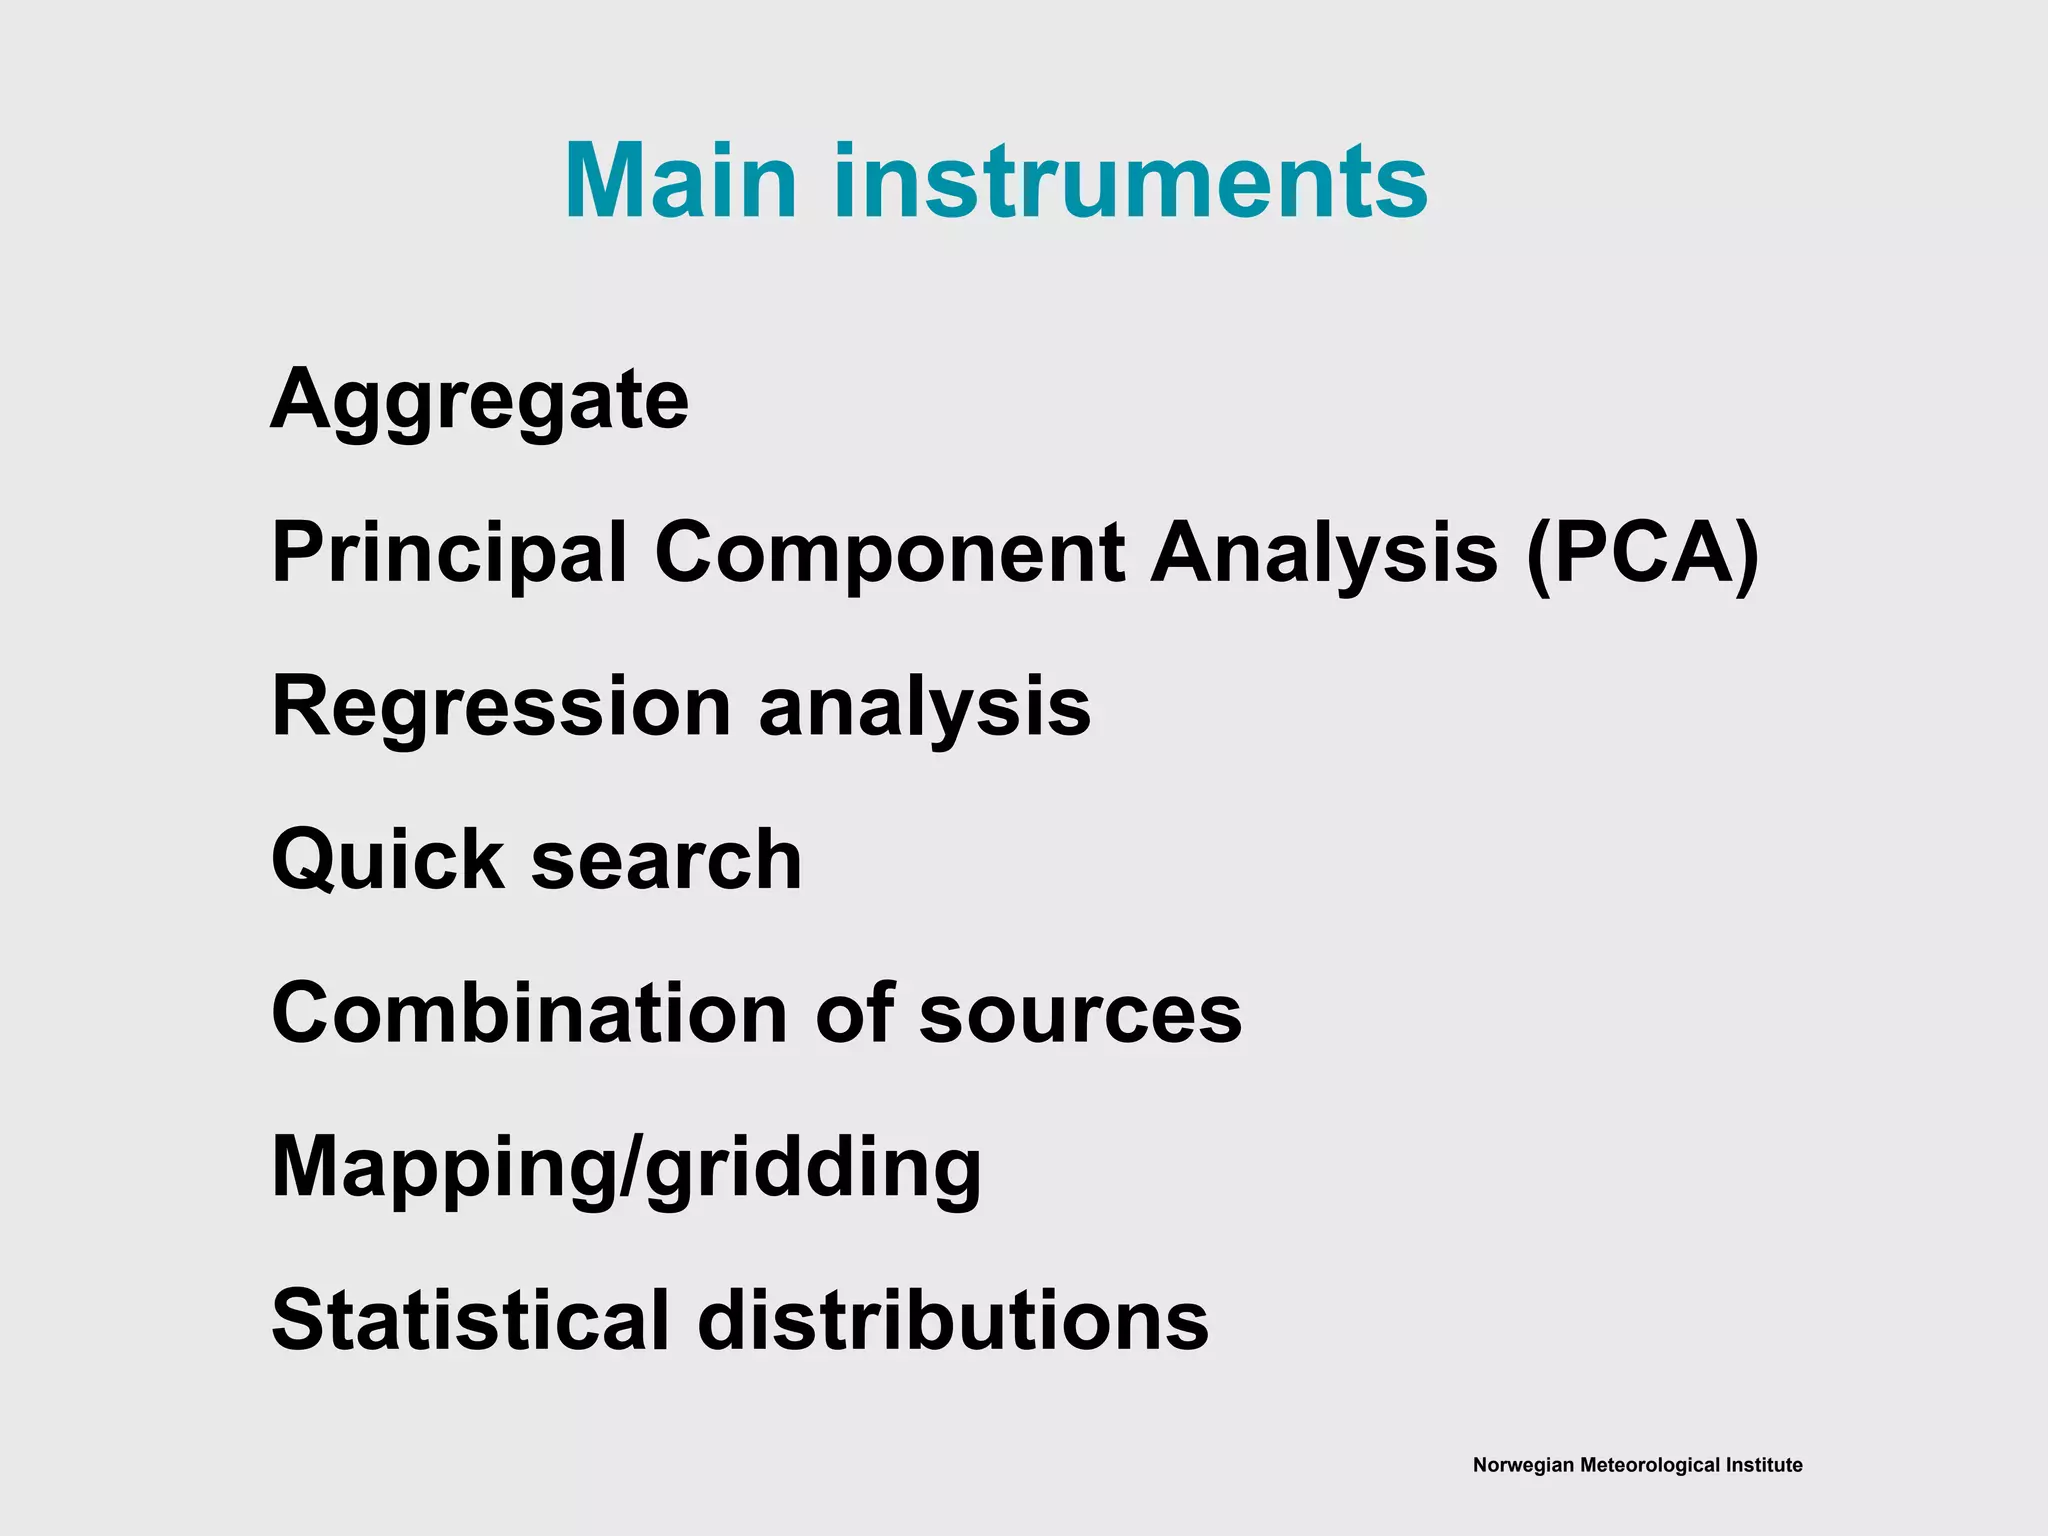
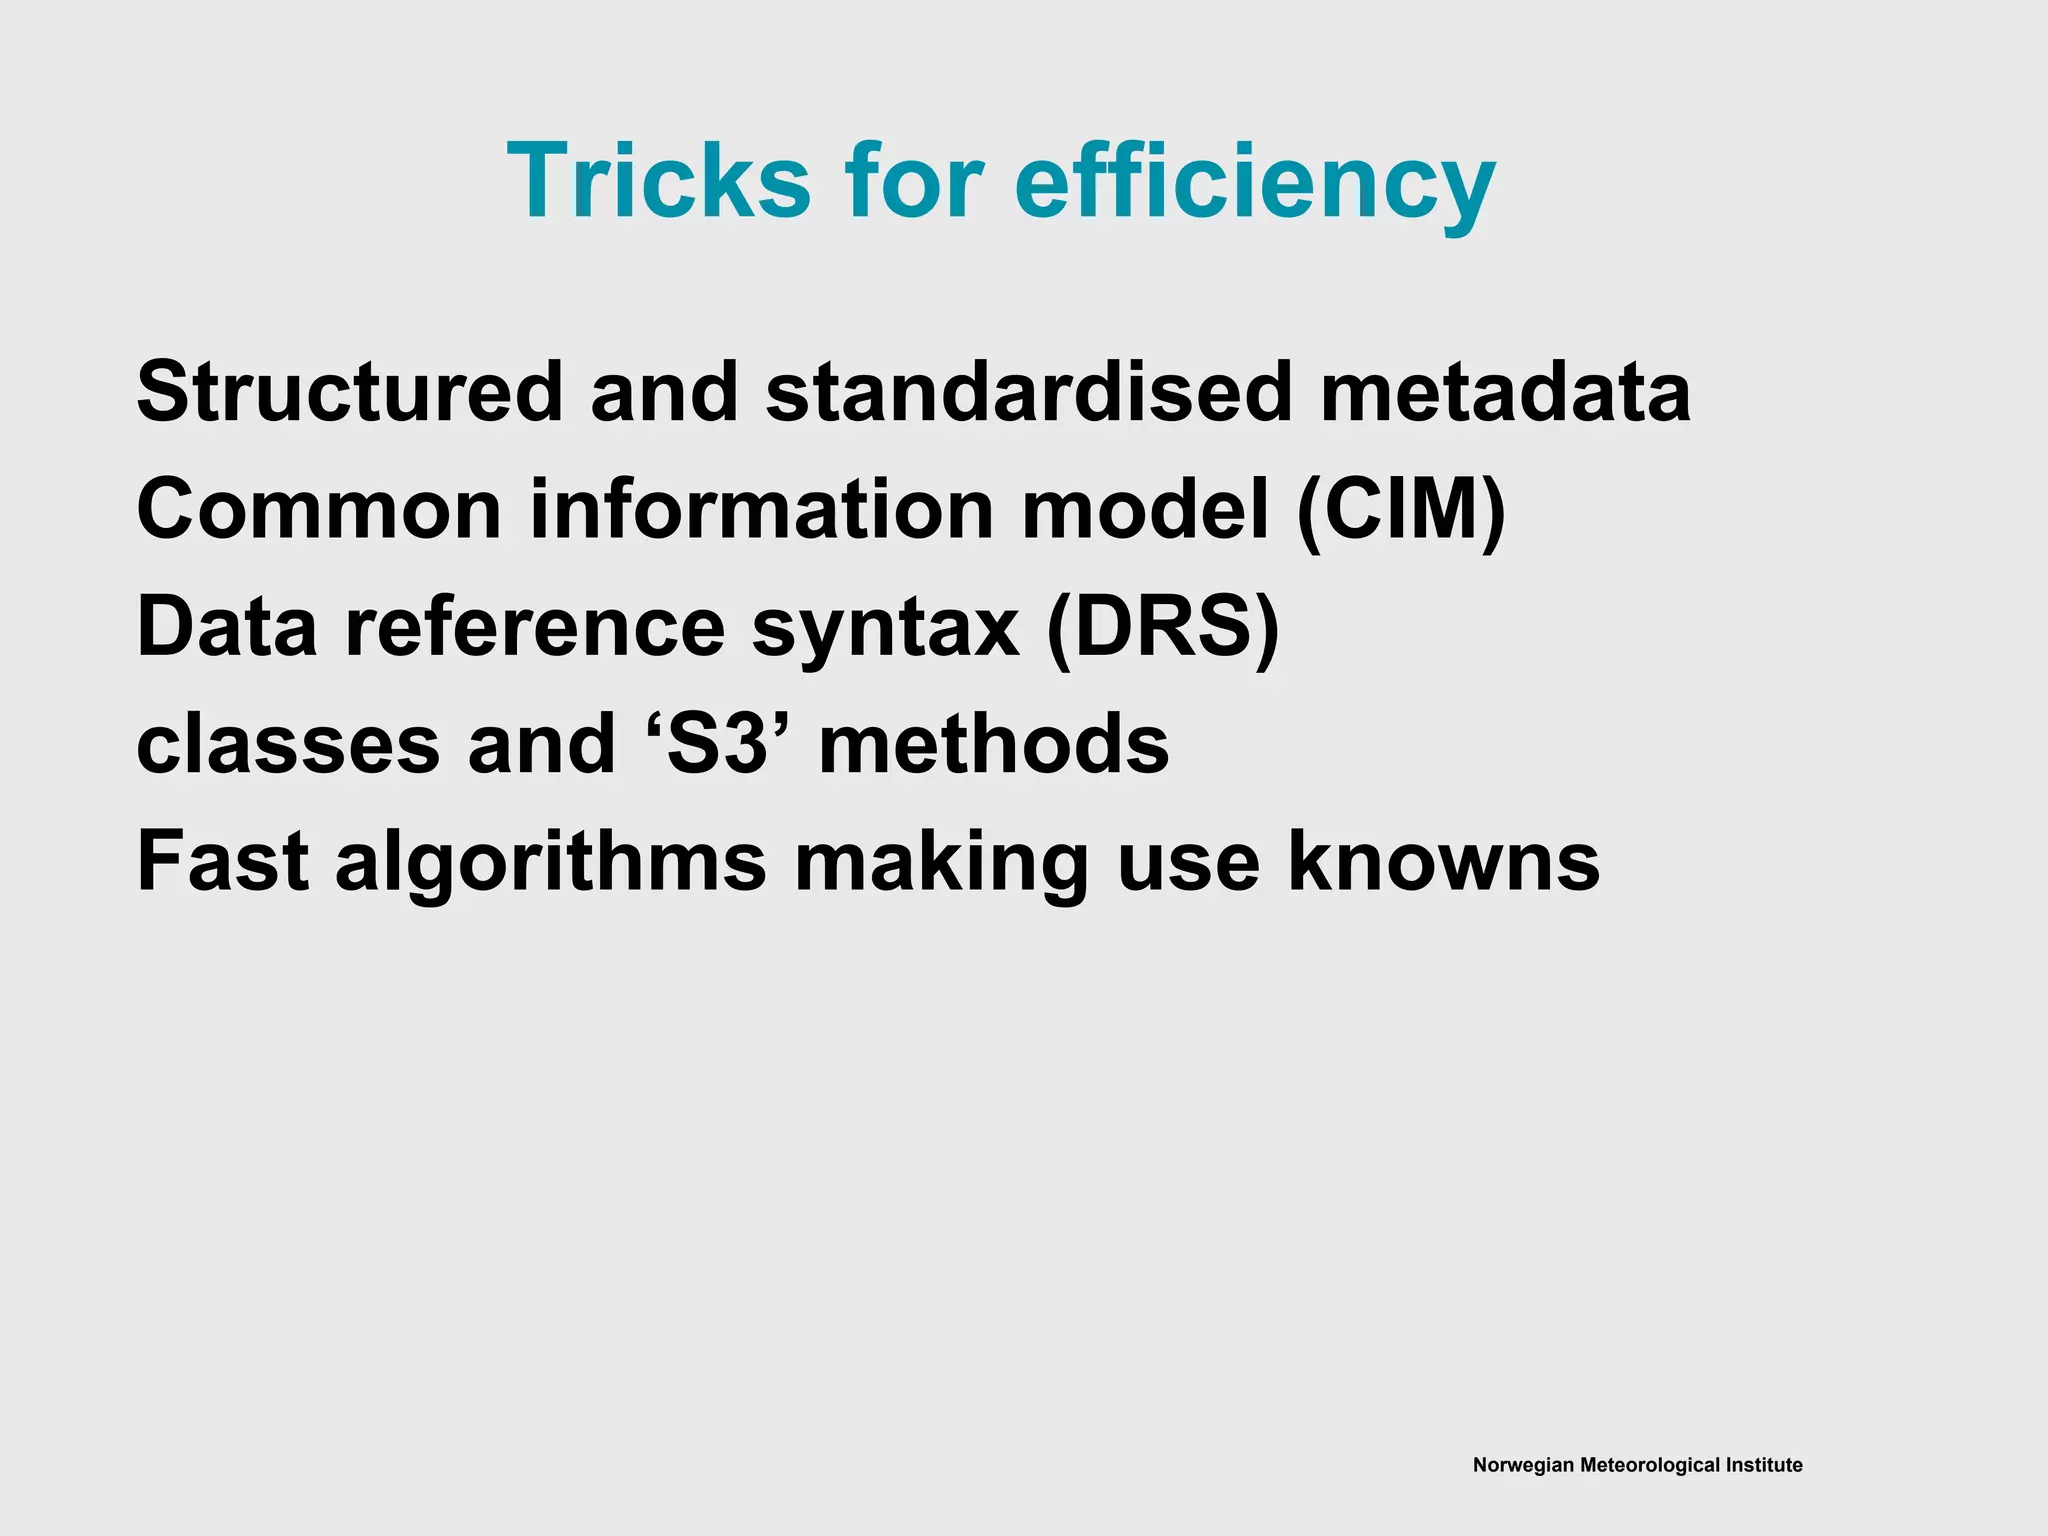


This document discusses tools and techniques for extracting useful climate information from large datasets. It introduces esd, an open-source tool for retrieving, processing, analyzing and visualizing climate data. esd uses simple algorithms to distill information from datasets. The document provides examples of using esd to examine temperature data from multiple sources and precipitation data from over 35,000 rain gauges. Statistical techniques discussed include principal component analysis, regression analysis, and examining changes in rainfall patterns. The goal is to understand relationships in the data and address specific climate questions in an efficient manner.


