Download as PDF, PPTX
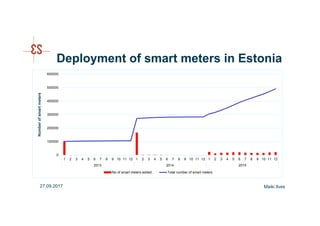

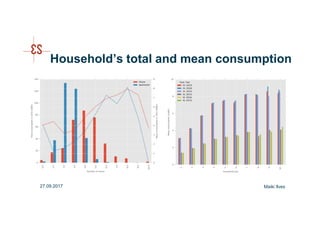
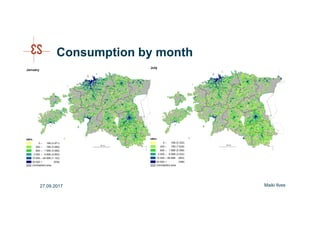
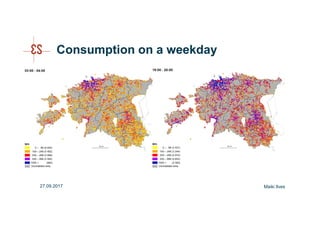
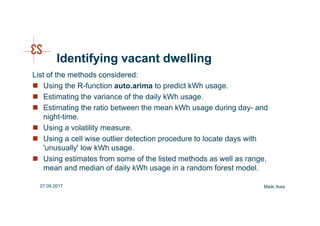
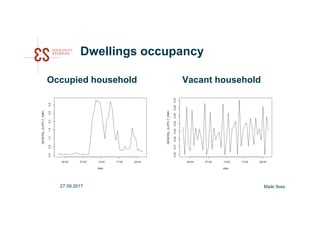
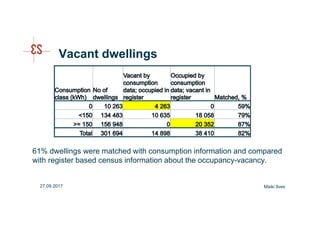
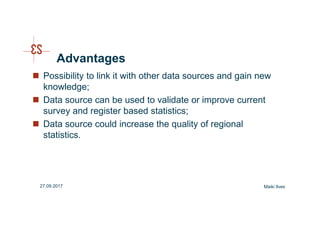
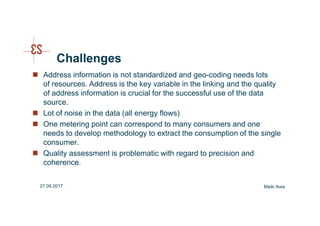


The document discusses two use cases for electricity smart meter data in Estonia. It describes how Statistics Estonia received hourly electricity consumption data from all households with smart meters installed by the electricity grid operator Elering. They used this data to analyze average household electricity consumption patterns and also developed a method to identify vacant dwellings based on abnormal electricity usage patterns. The analysis of smart meter data provided new insights but also challenges regarding linking the meter data to other statistical registers and addressing data quality issues.


![Hacking-Uncovered-How-People-Get-Hacked-and-How-to-Stay-Safe[1].pptx](https://cdn.slidesharecdn.com/ss_thumbnails/hacking-uncovered-how-people-get-hacked-and-how-to-stay-safe1-260130170011-4883a9c7-thumbnail.jpg?width=640&height=640&fit=bounds)


