VIBRATION BASICS &
COMPRESSOR VIBRATION
MEASUREMENTS
Muhammad Hussain Imran
I
In
nt
tr
ro
od
du
uc
ct
ti
io
on
n
◆ Traditionally, vibration has been
associated with trouble in machines.
◆ Nowadays, it has been used to save
industry millions of dollars in machine
downtime. Reasons for this are due to the
fact it used as a key part of many
maintenance programs.
T
Th
he
e T
Th
hr
re
ee
e F
Fu
un
nd
da
am
me
en
nt
ta
al
l C
Ch
ha
ar
ra
ac
ct
te
er
ri
is
st
ti
ic
cs
s o
of
f
V
Vi
ib
br
ra
at
ti
io
on
n A
Ar
re
e:
:
◆ Amplitude
◆ Frequency
◆ Phase
A
Am
mp
pl
li
it
tu
ud
de
e
Amplitude tells us
how much movemen
occurs
Amplitude is the
maximum value of
vibration at a location
on the machine.
F
Fr
re
eq
qu
ue
en
nc
cy
y
Frequency tells us how
often the movement occurs
How many cycles in a
period of time
( a second or a minute)
P
Ph
ha
as
se
e
Phase tells us in what direction is the movement.
Phase is the time relationship, measured in
degrees, of vibrations of the same frequency.
Measured with Keyphasor in most applications.
Expressed in degrees.
P
Ph
ha
as
se
e M
Me
ea
as
su
ur
re
em
me
en
nt
t
◆ Phase is a means of determining the Relative motion of two or more
vibrating machine parts.
◆ Phase readings only have meaning when compared to other phase
readings with a common reference.
◆ Comparative phase readings show “how” the machine is vibrating.
V
Vi
ib
br
ra
at
ti
io
on
n C
Ch
ha
ar
ra
ac
ct
te
er
ri
is
st
ti
ic
cs
s (
(A
Am
mp
pl
li
it
tu
ud
de
e)
)
Displacement - measures the total distance that the body
(shaft / housing) travels back and forth during one 'cycle' of
movement.
This movement is measured in mils (0.001”) Peak - Peak or
microns ųm (0.001mm) Peak - Peak.
Displacement measurement is used on Dresser-Rand
Centrifugal Compressors.
C
Ca
as
si
in
ng
g t
to
o R
Ro
ot
to
or
r W
We
ei
ig
gh
ht
t R
Ra
at
ti
io
o
◆ Dresser Rand B-line compressor.
Casing weight is very high.
◆ Rotor weight is significantly less.
◆ Therefore a rotor vibration
problem will not transmit high
levels to the casing.
◆ Due to this fact, Displacement of
the rotor inside the bearings gives
the best indication of machine
faults.
V
Vi
ib
br
ra
at
ti
io
on
n M
Me
ea
as
su
ur
re
em
me
en
nt
t
◆ Mechanical vibration is measured by a Transducer (Also called a Pick-Up or Sensor)
that converts vibration motion to an electrical signal.
◆ The units of the electrical signal are Volts (V), or more typically, millivolts (mV).
1000mV = 1V.
◆ The measured signal in volts is sent to the meter or analyzer. The amplitude of vibration
is determined by dividing the magnitude of the Voltage by a scale factor in mV/mil,
mV/IPS or mV/g or some other ratio that relates to the sensor being used.
P
Ph
ha
as
se
e M
Me
ea
as
su
ur
re
em
me
en
nt
t
◆ The phase angle of two signals indicates their relationship to each other in time. Phase
relationship can indicate machinery problems such as misalignment, frequency of a
critical speed or the location of a heavy spot for balancing.
◆ Phase is often measured from a reference signal generated one per shaft revolution by
a stationary sensor. e.g. keyphasor or tachometer, looking at a key-way or reflective
tape on the shaft.
◆ The reference signal relates to the zero angular position on the shaft. The phase of the
vibration signal is measured in respect to this position on the shaft.
P
Pr
ro
ox
xi
im
mi
it
ty
y P
Pr
ro
ob
be
es
s
◆ Proximity probes, also
called non-contacting eddy
current displacement
probes, are attached to the
bearing housing and
measure shaft vibration
relative to the location of
the probe.
◆ Two Probes are usually mounted 90º to each other. The horizontal probe X is always to the
right of the vertical probe Y when viewed from the drive end of the machine.
X
X a
an
nd
d Y
Y P
Pr
ro
ox
xi
im
mi
it
ty
y p
pr
ro
ob
be
es
s
◆ Proximity probes
installed at NDE of
centrifugal compressor.
P
Pr
ro
ox
xi
im
mi
it
ty
y P
Pr
ro
ob
be
es
s C
Co
on
nv
ve
en
nt
ti
io
on
n
◆ X is always on the right-hand side when viewed from the driver
P
Pr
ro
ox
xi
im
mi
it
ty
y P
Pr
ro
ob
be
e P
Pr
ri
in
nc
ci
ip
pl
le
e
A
Ax
xi
ia
al
l P
Pr
ro
ox
xi
im
mi
it
ty
y p
pr
ro
ob
be
es
s m
mo
on
ni
it
to
or
r t
th
he
e
s
sh
ha
af
ft
ts
s a
ax
xi
ia
al
l p
po
os
si
it
ti
io
on
n
X
X,
, Y
Y a
an
nd
d A
Ax
xi
ia
al
l p
pr
ro
ob
be
es
s
◆ NDE of compressor
with X, Y and axial
probes installed.
T
Ty
yp
pi
ic
ca
al
l O
On
n-
-l
li
in
ne
e s
sy
ys
st
te
em
m D
Di
is
sp
pl
la
ay
y
◆ Typical display from
and online protection
system.
◆ Overall vibration levels
are displayed along
with any alarms.
A
An
n o
on
n-
-l
li
in
ne
e p
pr
ro
ot
te
ec
ct
ti
io
on
n s
sy
ys
st
te
em
m
O
On
n-
-l
li
in
ne
e p
pr
ro
ot
te
ec
ct
ti
io
on
n s
sy
ys
st
te
em
m
◆ Expensive - Usually reserved for large critical machines.
◆ Linked to DCS and a specified level of vibration can trip the
machine.
◆ Data can be stored and trended over a period of time.
◆ Data can be extracted for analysis.
◆ Other analyzers are able to tap into the system to record and
extract vibration data.
Vibration Analysis
DRAP 2007
B
Be
en
nt
tl
ly
y A
Ad
dr
re
e v
vi
ib
br
ra
at
ti
io
on
n a
an
na
al
ly
yz
ze
er
r
◆ Relatively portable.
◆ Taps into buffered
output of existing
online system.
◆ Can acquire 8 – 16
channels
simultaneously.
◆ Used for frequency
analysis
T
Th
he
e S
Si
ig
gn
ni
if
fi
ic
ca
an
nc
ce
e o
of
f F
Fr
re
eq
qu
ue
en
nc
cy
y
◆ Essential for pinpointing the cause of machinery vibration problems.
◆ Many vibration problems exhibit frequencies related to the rotational
speed's of the machine.
◆ Identification of frequencies can narrow down the possible causes of
the vibration.
F
Fr
re
eq
qu
ue
en
nc
cy
y
◆That number - how many cycles occur in a given time period - is known as
the vibration "frequency".
◆UNITS
◆ Cycles per minute (CPM)
◆ Cycles per second (CPS) – or Hertz (Hz)
◆ Orders (Multiples of shaft speed)
E
Ex
xc
ci
it
ta
at
ti
io
on
n
◆ The purpose of vibration analysis is to identify defects and evaluate machine
condition.
◆ Frequencies are used to relate machine faults to forces that cause vibration.
◆ Forces / vibration are often a result of machine defects, wear or installation issues
such as looseness or misalignment.
◆ Because vibration is in some way related to the operating speed it is important to
obtain machine running speeds when doing vibration analysis.
T
Ti
im
me
e W
Wa
av
ve
ef
fo
or
rm
m (
(D
Di
is
sp
pl
la
ac
ce
em
me
en
nt
t)
)
◆ Waveform is the plot of amplitude v time.
T
Th
he
e F
Fr
re
eq
qu
ue
en
nc
cy
y S
Sp
pe
ec
ct
tr
ru
um
m
◆ Spectrum is the plot of frequency v amplitude.
O
Or
rb
bi
it
t P
Pl
lo
ot
t
T
Tr
ra
an
ns
si
ie
en
nt
t o
or
r S
St
te
ea
ad
dy
y-
-S
St
ta
at
te
e
◆ Most machinery analyzers/software today gather snapshots of vibration data over a certain period
of time. As technology improves, high powered analyzers and software have reduced the time in
which data can be collected. This is good news for Condition Monitoring Engineers involved in
data collection.
◆ When a machine is running at its normal speed and operating condition, acquiring short data
snapshots is usually sufficient for condition monitoring programs and to diagnose many different
kinds of machine faults.
◆ When a machine is running at a constant speed and load/ condition, it is said to be running in a
Steady- State. Data collected in this state is Steady-State data.
T
Tr
ra
an
ns
si
ie
en
nt
t o
or
r S
St
te
ea
ad
dy
y-
-S
St
ta
at
te
e
◆ Transient data is data that is recorded as the machine undergoes some changes in condition.
Examples of changes in condition are changes in speed or changes in load. A Machine being
started-up or shut down and machines being loaded or unloaded are examples of machines in
a transient state.
◆ When dealing with certain types of machines (turbines/ compressors), it takes a considerable
amount of time for a machine to start-up or for a machine to become fully loaded. In this case,
data snapshots are not sufficient to gather enough data. To gather good transient data will
require an analyzer with a large memory or a tape recorder function.
◆ The reason for being able to gather good transient data is that some faults can be more easily
diagnosed by analyzing transient data. These include resonance, rub, process related issues
and electrical faults.
T
Tr
ra
an
ns
si
ie
en
nt
t D
Da
at
ta
a –
– B
Bo
od
de
e P
Pl
lo
ot
t
◆ Bode plot is a dual plot of
phase and amplitude.
◆ When a machine passes its
critical speed the phase
changes 180 degrees and
the vibration will peak.
◆ In this example the critical
speed is 860rpm.
R
Re
es
so
on
na
an
nc
ce
e
◆ Every physical object has a natural frequency and it is the frequency that it will oscillate
at if excited by a force. Resonance is a condition that results in the amplification of
vibration when the forcing frequency is close to or at a natural frequency.
Amplitude Amplitude
Resonance
Freq Freq
Excitation Force
Nf
Excitation Force
Nf
S
So
om
me
e c
co
on
ns
si
id
de
er
ra
at
ti
io
on
ns
s o
of
f R
Re
es
so
on
na
an
nc
ce
e
◆ More often than not, the natural frequency, or critical speed is not known.
◆ One way to try and find out is to conduct a critical speed test. These are also called start-up or
coast-down tests and are done by monitoring the vibration as the machine speed changes.
◆ Usually the machine will be running at MCOS, the vibration equipment will be set up and the
recording begins.
◆ When all parties are ready, the machine can be shut off and when any excitation force coincides
with a natural frequency we will see a change in conditions. Usually, when this happens there will be
a sudden change in vibration amplitude and/or phase.
Excitation Force
Nf
R
Re
es
so
on
na
an
nc
ce
e –
– E
Ex
xa
am
mp
pl
le
e 1
1
◆ In this example, the machine is operating above the first critical speed. If we were to
conduct a coast down test, we should see an increase in vibration once the speed
comes close to the natural frequency.
Amplitude Amplitude
Freq Freq
Excitation Force
Nf
R
Re
es
so
on
na
an
nc
ce
e –
– E
Ex
xa
am
mp
pl
le
e 2
2
◆ In this example, the machine is operating very close to or at the first critical speed. If
we were to conduct a coast down test, we should see a sharp decrease in vibration
once the speed comes out of the natural frequency zone.
Excitation Force
Amplitude Amplitude
Nf
Freq Freq
Excitation Force
Nf
T
Tr
ra
an
ns
si
ie
en
nt
t D
Da
at
ta
a-
- W
Wa
at
te
er
rf
fa
al
ll
l p
pl
lo
ot
ts
s
C
Ce
en
nt
te
er
rl
li
in
ne
e P
Pl
lo
ot
ts
s
C
Ca
as
sc
ca
ad
de
e P
Pl
lo
ot
ts
s
T
Tr
ra
an
ns
si
ie
en
nt
t D
Da
at
ta
a –
– T
Ti
im
me
e T
Tr
re
en
nd
d.
.
Common Machine Faults -
Unbalance
DRAP 2007
U
Un
nb
ba
al
la
an
nc
ce
e
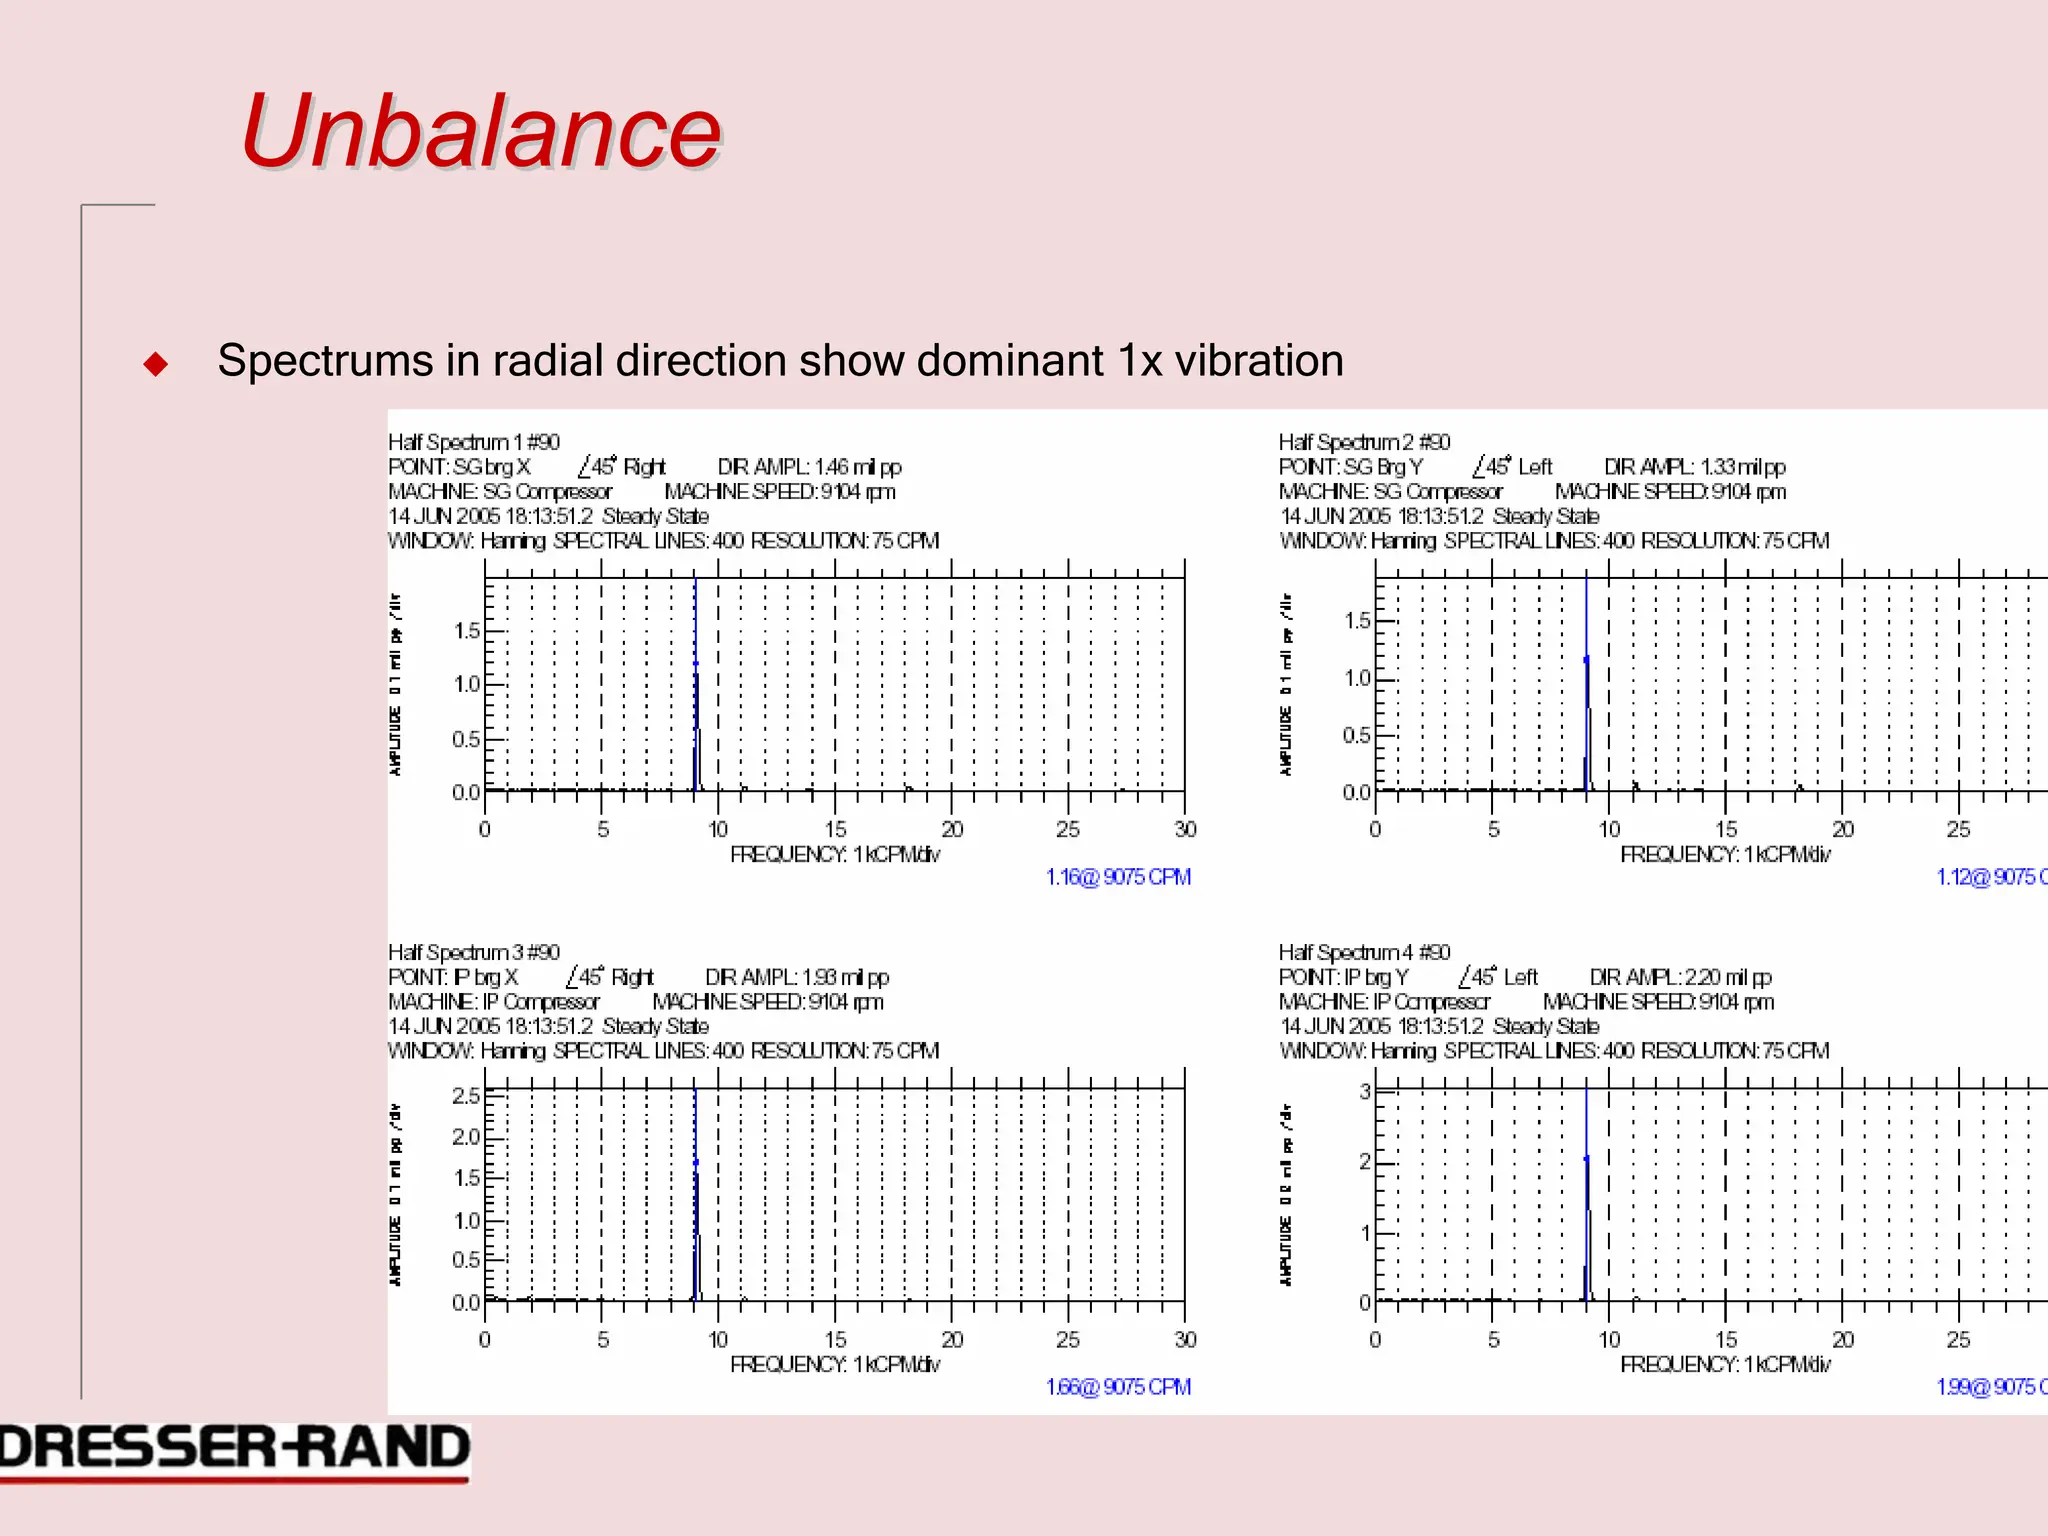
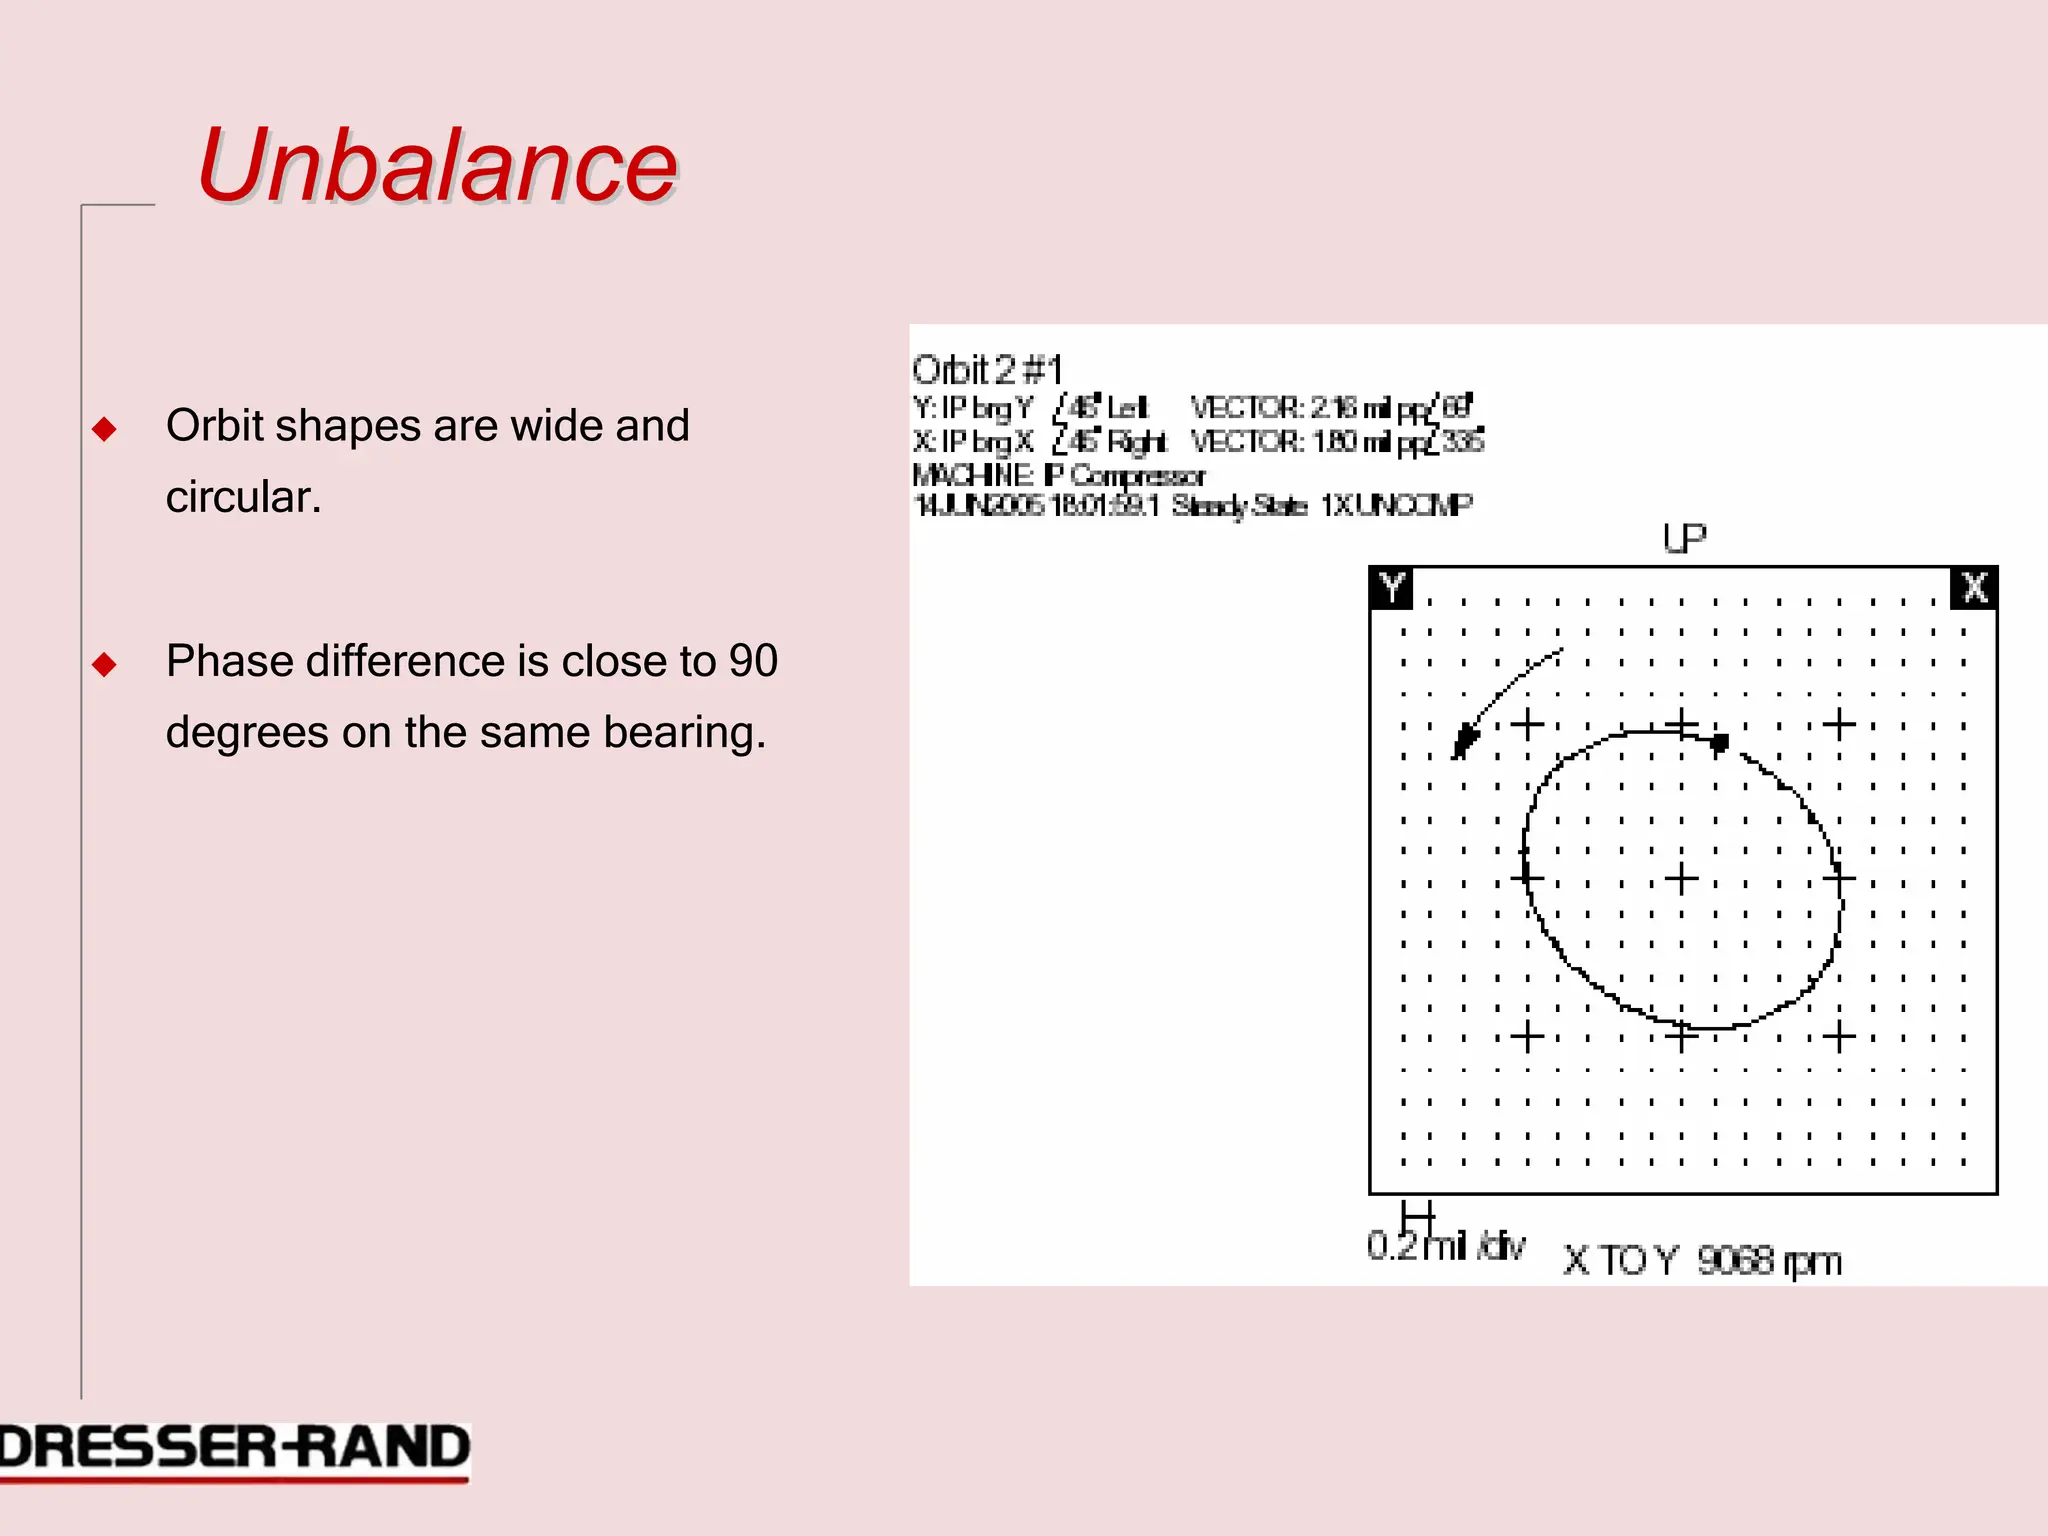
◆ Unequal radial mass distribution on a rotor
system;
◆ A shaft condition where the mass centerline
(principal axis of inertia) does not coincide
with the geometric centerline. [Eccentricity of
local center of gravity (c.g.) of rotor from
undisturbed axis of rotation.]
U
Un
nb
ba
al
la
an
nc
ce
e
◆ Spectrums in radial direction show dominant 1x vibration
U
Un
nb
ba
al
la
an
nc
ce
e
◆ Orbit shapes are wide and
circular.
◆ Phase difference is close to 90
degrees on the same bearing.
U
Un
nb
ba
al
la
an
nc
ce
e
◆ Different types of
unbalance.
◆ Phase information
is vital to
determine which is
present and to
carry out
corrections.
Balancing Practical Exercise 1
DRAP 2007
0
90
45 30 15 0 345 330 315
Rotation
60 30
75 28
90 27
105 25
120
24
135 150 165 180 195 210 225
0
90
45 30 15 0 345 330 315
Rotation
60 30
75 28
90 27
105 25
120
24
Ref Run: 5 mils @ 190º
135 150 165 180 195 210 225
0
90
45 30 15 0 345 330 315
TW = 75g @ 30º
Rotation
60 30
75 28
90 27
105 25
120
24
Ref
135 150 165 180 195 210 225
0
90
45 30 15 0 345 330 315
TW = 75g @ 30º
Rotation
60 30
75 28
90 27
105 25
Trial Run: 3 mils @ 150º
120
24
Ref
135 150 165 180 195 210 225
0
90
Angle measured = 36º
Effect of TW = 3.4 mils
45 30 15 0 345 330 315
TW = 75g @ 30º
Rotation
60 30
75 28
90 27
105 Trial Run 25
Effect of TW = 36º
120 3.4 mils 24
Ref
135 150 165 180 195 210 225
0
90
Angle measured = 36º
Effect of TW = 3.4 mils @ 46º
45 30 15 0 345 330 315
TW = 75g @ 30º
Rotation
60 30
75 28
Effect of TW 36º
90 27
105 Trial Run 25
120
Effect of TW 36º
24
Ref
135 150 165 180 195 210 225
0
90
60
75
45 30 15 0 345 330 315
TW = 75g @ 30º
orrection Weight = (Ref/ Effect of TW) x TW Rotation
30
W = (5/3.4) x 75g
28
Effect of TW 36º
90 27
105 Trial Run 25
120
Effect of TW 36º
24
Ref
135 150 165 180 195 210 225
0
90
60
75
Effect of T
90
45 30 15 0 345 330 315
CW = 110g @ 354º
TW = 75g @ 30º
orrection Weight = (Ref/ Effect of TW) x TW Rotation
30
W = (5/3.4) x 75g
W = 110g @ (390º - 36 º)
28
W 36º
W = 110g @ 354º (TW MUST BE REMOVED)
27
105 Trial Run 25
120
Effect of TW 36º
24
Ref
135 150 165 180 195 210 225
0
90
45 30 15 0 345 330 315
CW = 110g @ 354º
TW = 75g @ 30º
Rotation
60 30
75 28
Effect of TW 36º
90 27
105 Trial Run 25
120
Effect of TW 36º
24
Ref
135 150 165 180 195 210 225
B
Ba
al
la
an
nc
ci
in
ng
g C
Ca
as
se
e s
st
tu
ud
dy
y
◆ This is a real life case where in-situ balancing was done on the coupling of a
Turbo driven Compressor.
◆ Initial Vibration analysis showed high levels at the Power Turbine bearing
closest to the coupling.
◆ In the current situation the machine can not be run up to full operating speed
without tripping due to high vibration.
◆ In-situ balancing was done in an attempt to reduce the vibration experienced
on this machine.
◆ Large round orbit plot
from PT brg.
◆ 90º phase difference
between X and Y probes
◆ Spectrum shows high
amplitude 1x rpm peak.
◆ All the hallmarks of an
unbalance problem.
B
Ba
al
la
an
nc
ci
in
ng
g C
Ca
as
se
e s
st
tu
ud
dy
y
◆ Balancing would be
attempted by mounting
weights in these holes in
the coupling.
◆ Weights will be grub
screws.
◆ There are ten holes
around the coupling for
weight application.
Rotation
8
9
0
7
◆ The coupling was
already marked from
a previous job.
10 6
◆ The number 8 lined
up with the
keyphasor so it
becomes our ZERO. 90 27
1 5
2 180
4
3
180
3
2 4
8
9
0
7
Rotation
10 6
90
Ref Run: 2.04 mils @ 252º
270
1 5
180
3
2 4
8
9
0
7
Rotation
TW = 1.9 @ 18º
10 6
90
Ref Run: 2.04 mils @ 252º
270
1 5
Trial Run: 2.04 mils @ 206º
180
3
2 4
8
9
0
7
Rotation
TW = 1.9 @ 18º
10 6
90
Ref Run: 2.04 mils @ 252º
270
67º
1 5
Angle measured = 67º
Effect of TW = 1.61 mils
Trial Run: 2.04 mils @ 206º
180
3
2 4
8
9
0
7
Rotation
TW = 1.9 @ 18º
10 6
90
67º Ref Run: 2.04 mils @ 252º
270
67º
1 5
Angle measured = 67º
Effect of TW = 1.61 mils
Trial Run: 2.04 mils @ 206º
B
Ba
al
la
an
nc
ci
in
ng
g C
Ca
as
se
e s
st
tu
ud
dy
y
◆ How Much should the correction weight be?
◆ Where will it be located?
◆ What problems do you face with this situation?
B
Ba
al
la
an
nc
ci
in
ng
g C
Ca
as
se
e s
st
tu
ud
dy
y
◆ Vibration after balancing.
Machine Evaluation
And
Vibration Standards & Tolerances
DRAP 2007
V
Vi
ib
br
ra
at
ti
io
on
n S
St
ta
an
nd
da
ar
rd
ds
s &
& T
To
ol
le
er
ra
an
nc
ce
es
s
◆ Transducers and Machinery analyzers provide the data that is evaluated against standards
and limits to help judge the machine condition.
◆ Overall levels of vibration are typically judged in terms of limits: Acceptance of new
machines, normal, surveillance and shutdown.
◆ Usually the levels are compared over some period of time to establish trends.
◆ Levels of overall vibration will be in either Peak-Peak, Peak or RMS.
V
Vi
ib
br
ra
at
ti
io
on
n S
St
ta
an
nd
da
ar
rd
ds
s &
& T
To
ol
le
er
ra
an
nc
ce
es
s
◆ Guidelines for acceptable vibration levels are based on shaft or casing vibration
measurements.
◆ Shaft vibration is used to asses the condition of machines with fluid film bearings with large
relative motion in the bearings and with a high casing to rotor weight ratio.
◆ Casing and bearing cap vibration is used on general machines with rolling element bearings
as part of most condition monitoring programs.
E
Ev
va
al
lu
ua
at
ti
io
on
n o
of
f S
Sh
ha
af
ft
t V
Vi
ib
br
ra
at
ti
io
on
n
◆ Shaft vibration is measured with proximity probes that are mounted as close as possible to th
bearings.
◆ When two probes are used at the bearing, an orbit of the shafts motion can be determined as
well as the position of the shaft inside the bearing.
◆ From this information, accurate assessment of bearing condition can be made from the
measurements.
www.dresser-rand.com
info@dresser-rand.com

Basics of Vibration & Compressor Vibration Measurements.pdf

  • 1.
    VIBRATION BASICS & COMPRESSORVIBRATION MEASUREMENTS Muhammad Hussain Imran
  • 2.
    I In nt tr ro od du uc ct ti io on n ◆ Traditionally, vibrationhas been associated with trouble in machines. ◆ Nowadays, it has been used to save industry millions of dollars in machine downtime. Reasons for this are due to the fact it used as a key part of many maintenance programs.
  • 3.
    T Th he e T Th hr re ee e F Fu un nd da am me en nt ta al lC Ch ha ar ra ac ct te er ri is st ti ic cs s o of f V Vi ib br ra at ti io on n A Ar re e: : ◆ Amplitude ◆ Frequency ◆ Phase
  • 4.
    A Am mp pl li it tu ud de e Amplitude tells us howmuch movemen occurs Amplitude is the maximum value of vibration at a location on the machine.
  • 5.
    F Fr re eq qu ue en nc cy y Frequency tells ushow often the movement occurs How many cycles in a period of time ( a second or a minute)
  • 6.
    P Ph ha as se e Phase tells usin what direction is the movement. Phase is the time relationship, measured in degrees, of vibrations of the same frequency. Measured with Keyphasor in most applications. Expressed in degrees.
  • 7.
    P Ph ha as se e M Me ea as su ur re em me en nt t ◆ Phaseis a means of determining the Relative motion of two or more vibrating machine parts. ◆ Phase readings only have meaning when compared to other phase readings with a common reference. ◆ Comparative phase readings show “how” the machine is vibrating.
  • 8.
    V Vi ib br ra at ti io on n C Ch ha ar ra ac ct te er ri is st ti ic cs s ( (A Am mp pl li it tu ud de e) ) Displacement- measures the total distance that the body (shaft / housing) travels back and forth during one 'cycle' of movement. This movement is measured in mils (0.001”) Peak - Peak or microns ųm (0.001mm) Peak - Peak. Displacement measurement is used on Dresser-Rand Centrifugal Compressors.
  • 9.
    C Ca as si in ng g t to o R Ro ot to or rW We ei ig gh ht t R Ra at ti io o ◆ Dresser Rand B-line compressor. Casing weight is very high. ◆ Rotor weight is significantly less. ◆ Therefore a rotor vibration problem will not transmit high levels to the casing. ◆ Due to this fact, Displacement of the rotor inside the bearings gives the best indication of machine faults.
  • 10.
    V Vi ib br ra at ti io on n M Me ea as su ur re em me en nt t ◆ Mechanicalvibration is measured by a Transducer (Also called a Pick-Up or Sensor) that converts vibration motion to an electrical signal. ◆ The units of the electrical signal are Volts (V), or more typically, millivolts (mV). 1000mV = 1V. ◆ The measured signal in volts is sent to the meter or analyzer. The amplitude of vibration is determined by dividing the magnitude of the Voltage by a scale factor in mV/mil, mV/IPS or mV/g or some other ratio that relates to the sensor being used.
  • 11.
    P Ph ha as se e M Me ea as su ur re em me en nt t ◆ Thephase angle of two signals indicates their relationship to each other in time. Phase relationship can indicate machinery problems such as misalignment, frequency of a critical speed or the location of a heavy spot for balancing. ◆ Phase is often measured from a reference signal generated one per shaft revolution by a stationary sensor. e.g. keyphasor or tachometer, looking at a key-way or reflective tape on the shaft. ◆ The reference signal relates to the zero angular position on the shaft. The phase of the vibration signal is measured in respect to this position on the shaft.
  • 12.
    P Pr ro ox xi im mi it ty y P Pr ro ob be es s ◆ Proximityprobes, also called non-contacting eddy current displacement probes, are attached to the bearing housing and measure shaft vibration relative to the location of the probe. ◆ Two Probes are usually mounted 90º to each other. The horizontal probe X is always to the right of the vertical probe Y when viewed from the drive end of the machine.
  • 13.
    X X a an nd d Y YP Pr ro ox xi im mi it ty y p pr ro ob be es s ◆ Proximity probes installed at NDE of centrifugal compressor.
  • 14.
    P Pr ro ox xi im mi it ty y P Pr ro ob be es s C Co on nv ve en nt ti io on n ◆X is always on the right-hand side when viewed from the driver
  • 15.
  • 16.
    A Ax xi ia al l P Pr ro ox xi im mi it ty y p pr ro ob be es sm mo on ni it to or r t th he e s sh ha af ft ts s a ax xi ia al l p po os si it ti io on n
  • 17.
    X X, , Y Y a an nd dA Ax xi ia al l p pr ro ob be es s ◆ NDE of compressor with X, Y and axial probes installed.
  • 18.
    T Ty yp pi ic ca al l O On n- -l li in ne e s sy ys st te em mD Di is sp pl la ay y ◆ Typical display from and online protection system. ◆ Overall vibration levels are displayed along with any alarms.
  • 19.
  • 20.
    O On n- -l li in ne e p pr ro ot te ec ct ti io on n s sy ys st te em m ◆Expensive - Usually reserved for large critical machines. ◆ Linked to DCS and a specified level of vibration can trip the machine. ◆ Data can be stored and trended over a period of time. ◆ Data can be extracted for analysis. ◆ Other analyzers are able to tap into the system to record and extract vibration data.
  • 21.
  • 22.
    B Be en nt tl ly y A Ad dr re e v vi ib br ra at ti io on na an na al ly yz ze er r ◆ Relatively portable. ◆ Taps into buffered output of existing online system. ◆ Can acquire 8 – 16 channels simultaneously. ◆ Used for frequency analysis
  • 23.
    T Th he e S Si ig gn ni if fi ic ca an nc ce e o of fF Fr re eq qu ue en nc cy y ◆ Essential for pinpointing the cause of machinery vibration problems. ◆ Many vibration problems exhibit frequencies related to the rotational speed's of the machine. ◆ Identification of frequencies can narrow down the possible causes of the vibration.
  • 24.
    F Fr re eq qu ue en nc cy y ◆That number -how many cycles occur in a given time period - is known as the vibration "frequency". ◆UNITS ◆ Cycles per minute (CPM) ◆ Cycles per second (CPS) – or Hertz (Hz) ◆ Orders (Multiples of shaft speed)
  • 25.
    E Ex xc ci it ta at ti io on n ◆ The purposeof vibration analysis is to identify defects and evaluate machine condition. ◆ Frequencies are used to relate machine faults to forces that cause vibration. ◆ Forces / vibration are often a result of machine defects, wear or installation issues such as looseness or misalignment. ◆ Because vibration is in some way related to the operating speed it is important to obtain machine running speeds when doing vibration analysis.
  • 26.
  • 27.
    T Th he e F Fr re eq qu ue en nc cy y S Sp pe ec ct tr ru um m ◆Spectrum is the plot of frequency v amplitude.
  • 28.
  • 29.
    T Tr ra an ns si ie en nt t o or r S St te ea ad dy y- -S St ta at te e ◆Most machinery analyzers/software today gather snapshots of vibration data over a certain period of time. As technology improves, high powered analyzers and software have reduced the time in which data can be collected. This is good news for Condition Monitoring Engineers involved in data collection. ◆ When a machine is running at its normal speed and operating condition, acquiring short data snapshots is usually sufficient for condition monitoring programs and to diagnose many different kinds of machine faults. ◆ When a machine is running at a constant speed and load/ condition, it is said to be running in a Steady- State. Data collected in this state is Steady-State data.
  • 30.
    T Tr ra an ns si ie en nt t o or r S St te ea ad dy y- -S St ta at te e ◆Transient data is data that is recorded as the machine undergoes some changes in condition. Examples of changes in condition are changes in speed or changes in load. A Machine being started-up or shut down and machines being loaded or unloaded are examples of machines in a transient state. ◆ When dealing with certain types of machines (turbines/ compressors), it takes a considerable amount of time for a machine to start-up or for a machine to become fully loaded. In this case, data snapshots are not sufficient to gather enough data. To gather good transient data will require an analyzer with a large memory or a tape recorder function. ◆ The reason for being able to gather good transient data is that some faults can be more easily diagnosed by analyzing transient data. These include resonance, rub, process related issues and electrical faults.
  • 31.
    T Tr ra an ns si ie en nt t D Da at ta a – –B Bo od de e P Pl lo ot t ◆ Bode plot is a dual plot of phase and amplitude. ◆ When a machine passes its critical speed the phase changes 180 degrees and the vibration will peak. ◆ In this example the critical speed is 860rpm.
  • 32.
    R Re es so on na an nc ce e ◆ Every physicalobject has a natural frequency and it is the frequency that it will oscillate at if excited by a force. Resonance is a condition that results in the amplification of vibration when the forcing frequency is close to or at a natural frequency. Amplitude Amplitude Resonance Freq Freq Excitation Force Nf Excitation Force Nf
  • 33.
    S So om me e c co on ns si id de er ra at ti io on ns s o of fR Re es so on na an nc ce e ◆ More often than not, the natural frequency, or critical speed is not known. ◆ One way to try and find out is to conduct a critical speed test. These are also called start-up or coast-down tests and are done by monitoring the vibration as the machine speed changes. ◆ Usually the machine will be running at MCOS, the vibration equipment will be set up and the recording begins. ◆ When all parties are ready, the machine can be shut off and when any excitation force coincides with a natural frequency we will see a change in conditions. Usually, when this happens there will be a sudden change in vibration amplitude and/or phase.
  • 34.
    Excitation Force Nf R Re es so on na an nc ce e – –E Ex xa am mp pl le e 1 1 ◆ In this example, the machine is operating above the first critical speed. If we were to conduct a coast down test, we should see an increase in vibration once the speed comes close to the natural frequency. Amplitude Amplitude Freq Freq Excitation Force Nf
  • 35.
    R Re es so on na an nc ce e – – E Ex xa am mp pl le e2 2 ◆ In this example, the machine is operating very close to or at the first critical speed. If we were to conduct a coast down test, we should see a sharp decrease in vibration once the speed comes out of the natural frequency zone. Excitation Force Amplitude Amplitude Nf Freq Freq Excitation Force Nf
  • 36.
  • 37.
  • 38.
  • 39.
    T Tr ra an ns si ie en nt t D Da at ta a – –T Ti im me e T Tr re en nd d. .
  • 40.
    Common Machine Faults- Unbalance DRAP 2007
  • 41.
    U Un nb ba al la an nc ce e ◆ Unequal radialmass distribution on a rotor system; ◆ A shaft condition where the mass centerline (principal axis of inertia) does not coincide with the geometric centerline. [Eccentricity of local center of gravity (c.g.) of rotor from undisturbed axis of rotation.]
  • 42.
    U Un nb ba al la an nc ce e ◆ Spectrums inradial direction show dominant 1x vibration
  • 43.
    U Un nb ba al la an nc ce e ◆ Orbit shapesare wide and circular. ◆ Phase difference is close to 90 degrees on the same bearing.
  • 44.
    U Un nb ba al la an nc ce e ◆ Different typesof unbalance. ◆ Phase information is vital to determine which is present and to carry out corrections.
  • 45.
  • 46.
    0 90 45 30 150 345 330 315 Rotation 60 30 75 28 90 27 105 25 120 24 135 150 165 180 195 210 225
  • 47.
    0 90 45 30 150 345 330 315 Rotation 60 30 75 28 90 27 105 25 120 24 Ref Run: 5 mils @ 190º 135 150 165 180 195 210 225
  • 48.
    0 90 45 30 150 345 330 315 TW = 75g @ 30º Rotation 60 30 75 28 90 27 105 25 120 24 Ref 135 150 165 180 195 210 225
  • 49.
    0 90 45 30 150 345 330 315 TW = 75g @ 30º Rotation 60 30 75 28 90 27 105 25 Trial Run: 3 mils @ 150º 120 24 Ref 135 150 165 180 195 210 225
  • 50.
    0 90 Angle measured =36º Effect of TW = 3.4 mils 45 30 15 0 345 330 315 TW = 75g @ 30º Rotation 60 30 75 28 90 27 105 Trial Run 25 Effect of TW = 36º 120 3.4 mils 24 Ref 135 150 165 180 195 210 225
  • 51.
    0 90 Angle measured =36º Effect of TW = 3.4 mils @ 46º 45 30 15 0 345 330 315 TW = 75g @ 30º Rotation 60 30 75 28 Effect of TW 36º 90 27 105 Trial Run 25 120 Effect of TW 36º 24 Ref 135 150 165 180 195 210 225
  • 52.
    0 90 60 75 45 30 150 345 330 315 TW = 75g @ 30º orrection Weight = (Ref/ Effect of TW) x TW Rotation 30 W = (5/3.4) x 75g 28 Effect of TW 36º 90 27 105 Trial Run 25 120 Effect of TW 36º 24 Ref 135 150 165 180 195 210 225
  • 53.
    0 90 60 75 Effect of T 90 4530 15 0 345 330 315 CW = 110g @ 354º TW = 75g @ 30º orrection Weight = (Ref/ Effect of TW) x TW Rotation 30 W = (5/3.4) x 75g W = 110g @ (390º - 36 º) 28 W 36º W = 110g @ 354º (TW MUST BE REMOVED) 27 105 Trial Run 25 120 Effect of TW 36º 24 Ref 135 150 165 180 195 210 225
  • 54.
    0 90 45 30 150 345 330 315 CW = 110g @ 354º TW = 75g @ 30º Rotation 60 30 75 28 Effect of TW 36º 90 27 105 Trial Run 25 120 Effect of TW 36º 24 Ref 135 150 165 180 195 210 225
  • 55.
    B Ba al la an nc ci in ng g C Ca as se e s st tu ud dy y ◆This is a real life case where in-situ balancing was done on the coupling of a Turbo driven Compressor. ◆ Initial Vibration analysis showed high levels at the Power Turbine bearing closest to the coupling. ◆ In the current situation the machine can not be run up to full operating speed without tripping due to high vibration. ◆ In-situ balancing was done in an attempt to reduce the vibration experienced on this machine.
  • 56.
    ◆ Large roundorbit plot from PT brg. ◆ 90º phase difference between X and Y probes
  • 57.
    ◆ Spectrum showshigh amplitude 1x rpm peak. ◆ All the hallmarks of an unbalance problem.
  • 58.
    B Ba al la an nc ci in ng g C Ca as se e s st tu ud dy y ◆Balancing would be attempted by mounting weights in these holes in the coupling. ◆ Weights will be grub screws. ◆ There are ten holes around the coupling for weight application.
  • 59.
    Rotation 8 9 0 7 ◆ The couplingwas already marked from a previous job. 10 6 ◆ The number 8 lined up with the keyphasor so it becomes our ZERO. 90 27 1 5 2 180 4 3
  • 60.
    180 3 2 4 8 9 0 7 Rotation 10 6 90 RefRun: 2.04 mils @ 252º 270 1 5
  • 61.
    180 3 2 4 8 9 0 7 Rotation TW =1.9 @ 18º 10 6 90 Ref Run: 2.04 mils @ 252º 270 1 5 Trial Run: 2.04 mils @ 206º
  • 62.
    180 3 2 4 8 9 0 7 Rotation TW =1.9 @ 18º 10 6 90 Ref Run: 2.04 mils @ 252º 270 67º 1 5 Angle measured = 67º Effect of TW = 1.61 mils Trial Run: 2.04 mils @ 206º
  • 63.
    180 3 2 4 8 9 0 7 Rotation TW =1.9 @ 18º 10 6 90 67º Ref Run: 2.04 mils @ 252º 270 67º 1 5 Angle measured = 67º Effect of TW = 1.61 mils Trial Run: 2.04 mils @ 206º
  • 64.
    B Ba al la an nc ci in ng g C Ca as se e s st tu ud dy y ◆How Much should the correction weight be? ◆ Where will it be located? ◆ What problems do you face with this situation?
  • 65.
  • 66.
  • 67.
    V Vi ib br ra at ti io on n S St ta an nd da ar rd ds s & &T To ol le er ra an nc ce es s ◆ Transducers and Machinery analyzers provide the data that is evaluated against standards and limits to help judge the machine condition. ◆ Overall levels of vibration are typically judged in terms of limits: Acceptance of new machines, normal, surveillance and shutdown. ◆ Usually the levels are compared over some period of time to establish trends. ◆ Levels of overall vibration will be in either Peak-Peak, Peak or RMS.
  • 68.
    V Vi ib br ra at ti io on n S St ta an nd da ar rd ds s & &T To ol le er ra an nc ce es s ◆ Guidelines for acceptable vibration levels are based on shaft or casing vibration measurements. ◆ Shaft vibration is used to asses the condition of machines with fluid film bearings with large relative motion in the bearings and with a high casing to rotor weight ratio. ◆ Casing and bearing cap vibration is used on general machines with rolling element bearings as part of most condition monitoring programs.
  • 69.
    E Ev va al lu ua at ti io on n o of f S Sh ha af ft tV Vi ib br ra at ti io on n ◆ Shaft vibration is measured with proximity probes that are mounted as close as possible to th bearings. ◆ When two probes are used at the bearing, an orbit of the shafts motion can be determined as well as the position of the shaft inside the bearing. ◆ From this information, accurate assessment of bearing condition can be made from the measurements.
  • 71.