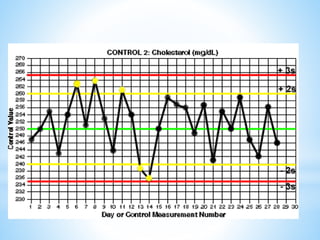
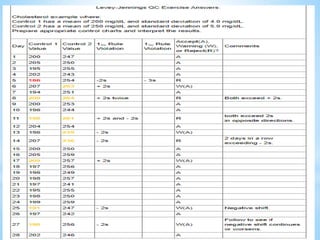
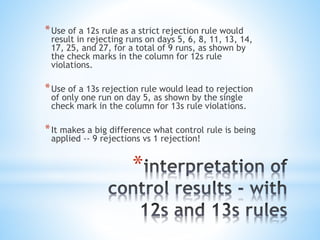
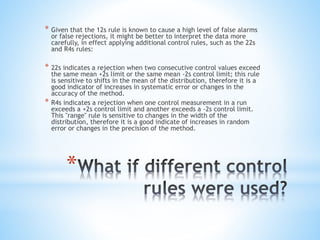
SlideShare a Scribd company logo
1 of 32
By safinaz ghareeb
*
*This exercise is intended to show, in step-wise
fashion, how to construct a Levey-Jennings control
chart, plot control values, and interpret those
results. This assumes you already have (a) selected
appropriate control materials, (b) analyzed those
materials to characterize method performance by
collecting a minimum of 20 measurements over at
least 10 days, (c) calculated the mean and standard
deviation of those data, and (d) selected the
number of control measurements to be used per run
and (e) selected the control rules to be applied.
*
*For a cholesterol method, two different
commercial control products have been
selected that have concentrations near the
important medical decision levels of 200 mg/dL
and 240 mg/dL identified by the National
Cholesterol Education Program (NCEP)
guidelines for test interpretation. The
materials were analyzed once per day for a
period of twenty days. From these data, the
means and standard deviations were calculated
to be:
*
* Two sets of control limits will be needed to implement the rules described above. The
first set uses 2s control limits (for implementation of the 12s rule) calculated as the
mean plus or minus 2 times the standard deviation. The second set uses 3s control
limits (for implementation of the 13s rule) calculated as the mean plus or minus 3
times the standard deviation.
* For this example, Control 1 has a mean of 200 and a standard deviation of 4 mg/dL.
* The upper control limit would be:
* 200 + 2*4, which is 208 mg/dL.
* The lower control limit would be:
* 200 - 2*4, or 192 mg/dL.
* What are the 3s control limits for Control 1?
* What are the 2s control limits for Control 2?
* What are the 3s control limits for Control 2?
*
*This exercise shows how to construct control
charts manually using standard graph paper.
For this exercise, graph paper having 10x10 or
20x20 lines per inch works well. You will need
two sheets, one for each chart of the two
control materials. While it is possible to
prepare both charts on a single sheet, this may
reduce the readability of the control charts. If
you do not have graph paper available at this
time, print out the lower resolution grids
below.
*
*. Include the name of the test and the name of the
control material in a prominent place so that this
information is quickly and easily discerned when
viewing the chart. The measurement unit, in this
case mg/dL, can be included in the label or
included in the label for the y-axis. Other
information typically included on the chart are the
name of the analytical system, the lot number of
the control material, the current mean and
standard deviation, and the time period covered by
the chart.
*
*. The vertical or y-axis represents the observed control
value and you need to set the scale to accomodate the
lowest and highest results expected. A generally useful
scale is to allow for a value as low as the mean - 4
standard deviations and a value as high as the mean +
4 standard deviations. For this example, the chart for
Control 1 should be scaled to accomodate a range
from 200 - 4*4, which is 184, to 200 + 4*4, which is
216. This can be rounded to 180 to 220 to fit the
10x10 or 20x20 grids of the graph paper. Mark off and
identify appropriate concentrations on the y-axis.
Label the y-axis "Control value." What is the range for
scaling the chart for Control 2?
*
*On the y-axis, locate the values that
correspond to the mean and draw a green
horizontal line (at 200 mg/dL for Control 1).
Locate the values that correspond to the mean
+2s and the mean -2s and draw yellow
horizontal lines (at 192 and 208 for Control 1).
Locate the values that correspond to the mean
+3s and the mean -3s and draw red horizontal
lines (at 188 and 212 for control 1). What are
the mean and control limit lines for Control 2?
*
* Once the control charts have been set up, you start plotting
the new control values that are being collected as part of
your routine work. The idea is that, for a stable testing
process, the new control measurements should show the
same distribution as the past control measurements. That
means it will be somewhat unusual to see a control value
that exceeds a 2s control limit and very rare to see a control
value that exceeds a 3s control limit. If the method is
unstable and has some kind of problem, then there should be
a higher chance of seeing control values that exceed the
control limits. Therefore, when the control values fall within
the expected distribution, you classify the run to be "in-
control," accept the results, and report patient test results.
When the control values fall outside the expected
distribution, you classify the run as "out-of-control," reject
the test values, and do not report patient test results.
*
* For practice, the accompanying table provides some control
results for our example cholesterol method. Plot these
results, one from Control 1 and one from Control 2, for each
day. You can print the Levey-Jennings QC Practice Exercise
(below) to obtain a worksheet that shows all these control
results. For day 1, the value for Control 1 is 200 and Control
2 is 247. On the chart for Control 1, find the value of 1 on
the x-axis and the value of 200 on the y-axis, follow the
gridlines to where they intersect, and place a mark; it should
fall on the mean line. On the chart for Control 2, find the
value of 1 on the x-axis and the value of 247 on the y-axis,
then mark that point; it should fall a little below the mean
line. In plotting control values, it is common practice to draw
lines connecting the data points on the control chart to
provide a stronger visual impression and make it easier to
see patterns and shifts.
*
* Apply the 12s and 13s control rules and make a decision whether you should accept or
reject the run for each day. The control values for the first day are in-control and the
patient results can be reported. Continue plotting the 2 control values per day and
interpreting those results. Circle those points that correspond to runs that should be
rejected. Keep track of the control rules that are violated on the worksheet for the
Levey-Jennings QC Practice Exercise.
* Patient results obtained in runs where the 13s rule is violated are most likely
incorrect. Results obtained in runs where the 12s rule is violated may or may not be
incorrect because there is about a 10% chance of this occurring even when the method
is working perfectly. This is a "false alarm" problem that is inherent with the use of 2s
control limits with an N of 2.
* In spite of this serious limitation, many laboratories continue to use 2s control limits
an just routinely repeat the run and the controls, or sometimes repeat only the
controls by themselves. Note that if a control is out a second time, the actual control
rule that is being used to reject a run is a 22s rule rather than the stated 12s rule.
Unfortunately, the 22s rule by itself is not very sensitive, therefore, it is better to use
the 13s and 22s rules together in a multirule procedure to improve error detection
while, at the same time, maintaining a low false rejection rate. We'll provide more
discussion of multirule QC procedures in a later lesson.
*
*Use of a 12s rule as a strict rejection rule would
result in rejecting runs on days 5, 6, 8, 11, 13, 14,
17, 25, and 27, for a total of 9 runs, as shown by
the check marks in the column for 12s rule
violations.
*Use of a 13s rejection rule would lead to rejection
of only one run on day 5, as shown by the single
check mark in the column for 13s rule violations.
*It makes a big difference what control rule is being
applied -- 9 rejections vs 1 rejection!
*
* Given that the 12s rule is known to cause a high level of false alarms
or false rejections, it might be better to interpret the data more
carefully, in effect applying additional control rules, such as the 22s
and R4s rules:
* 22s indicates a rejection when two consecutive control values exceed
the same mean +2s limit or the same mean -2s control limit; this rule
is sensitive to shifts in the mean of the distribution, therefore it is a
good indicator of increases in systematic error or changes in the
accuracy of the method.
* R4s indicates a rejection when one control measurement in a run
exceeds a +2s control limit and another exceeds a -2s control limit.
This "range" rule is sensitive to changes in the width of the
distribution, therefore it is a good indicate of increases in random
error or changes in the precision of the method.
*Use of the 13s rule together with the 22s and
R4s rules leads to a multirule QC procedure in
which multiple decision criteria are applied
simultaneously.
* If any single control rule is violated, the run is
rejected. Here's how the 13s/22s/R4s multirule
procedure would be interpreted for this
example set of control results:
*
*The value for Control 1 exceeds a -3s control
limit, which is a good indication that there is a
problem with the method. Stop, reject the
run, trouble-shoot the method, fix the cause of
the problem, then restart the method and
reanalyze the patient specimens.
*
*The value for Control 2 exceeds a +2s control
limit, but doesn't exceed a 3s limit. There
might be a problem, but this might also be a
false rejection. If a 12s rule were strictly
applied, the run would be rejected. However,
because the value for Control 1 is okay, it is
likely that this is a false rejection. Accept the
run.
*
* Both the values for Control 1 and Control 2 exceed
their respective +2s control limits. It is rare to see
two values in a row exceed the same +2s limit,
therefore this occurrence indicates a problem with
the method. Note that this interpretation applies
the 22s control rule, i.e., 2 values in a row
exceeding the same control limit. Since both
controls are out in the same direction, it is likely
there is a systematic error (or problem with the
accuracy of the method). Stop, reject the run,
trouble-shoot the method, fix the cause of the
problem, then restart the method and reanalyze the
patient specimens.
*
*Both control values exceed 2s control limits, but
one is positive and one is negative. It is a rare
occurrence and most likely there is a problem with
the method. Since the two controls are out in
opposite directions, it is likely that there is a
random error (or problem with the precision of the
method).
*Note that this interpretation applies the R4s rule,
i.e., the range of the control values exceeds 4s.
Stop, reject the run, trouble- shoot the method, fix
the cause of the problem, then restart the method
and reanalyze the patient specimens.
*
*The value for Control 2 is outside the low end
of the 2s range. There is a warning of a
possible problem, but this might also be a false
rejection. Accept this run because none of the
rejection rules are violated.
*
*The value for Control 2 is again outside the low
end of the 2s range. This makes 2 days or 2
runs in a row, which is unusual. Since both
values for Control 2 are out in the same
direction, it is likely there is a systematic error
(or problem with the accuracy of the method).
Stop, reject the run, trouble-shoot the
method, fix the cause of the problem, then
restart the method and reanalyze the patient
specimens.
*
*Control 1 exceeds the +2s control limit. There
might be a problem, but this might also be a
false rejection. If a 12s rule were strictly
applied, the run would be rejected. However,
because the value for Control 2 is okay, it is
likely that this is a false rejection. Accept the
run.
*
*Control 1 exceeds the -2s control limit. There
might be a problem, but this might also be a
false rejection. If a 12s rule were strictly
applied, the run would be rejected. However,
because the value for Control 2 is okay, it is
likely that this is a false rejection. Accept the
run.
*
*Control 1 exceeds the -2s control limit. There
might be a problem, but this might also be a
false rejection. If a 12s rule were strickly
applied, the run would be rejected. However,
because the value for Control 2 is okay, it is
likely that this is a false rejection. Accept the
run.
basic quality control practice in medical lab.pptx

More Related Content

Similar to basic quality control practice in medical lab.pptx

Quality management system BY M .REJA
Quality management system BY M .REJAQuality management system BY M .REJA
Quality management system BY M .REJAMamunReja1
 
General Principles of Quality control.ppt
General Principles of Quality control.pptGeneral Principles of Quality control.ppt
General Principles of Quality control.pptDrMAnwar2
 
Haemoglobin quality control by maintaining levey jennings chart
Haemoglobin quality control by maintaining levey jennings chartHaemoglobin quality control by maintaining levey jennings chart
Haemoglobin quality control by maintaining levey jennings chartDr Rashmi Sood
 
Share_Total_Quality_Management.pptx
Share_Total_Quality_Management.pptxShare_Total_Quality_Management.pptx
Share_Total_Quality_Management.pptxRiyaKaushal21ZO042
 
lect 7 quality control quant tests slides.pdf
lect 7 quality control quant tests slides.pdflect 7 quality control quant tests slides.pdf
lect 7 quality control quant tests slides.pdfmariammansour18
 
lect 7 quality control quant tests slides.pdf
lect 7 quality control quant tests slides.pdflect 7 quality control quant tests slides.pdf
lect 7 quality control quant tests slides.pdfmariammansour18
 
4th SEALNET meeting, item 8: Training on internal quality control - QC Charts
4th SEALNET meeting, item 8: Training on internal quality control - QC Charts4th SEALNET meeting, item 8: Training on internal quality control - QC Charts
4th SEALNET meeting, item 8: Training on internal quality control - QC ChartsSoils FAO-GSP
 
Item 3. Internal quality control - Quality Control Charts
Item 3. Internal quality control - Quality Control ChartsItem 3. Internal quality control - Quality Control Charts
Item 3. Internal quality control - Quality Control ChartsSoils FAO-GSP
 
1st NENALAB Meeting_Item 32: How to interpret the results of an internal QC: ...
1st NENALAB Meeting_Item 32: How to interpret the results of an internal QC: ...1st NENALAB Meeting_Item 32: How to interpret the results of an internal QC: ...
1st NENALAB Meeting_Item 32: How to interpret the results of an internal QC: ...Soils FAO-GSP
 
Control of analytical quality using stable control materials postgrad
Control of analytical quality using stable control materials postgradControl of analytical quality using stable control materials postgrad
Control of analytical quality using stable control materials postgradMedhatEldeeb2
 
Management quality management Lec 4
Management quality management Lec 4Management quality management Lec 4
Management quality management Lec 4cairo university
 
Statistical process control
Statistical process control Statistical process control
Statistical process control Hardil Shah
 

Similar to basic quality control practice in medical lab.pptx (20)

Quality management system BY M .REJA
Quality management system BY M .REJAQuality management system BY M .REJA
Quality management system BY M .REJA
 
General Principles of Quality control.ppt
General Principles of Quality control.pptGeneral Principles of Quality control.ppt
General Principles of Quality control.ppt
 
Haemoglobin quality control by maintaining levey jennings chart
Haemoglobin quality control by maintaining levey jennings chartHaemoglobin quality control by maintaining levey jennings chart
Haemoglobin quality control by maintaining levey jennings chart
 
Share_Total_Quality_Management.pptx
Share_Total_Quality_Management.pptxShare_Total_Quality_Management.pptx
Share_Total_Quality_Management.pptx
 
WESTGARD RULES
WESTGARD RULESWESTGARD RULES
WESTGARD RULES
 
lect 7 quality control quant tests slides.pdf
lect 7 quality control quant tests slides.pdflect 7 quality control quant tests slides.pdf
lect 7 quality control quant tests slides.pdf
 
lect 7 quality control quant tests slides.pdf
lect 7 quality control quant tests slides.pdflect 7 quality control quant tests slides.pdf
lect 7 quality control quant tests slides.pdf
 
Quality assurance
Quality assuranceQuality assurance
Quality assurance
 
4th SEALNET meeting, item 8: Training on internal quality control - QC Charts
4th SEALNET meeting, item 8: Training on internal quality control - QC Charts4th SEALNET meeting, item 8: Training on internal quality control - QC Charts
4th SEALNET meeting, item 8: Training on internal quality control - QC Charts
 
Item 3. Internal quality control - Quality Control Charts
Item 3. Internal quality control - Quality Control ChartsItem 3. Internal quality control - Quality Control Charts
Item 3. Internal quality control - Quality Control Charts
 
1st NENALAB Meeting_Item 32: How to interpret the results of an internal QC: ...
1st NENALAB Meeting_Item 32: How to interpret the results of an internal QC: ...1st NENALAB Meeting_Item 32: How to interpret the results of an internal QC: ...
1st NENALAB Meeting_Item 32: How to interpret the results of an internal QC: ...
 
Control of analytical quality using stable control materials postgrad
Control of analytical quality using stable control materials postgradControl of analytical quality using stable control materials postgrad
Control of analytical quality using stable control materials postgrad
 
100018718.ppt
100018718.ppt100018718.ppt
100018718.ppt
 
Management quality management Lec 4
Management quality management Lec 4Management quality management Lec 4
Management quality management Lec 4
 
Troubleshooting IQC / EQAS
Troubleshooting IQC / EQASTroubleshooting IQC / EQAS
Troubleshooting IQC / EQAS
 
Troubleshooting iqc eqas 19.07.2018
Troubleshooting iqc eqas 19.07.2018Troubleshooting iqc eqas 19.07.2018
Troubleshooting iqc eqas 19.07.2018
 
Methods and Philosophy of SPC
Methods and Philosophy of SPCMethods and Philosophy of SPC
Methods and Philosophy of SPC
 
Statistical process control
Statistical process control Statistical process control
Statistical process control
 
Msa presentation
Msa presentationMsa presentation
Msa presentation
 
Westgard rules
Westgard rulesWestgard rules
Westgard rules
 

Recently uploaded

Pathways to Equality: The Role of Men and Women in Gender Equity
Pathways to Equality:          The Role of Men and Women in Gender EquityPathways to Equality:          The Role of Men and Women in Gender Equity
Pathways to Equality: The Role of Men and Women in Gender EquityAtharv Kurhade
 
2024 PCP #IMPerative Updates in Rheumatology
2024 PCP #IMPerative Updates in Rheumatology2024 PCP #IMPerative Updates in Rheumatology
2024 PCP #IMPerative Updates in RheumatologySidney Erwin Manahan
 
RESPIRATORY ALKALOSIS & RESPIRATORY ACIDOSIS.pdf
RESPIRATORY ALKALOSIS & RESPIRATORY ACIDOSIS.pdfRESPIRATORY ALKALOSIS & RESPIRATORY ACIDOSIS.pdf
RESPIRATORY ALKALOSIS & RESPIRATORY ACIDOSIS.pdfDolisha Warbi
 
Top 10 Famous Indian Pornstar - Top 10 Female Porn Star Name List 2024
Top 10 Famous Indian Pornstar - Top 10 Female Porn Star Name List 2024Top 10 Famous Indian Pornstar - Top 10 Female Porn Star Name List 2024
Top 10 Famous Indian Pornstar - Top 10 Female Porn Star Name List 2024Inaayaeventcompany
 
Agra Call Girl 📲 ( 9084454195 ) ⏎ Independent Call Girls In Agra By Meera
Agra Call Girl 📲 ( 9084454195 ) ⏎ Independent Call Girls In Agra By MeeraAgra Call Girl 📲 ( 9084454195 ) ⏎ Independent Call Girls In Agra By Meera
Agra Call Girl 📲 ( 9084454195 ) ⏎ Independent Call Girls In Agra By MeeraInaayaeventcompany
 
CALCIUM - ELECTROLYTE IMBALANCE (HYPERCALCEMIA & HYPOCALCEMIA).pdf
CALCIUM - ELECTROLYTE IMBALANCE (HYPERCALCEMIA & HYPOCALCEMIA).pdfCALCIUM - ELECTROLYTE IMBALANCE (HYPERCALCEMIA & HYPOCALCEMIA).pdf
CALCIUM - ELECTROLYTE IMBALANCE (HYPERCALCEMIA & HYPOCALCEMIA).pdfDolisha Warbi
 
The Events of Cardiac Cycle - Wigger's Diagram
The Events of Cardiac Cycle - Wigger's DiagramThe Events of Cardiac Cycle - Wigger's Diagram
The Events of Cardiac Cycle - Wigger's DiagramMedicoseAcademics
 
❤️ Chandigarh Call Girls Service ☎️99158-51334☎️ Escort service in Chandigarh...
❤️ Chandigarh Call Girls Service ☎️99158-51334☎️ Escort service in Chandigarh...❤️ Chandigarh Call Girls Service ☎️99158-51334☎️ Escort service in Chandigarh...
❤️ Chandigarh Call Girls Service ☎️99158-51334☎️ Escort service in Chandigarh...rajveerescorts2022
 
Coach Dan Quinn Commanders Feather T Shirts
Coach Dan Quinn Commanders Feather T ShirtsCoach Dan Quinn Commanders Feather T Shirts
Coach Dan Quinn Commanders Feather T Shirtsrahman018755
 
Test Bank -Medical-Surgical Nursing Concepts for Interprofessional Collaborat...
Test Bank -Medical-Surgical Nursing Concepts for Interprofessional Collaborat...Test Bank -Medical-Surgical Nursing Concepts for Interprofessional Collaborat...
Test Bank -Medical-Surgical Nursing Concepts for Interprofessional Collaborat...rightmanforbloodline
 
Russian Call Girls Delhi 🧍🏼‍♀️🧍🏼‍♀️(91X0X0X912🧍🏼‍♀️🧍🏼‍♀️ Russian Call Girls S...
Russian Call Girls Delhi 🧍🏼‍♀️🧍🏼‍♀️(91X0X0X912🧍🏼‍♀️🧍🏼‍♀️ Russian Call Girls S...Russian Call Girls Delhi 🧍🏼‍♀️🧍🏼‍♀️(91X0X0X912🧍🏼‍♀️🧍🏼‍♀️ Russian Call Girls S...
Russian Call Girls Delhi 🧍🏼‍♀️🧍🏼‍♀️(91X0X0X912🧍🏼‍♀️🧍🏼‍♀️ Russian Call Girls S...Inaayaeventcompany
 
No Advance 931~602~0077 Goa ✂️ Call Girl , Indian Call Girl Goa For Full nig...
No Advance  931~602~0077 Goa ✂️ Call Girl , Indian Call Girl Goa For Full nig...No Advance  931~602~0077 Goa ✂️ Call Girl , Indian Call Girl Goa For Full nig...
No Advance 931~602~0077 Goa ✂️ Call Girl , Indian Call Girl Goa For Full nig...Real Sex Provide In Goa
 
Goa Call Girl 931~602~0077 Call ✂️ Girl Service Vip Top Model Safe
Goa Call Girl  931~602~0077 Call ✂️ Girl Service Vip Top Model SafeGoa Call Girl  931~602~0077 Call ✂️ Girl Service Vip Top Model Safe
Goa Call Girl 931~602~0077 Call ✂️ Girl Service Vip Top Model SafeReal Sex Provide In Goa
 
Call Girls in Rajkot, (Riya) call me [ 7014168258 ] escort service 24X7
Call Girls in Rajkot, (Riya) call me [ 7014168258 ] escort service 24X7Call Girls in Rajkot, (Riya) call me [ 7014168258 ] escort service 24X7
Call Girls in Rajkot, (Riya) call me [ 7014168258 ] escort service 24X7Call Girls
 
VIP Just Call 9548273370 Lucknow Top Class Call Girls Number | 8630512678 Esc...
VIP Just Call 9548273370 Lucknow Top Class Call Girls Number | 8630512678 Esc...VIP Just Call 9548273370 Lucknow Top Class Call Girls Number | 8630512678 Esc...
VIP Just Call 9548273370 Lucknow Top Class Call Girls Number | 8630512678 Esc...meghakumariji156
 
👉Jalandhar Call Girl Service👉📞 98724-41143 👉📞 Just📲 NISHA -RANA-Call Girls In...
👉Jalandhar Call Girl Service👉📞 98724-41143 👉📞 Just📲 NISHA -RANA-Call Girls In...👉Jalandhar Call Girl Service👉📞 98724-41143 👉📞 Just📲 NISHA -RANA-Call Girls In...
👉Jalandhar Call Girl Service👉📞 98724-41143 👉📞 Just📲 NISHA -RANA-Call Girls In...Rashmi Entertainment
 
TEST BANK For Little and Falace's Dental Management of the Medically Compromi...
TEST BANK For Little and Falace's Dental Management of the Medically Compromi...TEST BANK For Little and Falace's Dental Management of the Medically Compromi...
TEST BANK For Little and Falace's Dental Management of the Medically Compromi...rightmanforbloodline
 
RIMJHIM $ best call girls in Agra Call Girls Service 👉📞 7014168258 👉📞 Just📲 C...
RIMJHIM $ best call girls in Agra Call Girls Service 👉📞 7014168258 👉📞 Just📲 C...RIMJHIM $ best call girls in Agra Call Girls Service 👉📞 7014168258 👉📞 Just📲 C...
RIMJHIM $ best call girls in Agra Call Girls Service 👉📞 7014168258 👉📞 Just📲 C...Call Girls
 

Recently uploaded (20)

Pathways to Equality: The Role of Men and Women in Gender Equity
Pathways to Equality:          The Role of Men and Women in Gender EquityPathways to Equality:          The Role of Men and Women in Gender Equity
Pathways to Equality: The Role of Men and Women in Gender Equity
 
2024 PCP #IMPerative Updates in Rheumatology
2024 PCP #IMPerative Updates in Rheumatology2024 PCP #IMPerative Updates in Rheumatology
2024 PCP #IMPerative Updates in Rheumatology
 
Obat Penggugur Kandungan Cytotec Dan Gastrul Harga Indomaret
Obat Penggugur Kandungan Cytotec Dan Gastrul Harga IndomaretObat Penggugur Kandungan Cytotec Dan Gastrul Harga Indomaret
Obat Penggugur Kandungan Cytotec Dan Gastrul Harga Indomaret
 
RESPIRATORY ALKALOSIS & RESPIRATORY ACIDOSIS.pdf
RESPIRATORY ALKALOSIS & RESPIRATORY ACIDOSIS.pdfRESPIRATORY ALKALOSIS & RESPIRATORY ACIDOSIS.pdf
RESPIRATORY ALKALOSIS & RESPIRATORY ACIDOSIS.pdf
 
Top 10 Famous Indian Pornstar - Top 10 Female Porn Star Name List 2024
Top 10 Famous Indian Pornstar - Top 10 Female Porn Star Name List 2024Top 10 Famous Indian Pornstar - Top 10 Female Porn Star Name List 2024
Top 10 Famous Indian Pornstar - Top 10 Female Porn Star Name List 2024
 
Agra Call Girl 📲 ( 9084454195 ) ⏎ Independent Call Girls In Agra By Meera
Agra Call Girl 📲 ( 9084454195 ) ⏎ Independent Call Girls In Agra By MeeraAgra Call Girl 📲 ( 9084454195 ) ⏎ Independent Call Girls In Agra By Meera
Agra Call Girl 📲 ( 9084454195 ) ⏎ Independent Call Girls In Agra By Meera
 
Cara Menggugurkan Kandungan Secara Alami 3 Jam Tuntas
Cara Menggugurkan Kandungan Secara Alami 3 Jam TuntasCara Menggugurkan Kandungan Secara Alami 3 Jam Tuntas
Cara Menggugurkan Kandungan Secara Alami 3 Jam Tuntas
 
CALCIUM - ELECTROLYTE IMBALANCE (HYPERCALCEMIA & HYPOCALCEMIA).pdf
CALCIUM - ELECTROLYTE IMBALANCE (HYPERCALCEMIA & HYPOCALCEMIA).pdfCALCIUM - ELECTROLYTE IMBALANCE (HYPERCALCEMIA & HYPOCALCEMIA).pdf
CALCIUM - ELECTROLYTE IMBALANCE (HYPERCALCEMIA & HYPOCALCEMIA).pdf
 
The Events of Cardiac Cycle - Wigger's Diagram
The Events of Cardiac Cycle - Wigger's DiagramThe Events of Cardiac Cycle - Wigger's Diagram
The Events of Cardiac Cycle - Wigger's Diagram
 
❤️ Chandigarh Call Girls Service ☎️99158-51334☎️ Escort service in Chandigarh...
❤️ Chandigarh Call Girls Service ☎️99158-51334☎️ Escort service in Chandigarh...❤️ Chandigarh Call Girls Service ☎️99158-51334☎️ Escort service in Chandigarh...
❤️ Chandigarh Call Girls Service ☎️99158-51334☎️ Escort service in Chandigarh...
 
Coach Dan Quinn Commanders Feather T Shirts
Coach Dan Quinn Commanders Feather T ShirtsCoach Dan Quinn Commanders Feather T Shirts
Coach Dan Quinn Commanders Feather T Shirts
 
Test Bank -Medical-Surgical Nursing Concepts for Interprofessional Collaborat...
Test Bank -Medical-Surgical Nursing Concepts for Interprofessional Collaborat...Test Bank -Medical-Surgical Nursing Concepts for Interprofessional Collaborat...
Test Bank -Medical-Surgical Nursing Concepts for Interprofessional Collaborat...
 
Russian Call Girls Delhi 🧍🏼‍♀️🧍🏼‍♀️(91X0X0X912🧍🏼‍♀️🧍🏼‍♀️ Russian Call Girls S...
Russian Call Girls Delhi 🧍🏼‍♀️🧍🏼‍♀️(91X0X0X912🧍🏼‍♀️🧍🏼‍♀️ Russian Call Girls S...Russian Call Girls Delhi 🧍🏼‍♀️🧍🏼‍♀️(91X0X0X912🧍🏼‍♀️🧍🏼‍♀️ Russian Call Girls S...
Russian Call Girls Delhi 🧍🏼‍♀️🧍🏼‍♀️(91X0X0X912🧍🏼‍♀️🧍🏼‍♀️ Russian Call Girls S...
 
No Advance 931~602~0077 Goa ✂️ Call Girl , Indian Call Girl Goa For Full nig...
No Advance  931~602~0077 Goa ✂️ Call Girl , Indian Call Girl Goa For Full nig...No Advance  931~602~0077 Goa ✂️ Call Girl , Indian Call Girl Goa For Full nig...
No Advance 931~602~0077 Goa ✂️ Call Girl , Indian Call Girl Goa For Full nig...
 
Goa Call Girl 931~602~0077 Call ✂️ Girl Service Vip Top Model Safe
Goa Call Girl  931~602~0077 Call ✂️ Girl Service Vip Top Model SafeGoa Call Girl  931~602~0077 Call ✂️ Girl Service Vip Top Model Safe
Goa Call Girl 931~602~0077 Call ✂️ Girl Service Vip Top Model Safe
 
Call Girls in Rajkot, (Riya) call me [ 7014168258 ] escort service 24X7
Call Girls in Rajkot, (Riya) call me [ 7014168258 ] escort service 24X7Call Girls in Rajkot, (Riya) call me [ 7014168258 ] escort service 24X7
Call Girls in Rajkot, (Riya) call me [ 7014168258 ] escort service 24X7
 
VIP Just Call 9548273370 Lucknow Top Class Call Girls Number | 8630512678 Esc...
VIP Just Call 9548273370 Lucknow Top Class Call Girls Number | 8630512678 Esc...VIP Just Call 9548273370 Lucknow Top Class Call Girls Number | 8630512678 Esc...
VIP Just Call 9548273370 Lucknow Top Class Call Girls Number | 8630512678 Esc...
 
👉Jalandhar Call Girl Service👉📞 98724-41143 👉📞 Just📲 NISHA -RANA-Call Girls In...
👉Jalandhar Call Girl Service👉📞 98724-41143 👉📞 Just📲 NISHA -RANA-Call Girls In...👉Jalandhar Call Girl Service👉📞 98724-41143 👉📞 Just📲 NISHA -RANA-Call Girls In...
👉Jalandhar Call Girl Service👉📞 98724-41143 👉📞 Just📲 NISHA -RANA-Call Girls In...
 
TEST BANK For Little and Falace's Dental Management of the Medically Compromi...
TEST BANK For Little and Falace's Dental Management of the Medically Compromi...TEST BANK For Little and Falace's Dental Management of the Medically Compromi...
TEST BANK For Little and Falace's Dental Management of the Medically Compromi...
 
RIMJHIM $ best call girls in Agra Call Girls Service 👉📞 7014168258 👉📞 Just📲 C...
RIMJHIM $ best call girls in Agra Call Girls Service 👉📞 7014168258 👉📞 Just📲 C...RIMJHIM $ best call girls in Agra Call Girls Service 👉📞 7014168258 👉📞 Just📲 C...
RIMJHIM $ best call girls in Agra Call Girls Service 👉📞 7014168258 👉📞 Just📲 C...
 

basic quality control practice in medical lab.pptx

  • 2. *This exercise is intended to show, in step-wise fashion, how to construct a Levey-Jennings control chart, plot control values, and interpret those results. This assumes you already have (a) selected appropriate control materials, (b) analyzed those materials to characterize method performance by collecting a minimum of 20 measurements over at least 10 days, (c) calculated the mean and standard deviation of those data, and (d) selected the number of control measurements to be used per run and (e) selected the control rules to be applied.
  • 3. * *For a cholesterol method, two different commercial control products have been selected that have concentrations near the important medical decision levels of 200 mg/dL and 240 mg/dL identified by the National Cholesterol Education Program (NCEP) guidelines for test interpretation. The materials were analyzed once per day for a period of twenty days. From these data, the means and standard deviations were calculated to be:
  • 4. * * Two sets of control limits will be needed to implement the rules described above. The first set uses 2s control limits (for implementation of the 12s rule) calculated as the mean plus or minus 2 times the standard deviation. The second set uses 3s control limits (for implementation of the 13s rule) calculated as the mean plus or minus 3 times the standard deviation. * For this example, Control 1 has a mean of 200 and a standard deviation of 4 mg/dL. * The upper control limit would be: * 200 + 2*4, which is 208 mg/dL. * The lower control limit would be: * 200 - 2*4, or 192 mg/dL. * What are the 3s control limits for Control 1? * What are the 2s control limits for Control 2? * What are the 3s control limits for Control 2?
  • 5. * *This exercise shows how to construct control charts manually using standard graph paper. For this exercise, graph paper having 10x10 or 20x20 lines per inch works well. You will need two sheets, one for each chart of the two control materials. While it is possible to prepare both charts on a single sheet, this may reduce the readability of the control charts. If you do not have graph paper available at this time, print out the lower resolution grids below.
  • 6.
  • 7.
  • 8. * *. Include the name of the test and the name of the control material in a prominent place so that this information is quickly and easily discerned when viewing the chart. The measurement unit, in this case mg/dL, can be included in the label or included in the label for the y-axis. Other information typically included on the chart are the name of the analytical system, the lot number of the control material, the current mean and standard deviation, and the time period covered by the chart.
  • 9. * *. The vertical or y-axis represents the observed control value and you need to set the scale to accomodate the lowest and highest results expected. A generally useful scale is to allow for a value as low as the mean - 4 standard deviations and a value as high as the mean + 4 standard deviations. For this example, the chart for Control 1 should be scaled to accomodate a range from 200 - 4*4, which is 184, to 200 + 4*4, which is 216. This can be rounded to 180 to 220 to fit the 10x10 or 20x20 grids of the graph paper. Mark off and identify appropriate concentrations on the y-axis. Label the y-axis "Control value." What is the range for scaling the chart for Control 2?
  • 10. * *On the y-axis, locate the values that correspond to the mean and draw a green horizontal line (at 200 mg/dL for Control 1). Locate the values that correspond to the mean +2s and the mean -2s and draw yellow horizontal lines (at 192 and 208 for Control 1). Locate the values that correspond to the mean +3s and the mean -3s and draw red horizontal lines (at 188 and 212 for control 1). What are the mean and control limit lines for Control 2?
  • 11.
  • 12.
  • 13. * * Once the control charts have been set up, you start plotting the new control values that are being collected as part of your routine work. The idea is that, for a stable testing process, the new control measurements should show the same distribution as the past control measurements. That means it will be somewhat unusual to see a control value that exceeds a 2s control limit and very rare to see a control value that exceeds a 3s control limit. If the method is unstable and has some kind of problem, then there should be a higher chance of seeing control values that exceed the control limits. Therefore, when the control values fall within the expected distribution, you classify the run to be "in- control," accept the results, and report patient test results. When the control values fall outside the expected distribution, you classify the run as "out-of-control," reject the test values, and do not report patient test results.
  • 14. * * For practice, the accompanying table provides some control results for our example cholesterol method. Plot these results, one from Control 1 and one from Control 2, for each day. You can print the Levey-Jennings QC Practice Exercise (below) to obtain a worksheet that shows all these control results. For day 1, the value for Control 1 is 200 and Control 2 is 247. On the chart for Control 1, find the value of 1 on the x-axis and the value of 200 on the y-axis, follow the gridlines to where they intersect, and place a mark; it should fall on the mean line. On the chart for Control 2, find the value of 1 on the x-axis and the value of 247 on the y-axis, then mark that point; it should fall a little below the mean line. In plotting control values, it is common practice to draw lines connecting the data points on the control chart to provide a stronger visual impression and make it easier to see patterns and shifts.
  • 15.
  • 16. * * Apply the 12s and 13s control rules and make a decision whether you should accept or reject the run for each day. The control values for the first day are in-control and the patient results can be reported. Continue plotting the 2 control values per day and interpreting those results. Circle those points that correspond to runs that should be rejected. Keep track of the control rules that are violated on the worksheet for the Levey-Jennings QC Practice Exercise. * Patient results obtained in runs where the 13s rule is violated are most likely incorrect. Results obtained in runs where the 12s rule is violated may or may not be incorrect because there is about a 10% chance of this occurring even when the method is working perfectly. This is a "false alarm" problem that is inherent with the use of 2s control limits with an N of 2. * In spite of this serious limitation, many laboratories continue to use 2s control limits an just routinely repeat the run and the controls, or sometimes repeat only the controls by themselves. Note that if a control is out a second time, the actual control rule that is being used to reject a run is a 22s rule rather than the stated 12s rule. Unfortunately, the 22s rule by itself is not very sensitive, therefore, it is better to use the 13s and 22s rules together in a multirule procedure to improve error detection while, at the same time, maintaining a low false rejection rate. We'll provide more discussion of multirule QC procedures in a later lesson.
  • 17.
  • 18.
  • 19.
  • 20. * *Use of a 12s rule as a strict rejection rule would result in rejecting runs on days 5, 6, 8, 11, 13, 14, 17, 25, and 27, for a total of 9 runs, as shown by the check marks in the column for 12s rule violations. *Use of a 13s rejection rule would lead to rejection of only one run on day 5, as shown by the single check mark in the column for 13s rule violations. *It makes a big difference what control rule is being applied -- 9 rejections vs 1 rejection!
  • 21. * * Given that the 12s rule is known to cause a high level of false alarms or false rejections, it might be better to interpret the data more carefully, in effect applying additional control rules, such as the 22s and R4s rules: * 22s indicates a rejection when two consecutive control values exceed the same mean +2s limit or the same mean -2s control limit; this rule is sensitive to shifts in the mean of the distribution, therefore it is a good indicator of increases in systematic error or changes in the accuracy of the method. * R4s indicates a rejection when one control measurement in a run exceeds a +2s control limit and another exceeds a -2s control limit. This "range" rule is sensitive to changes in the width of the distribution, therefore it is a good indicate of increases in random error or changes in the precision of the method.
  • 22. *Use of the 13s rule together with the 22s and R4s rules leads to a multirule QC procedure in which multiple decision criteria are applied simultaneously. * If any single control rule is violated, the run is rejected. Here's how the 13s/22s/R4s multirule procedure would be interpreted for this example set of control results:
  • 23. * *The value for Control 1 exceeds a -3s control limit, which is a good indication that there is a problem with the method. Stop, reject the run, trouble-shoot the method, fix the cause of the problem, then restart the method and reanalyze the patient specimens.
  • 24. * *The value for Control 2 exceeds a +2s control limit, but doesn't exceed a 3s limit. There might be a problem, but this might also be a false rejection. If a 12s rule were strictly applied, the run would be rejected. However, because the value for Control 1 is okay, it is likely that this is a false rejection. Accept the run.
  • 25. * * Both the values for Control 1 and Control 2 exceed their respective +2s control limits. It is rare to see two values in a row exceed the same +2s limit, therefore this occurrence indicates a problem with the method. Note that this interpretation applies the 22s control rule, i.e., 2 values in a row exceeding the same control limit. Since both controls are out in the same direction, it is likely there is a systematic error (or problem with the accuracy of the method). Stop, reject the run, trouble-shoot the method, fix the cause of the problem, then restart the method and reanalyze the patient specimens.
  • 26. * *Both control values exceed 2s control limits, but one is positive and one is negative. It is a rare occurrence and most likely there is a problem with the method. Since the two controls are out in opposite directions, it is likely that there is a random error (or problem with the precision of the method). *Note that this interpretation applies the R4s rule, i.e., the range of the control values exceeds 4s. Stop, reject the run, trouble- shoot the method, fix the cause of the problem, then restart the method and reanalyze the patient specimens.
  • 27. * *The value for Control 2 is outside the low end of the 2s range. There is a warning of a possible problem, but this might also be a false rejection. Accept this run because none of the rejection rules are violated.
  • 28. * *The value for Control 2 is again outside the low end of the 2s range. This makes 2 days or 2 runs in a row, which is unusual. Since both values for Control 2 are out in the same direction, it is likely there is a systematic error (or problem with the accuracy of the method). Stop, reject the run, trouble-shoot the method, fix the cause of the problem, then restart the method and reanalyze the patient specimens.
  • 29. * *Control 1 exceeds the +2s control limit. There might be a problem, but this might also be a false rejection. If a 12s rule were strictly applied, the run would be rejected. However, because the value for Control 2 is okay, it is likely that this is a false rejection. Accept the run.
  • 30. * *Control 1 exceeds the -2s control limit. There might be a problem, but this might also be a false rejection. If a 12s rule were strictly applied, the run would be rejected. However, because the value for Control 2 is okay, it is likely that this is a false rejection. Accept the run.
  • 31. * *Control 1 exceeds the -2s control limit. There might be a problem, but this might also be a false rejection. If a 12s rule were strickly applied, the run would be rejected. However, because the value for Control 2 is okay, it is likely that this is a false rejection. Accept the run.