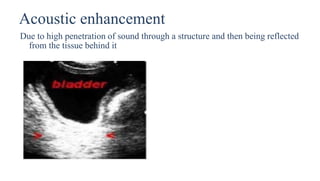
Ultrasound physics document summarized in 3 sentences:
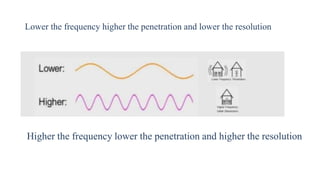
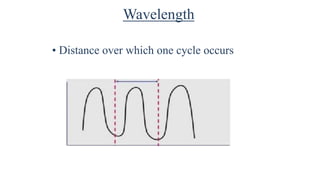
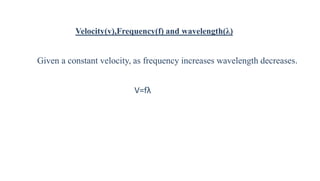
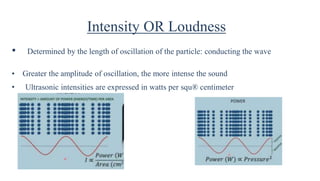
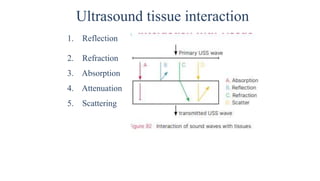
Ultrasound uses high frequency sound waves to image inside the body, with the speed of sound determining wavelength and frequency affecting penetration depth and resolution. Sound is transmitted and received by transducers using the piezoelectric effect, and reflected at tissue interfaces to form 2D images showing anatomical structures. Factors such as absorption, scattering, and impedance determine the interaction of ultrasound with different tissues.