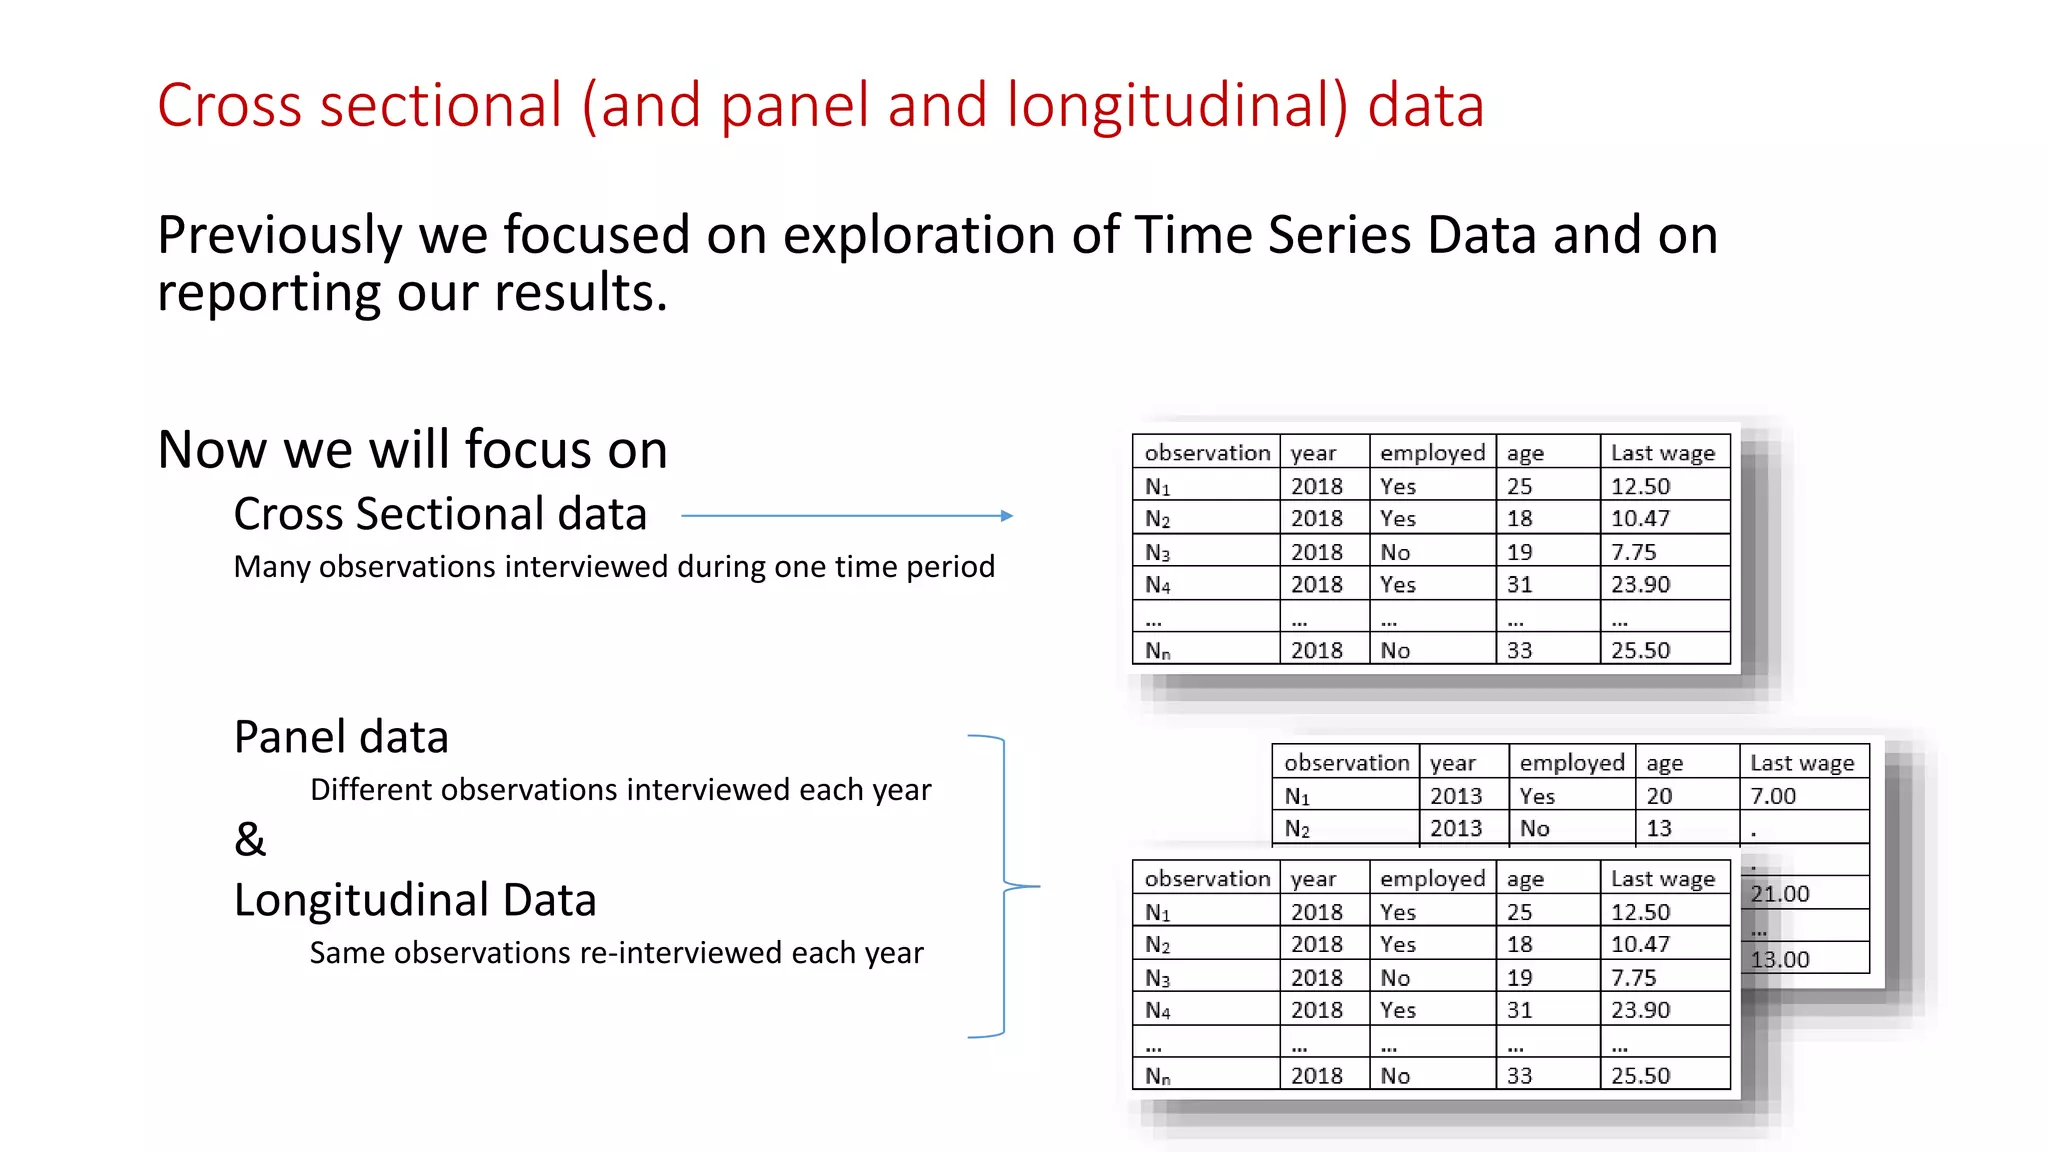
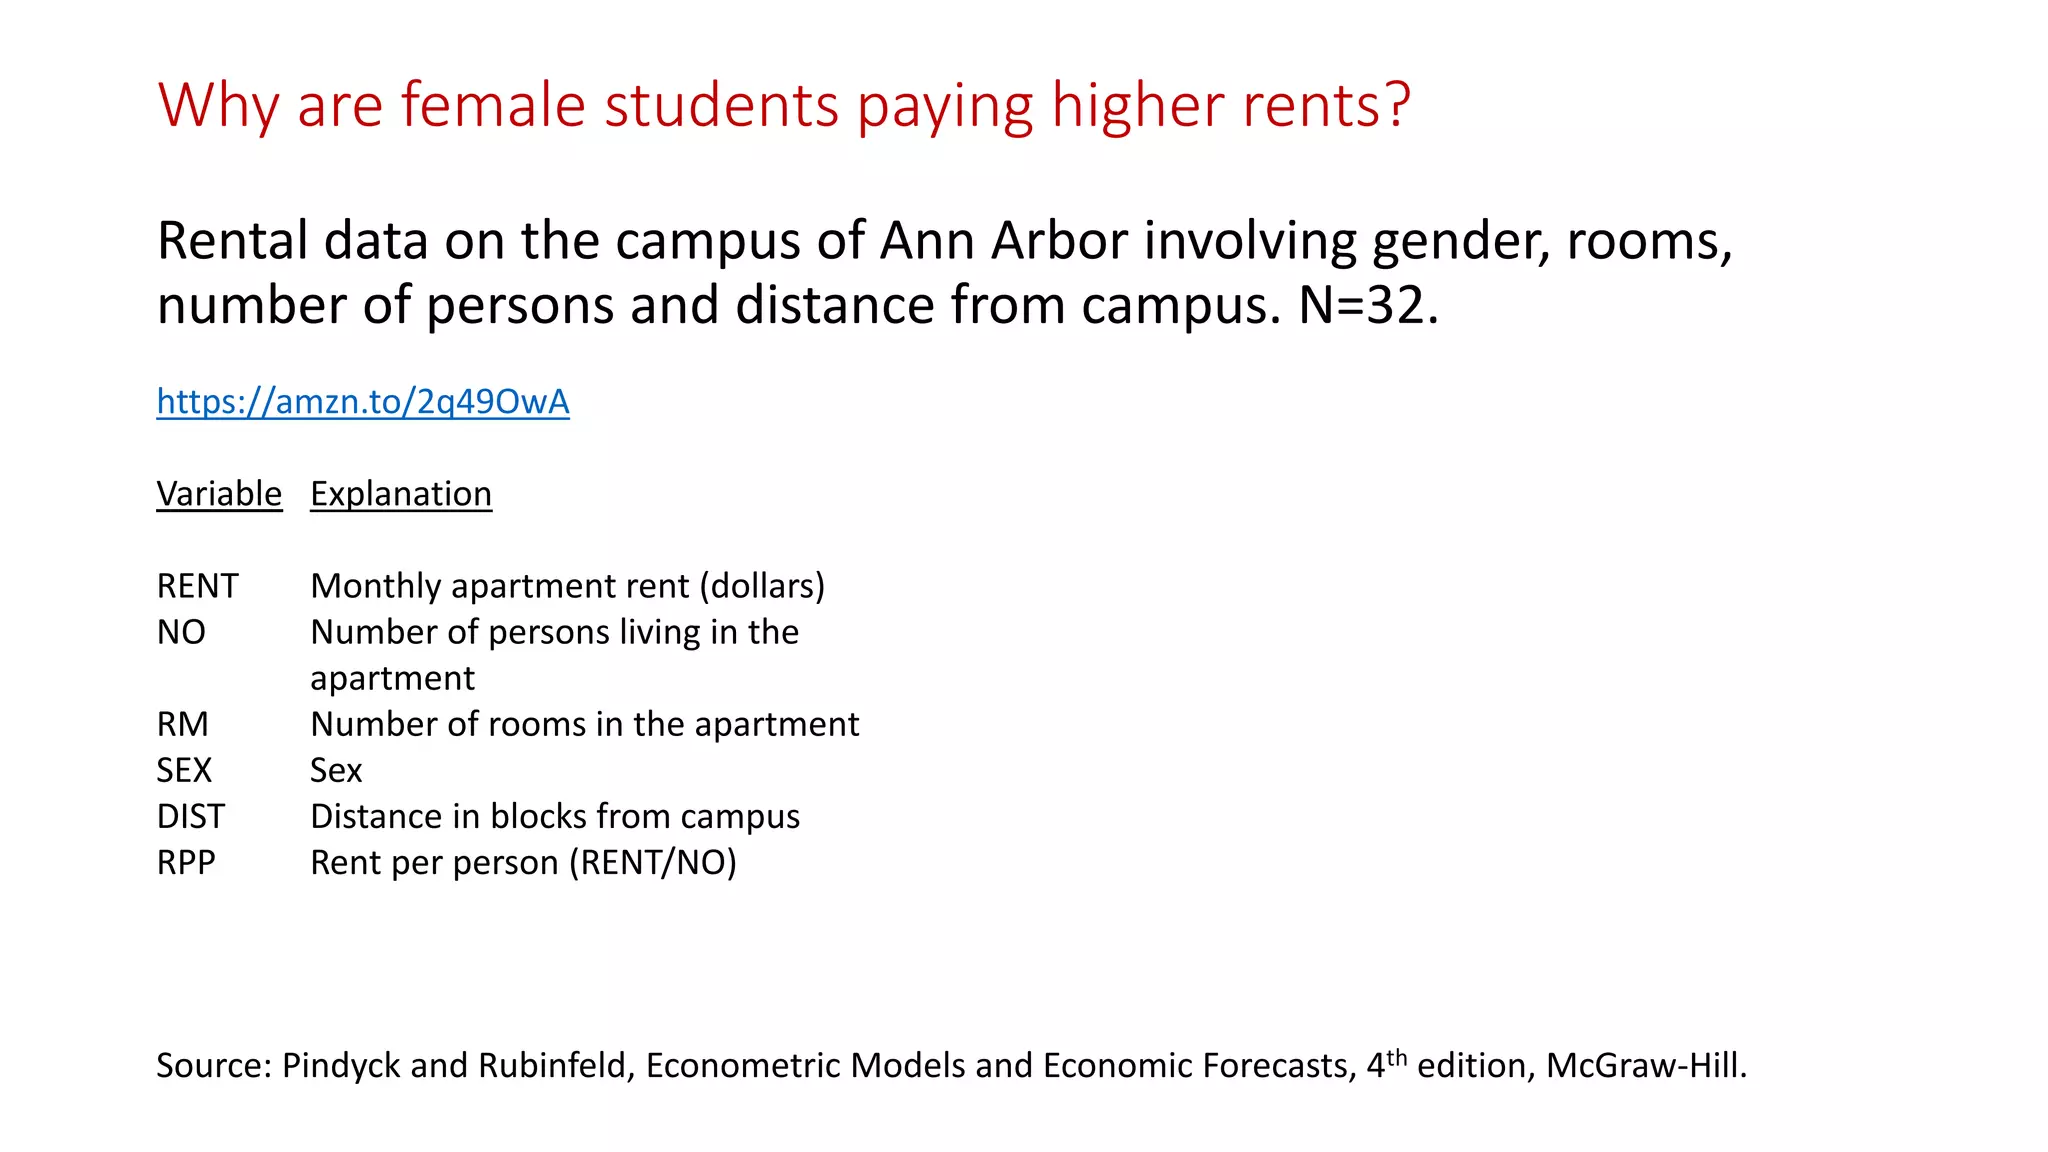
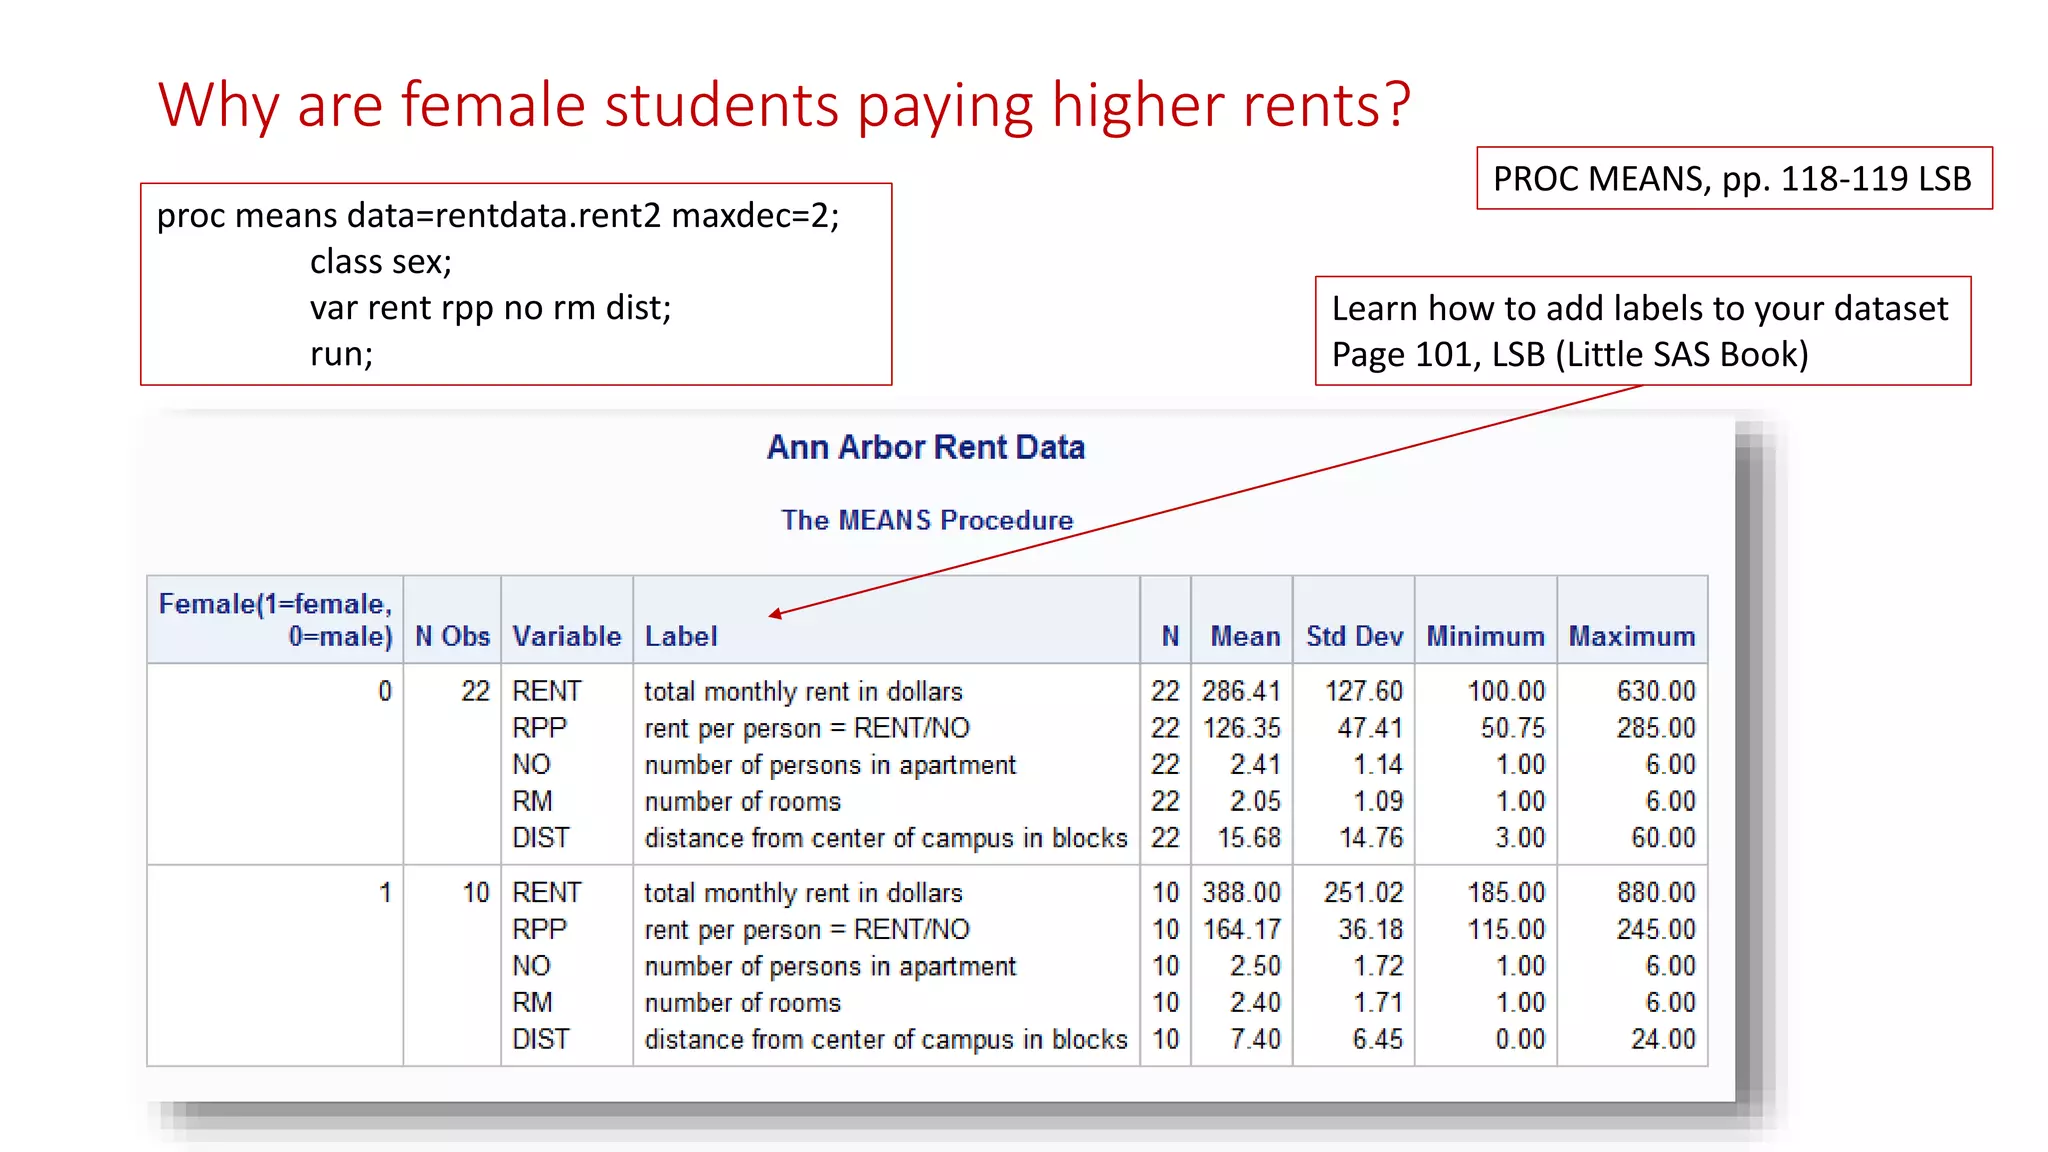
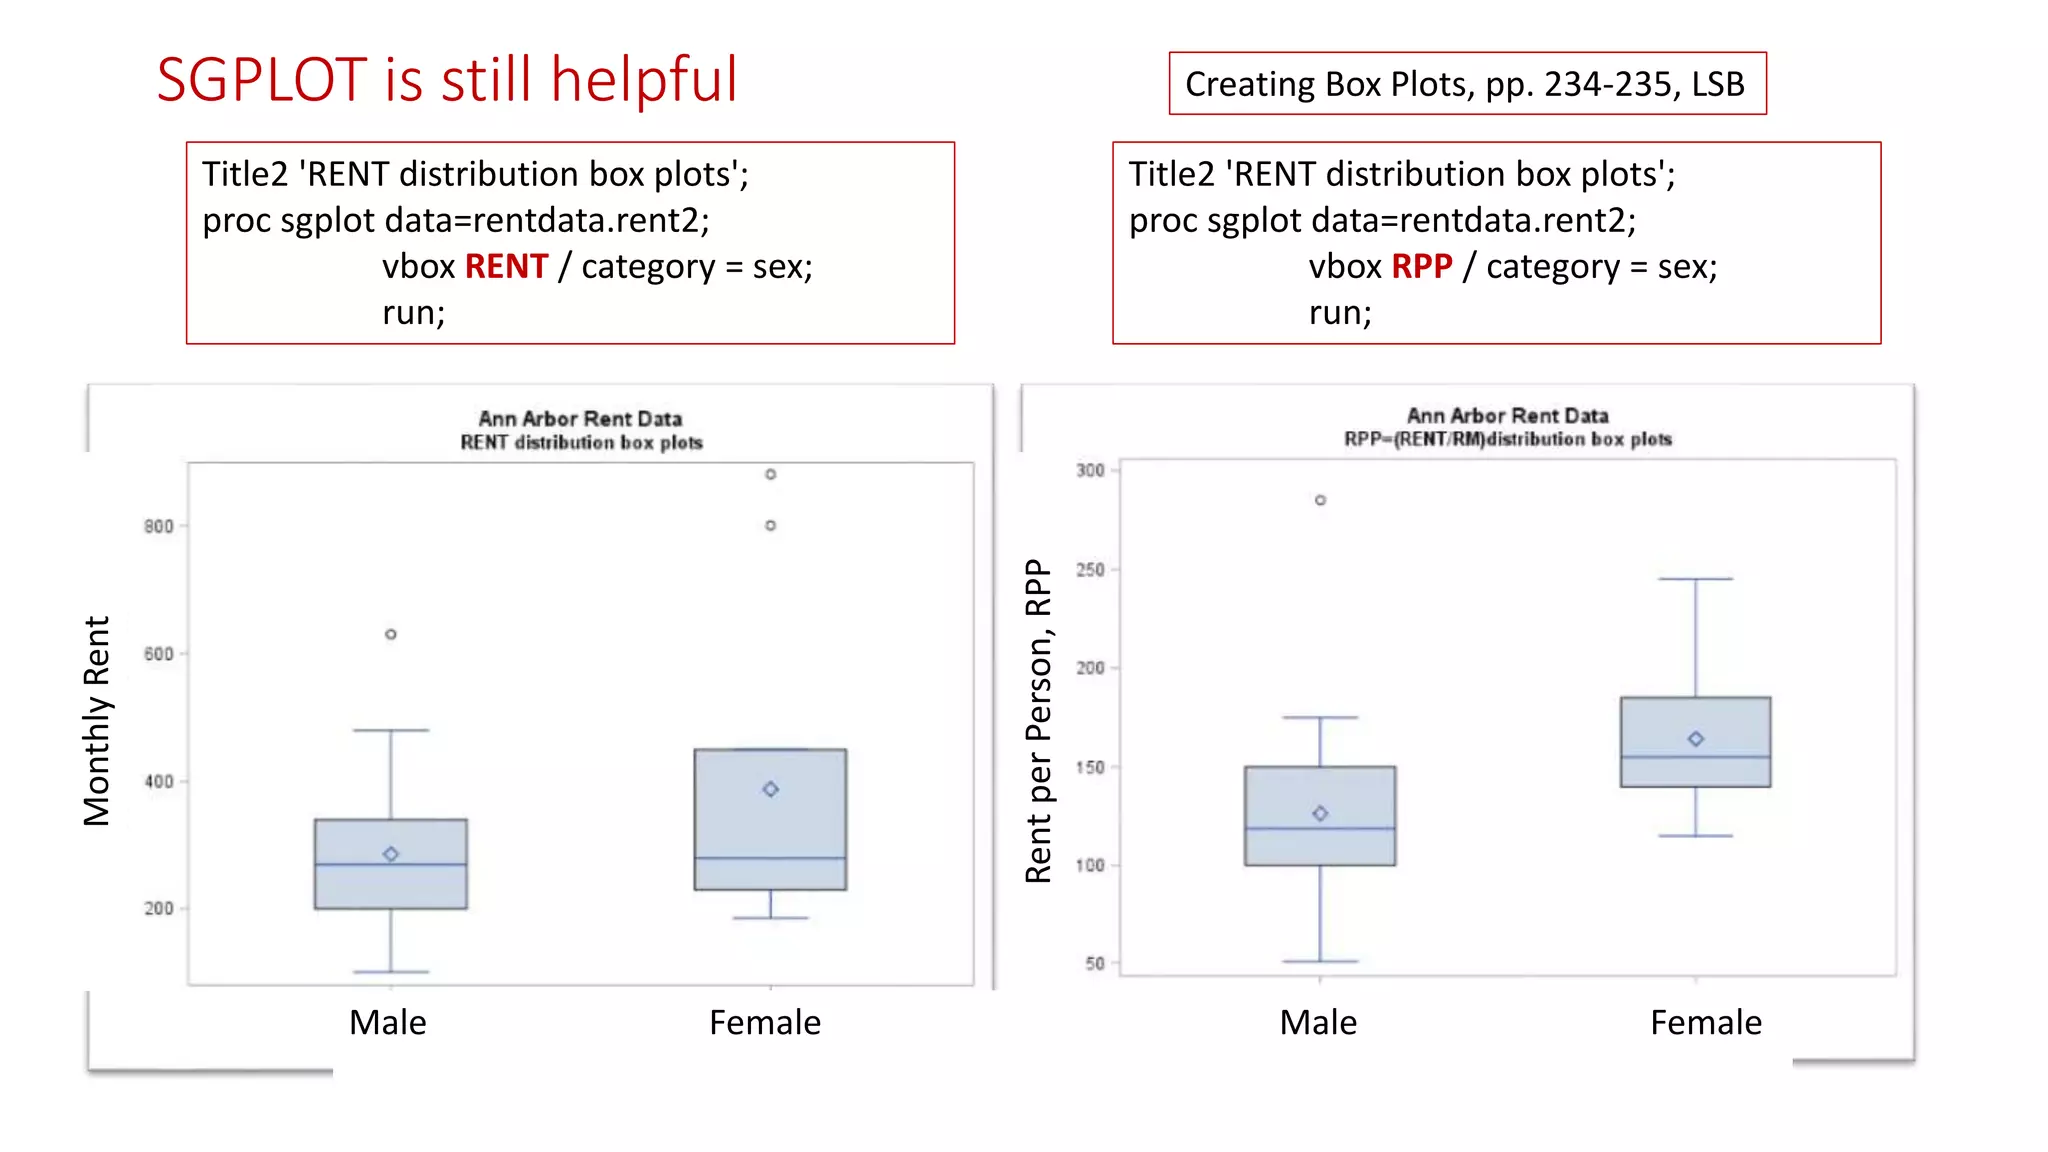
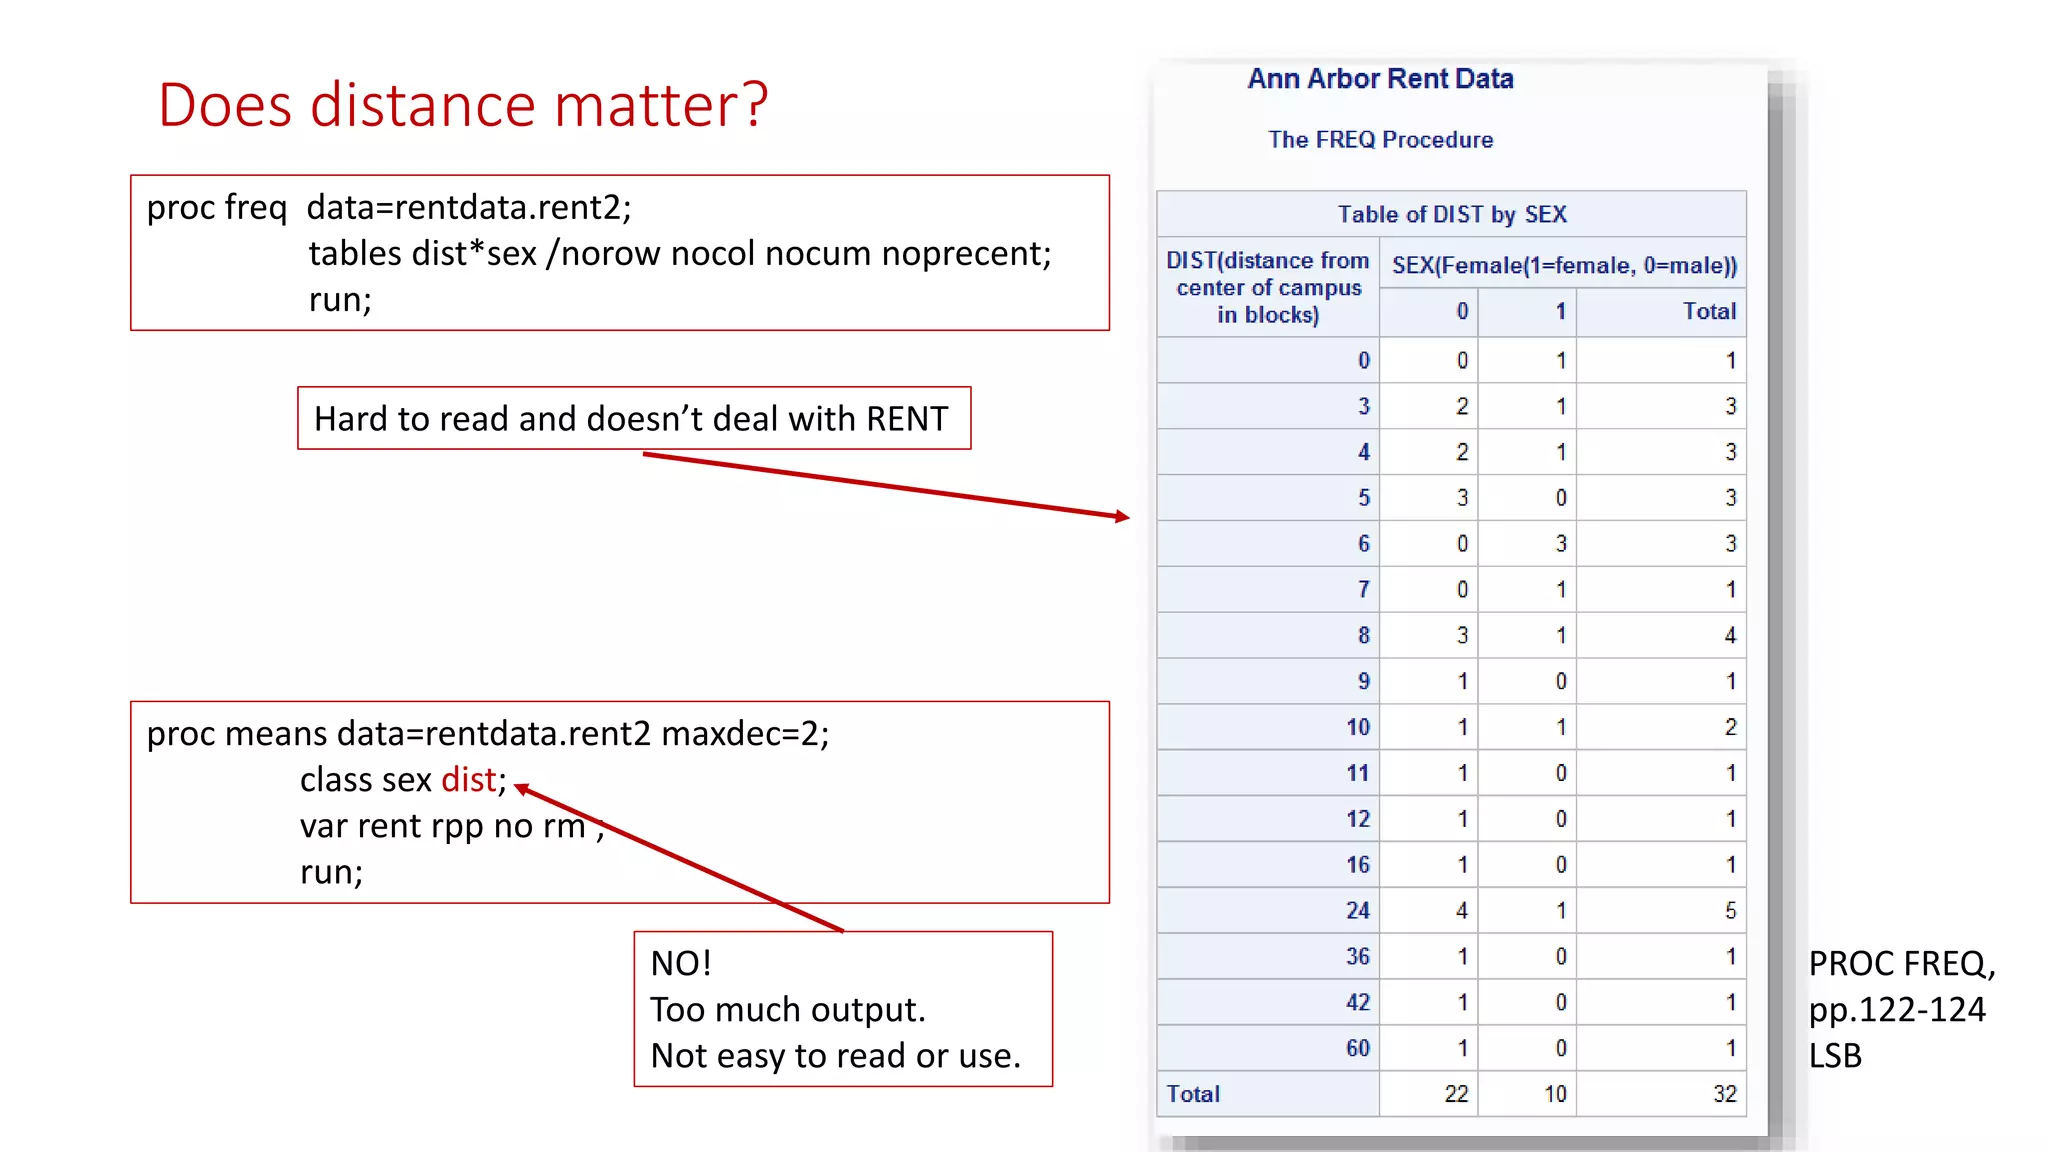
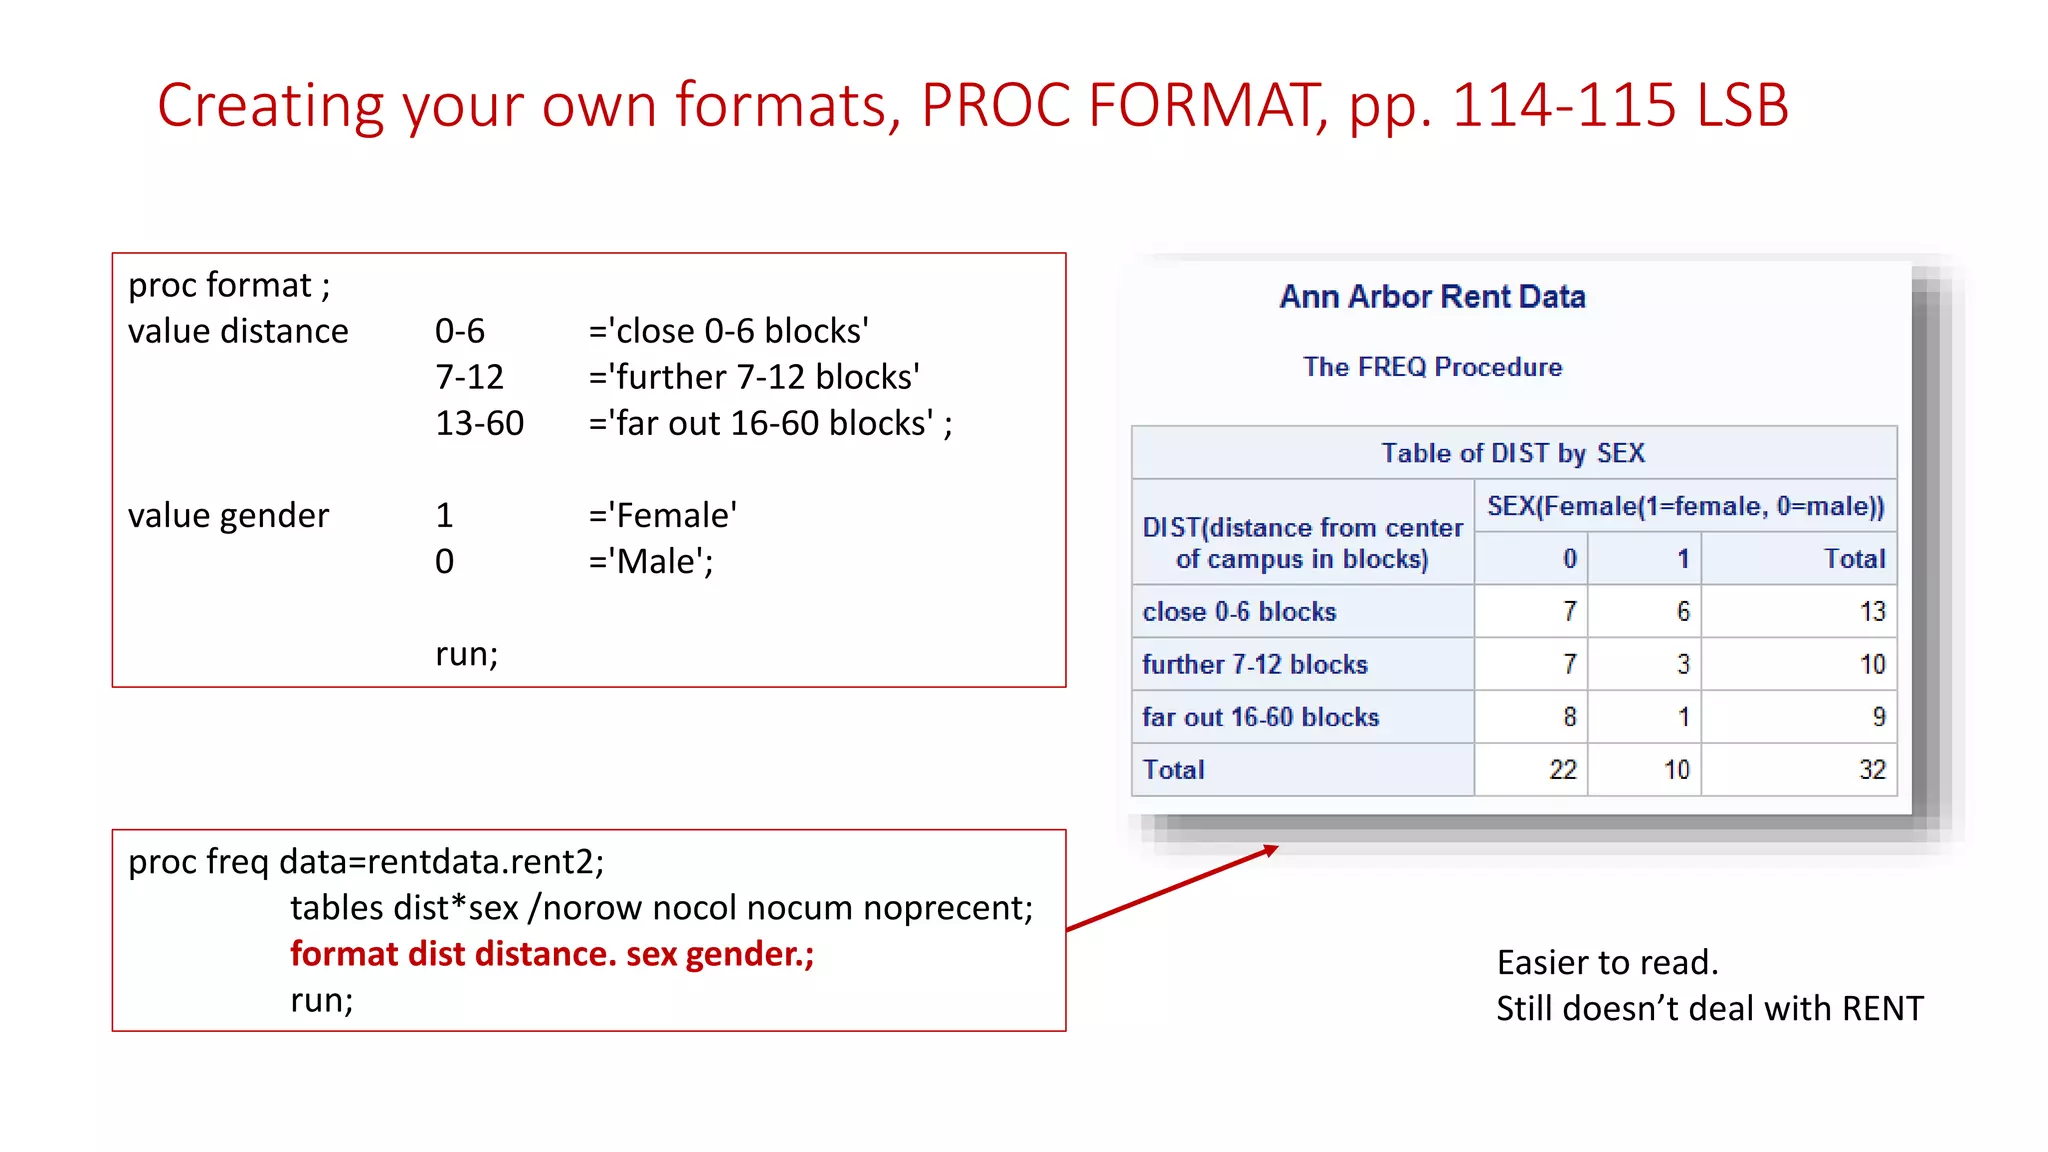
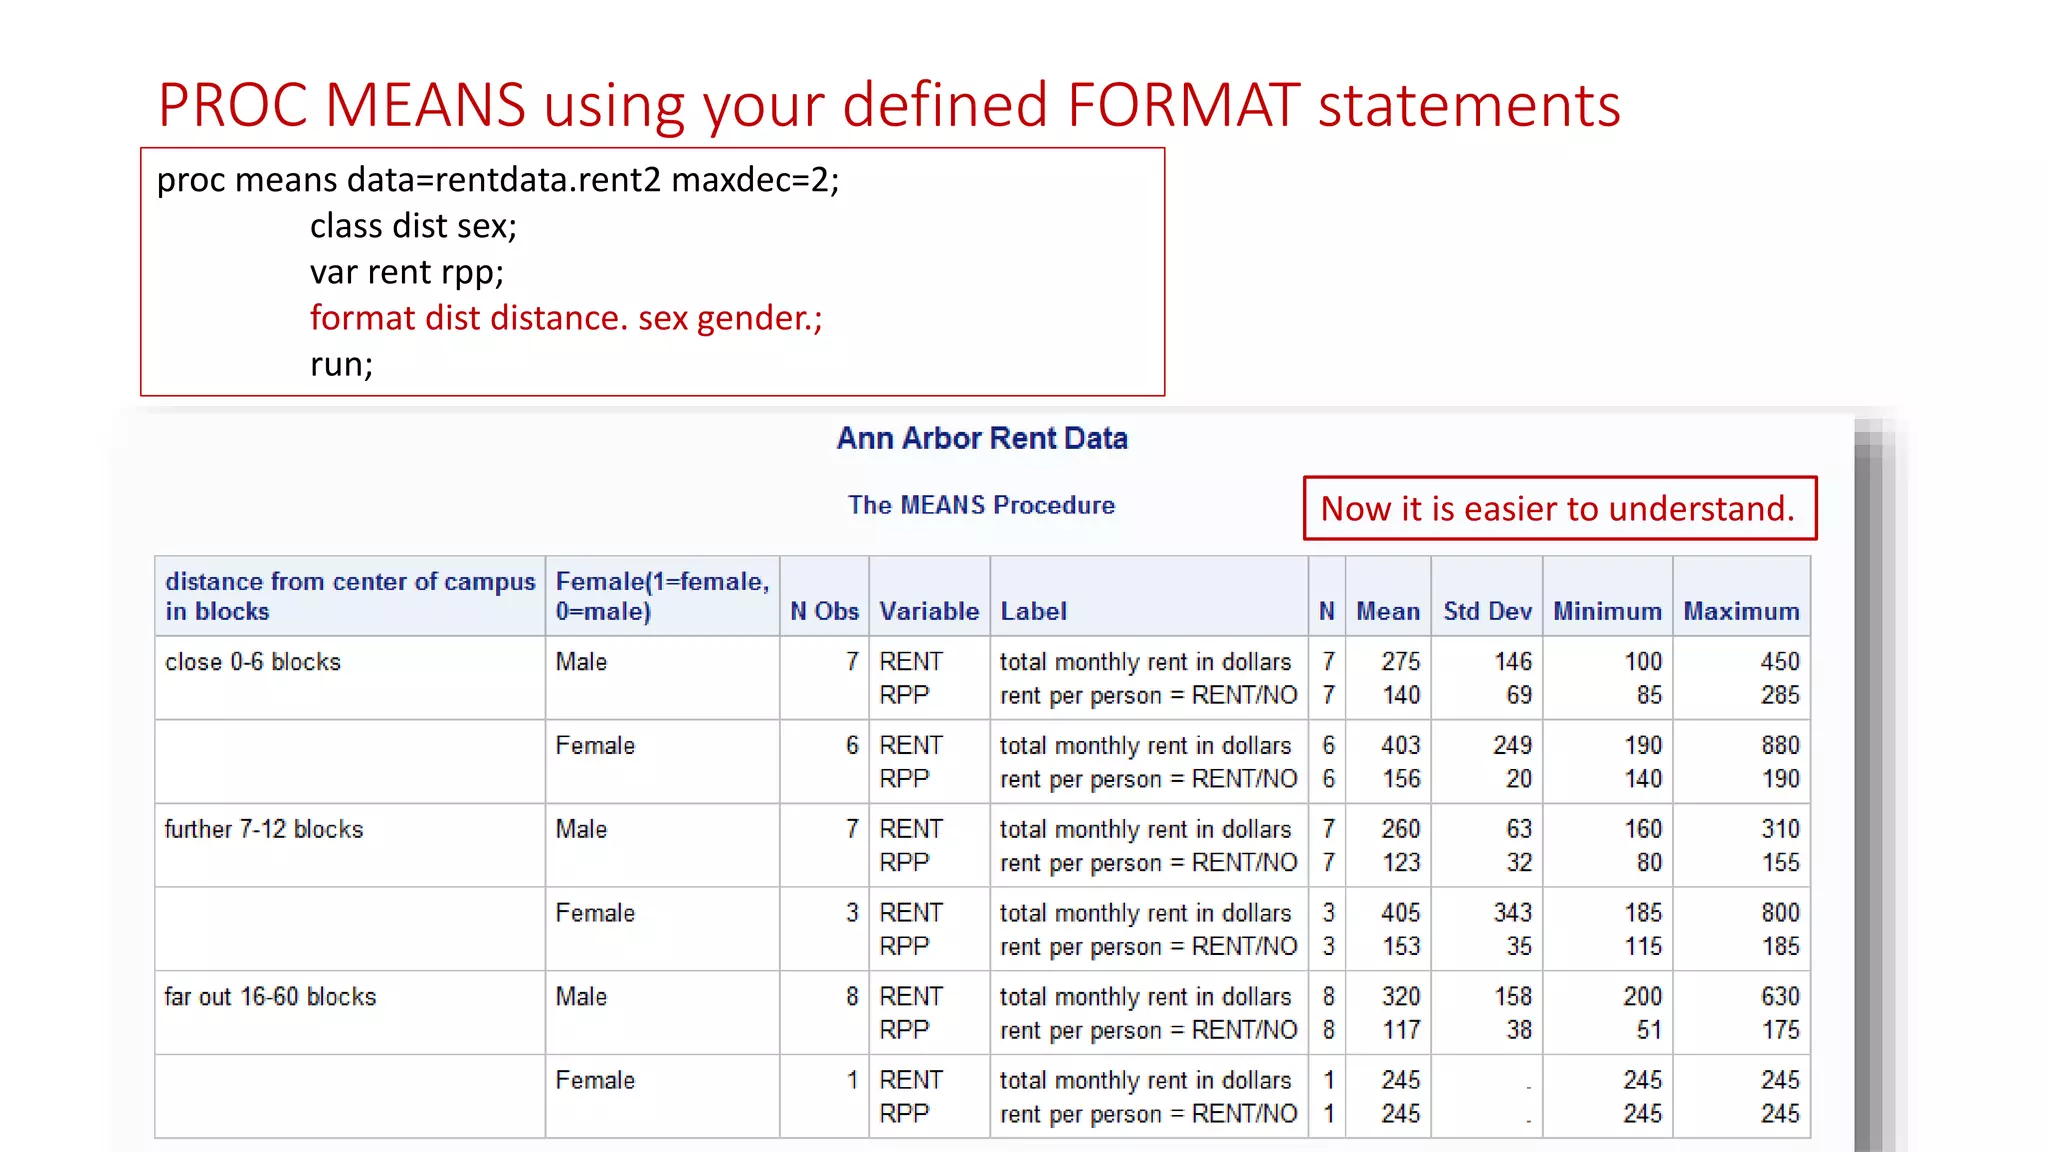
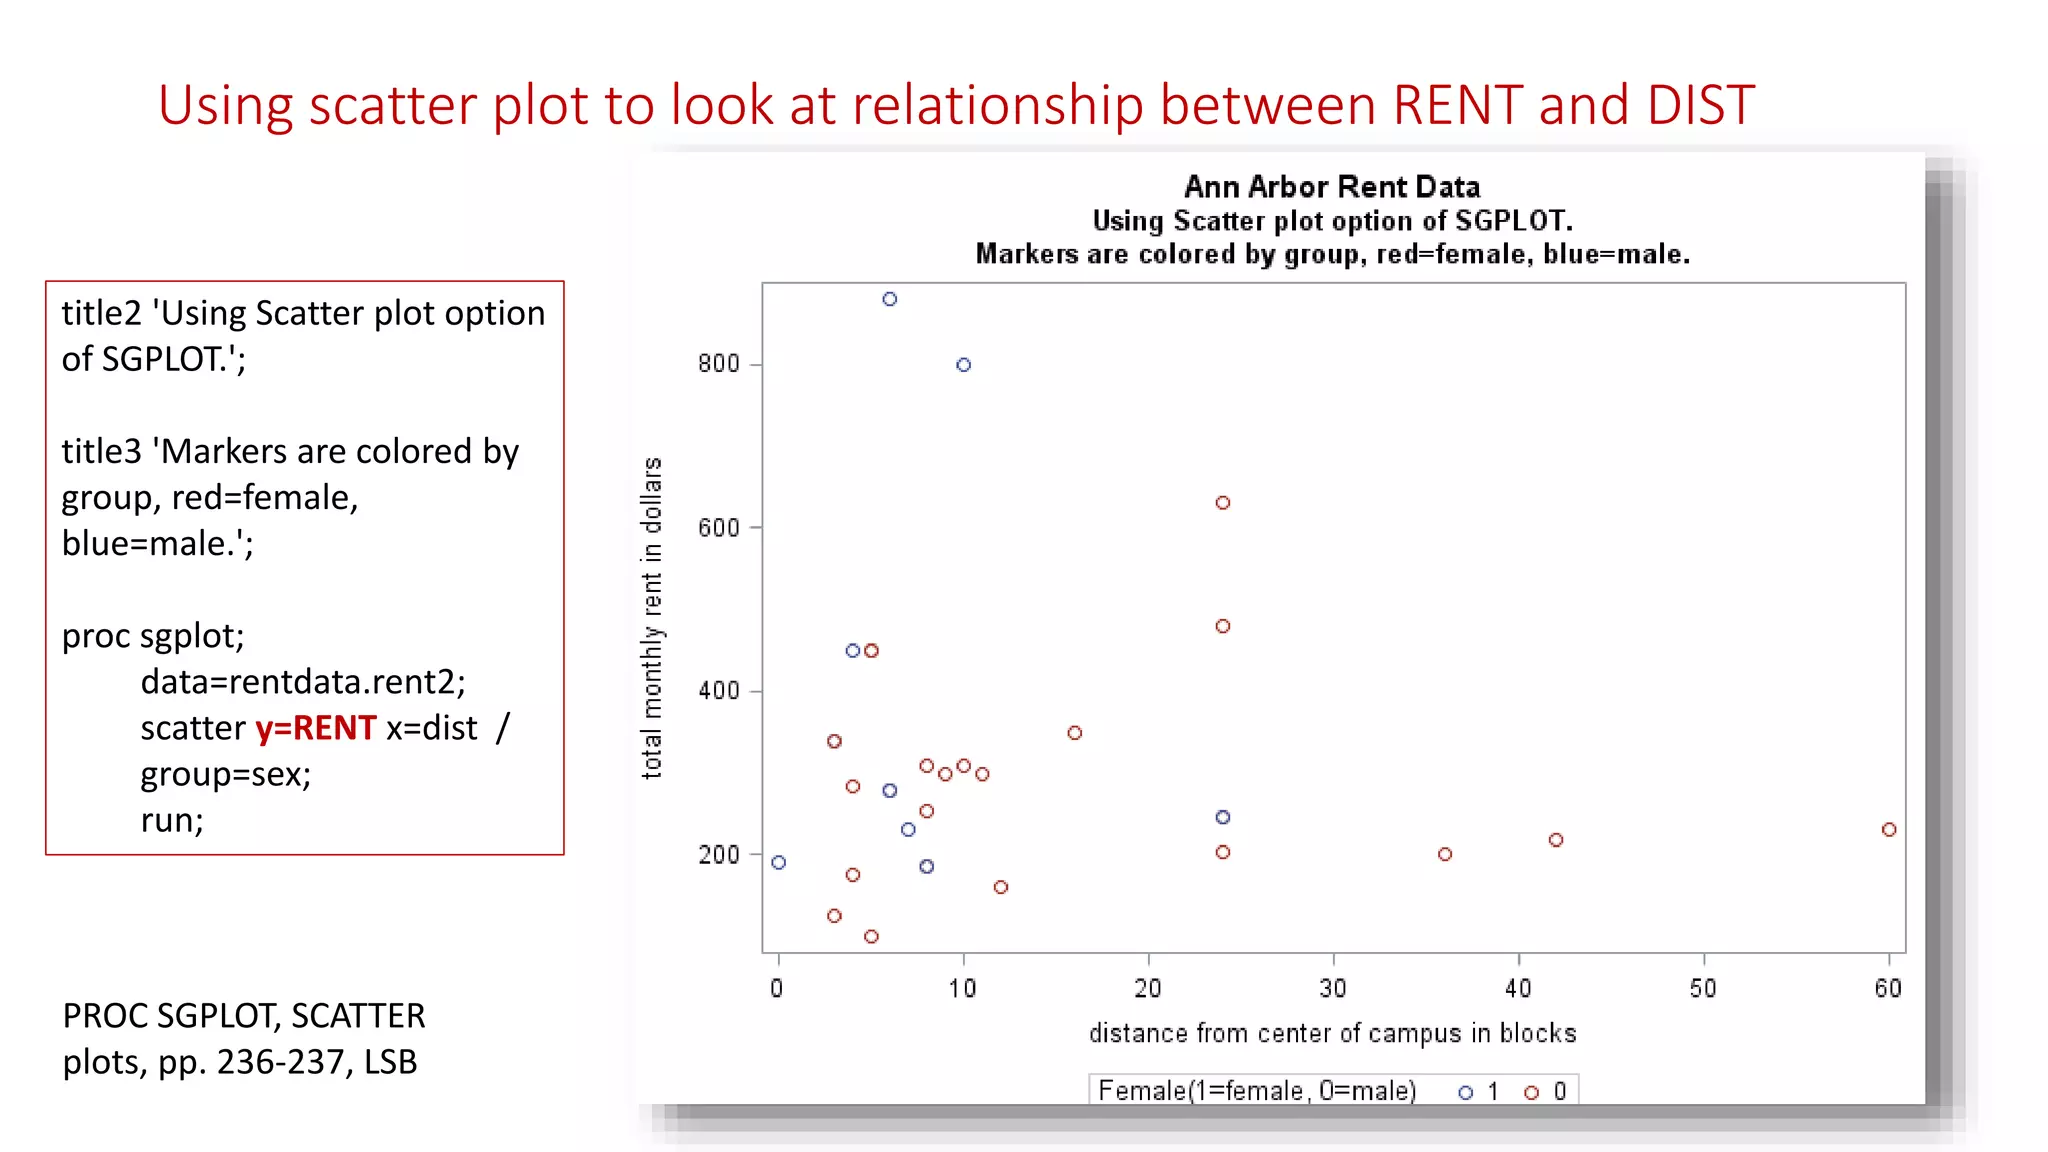
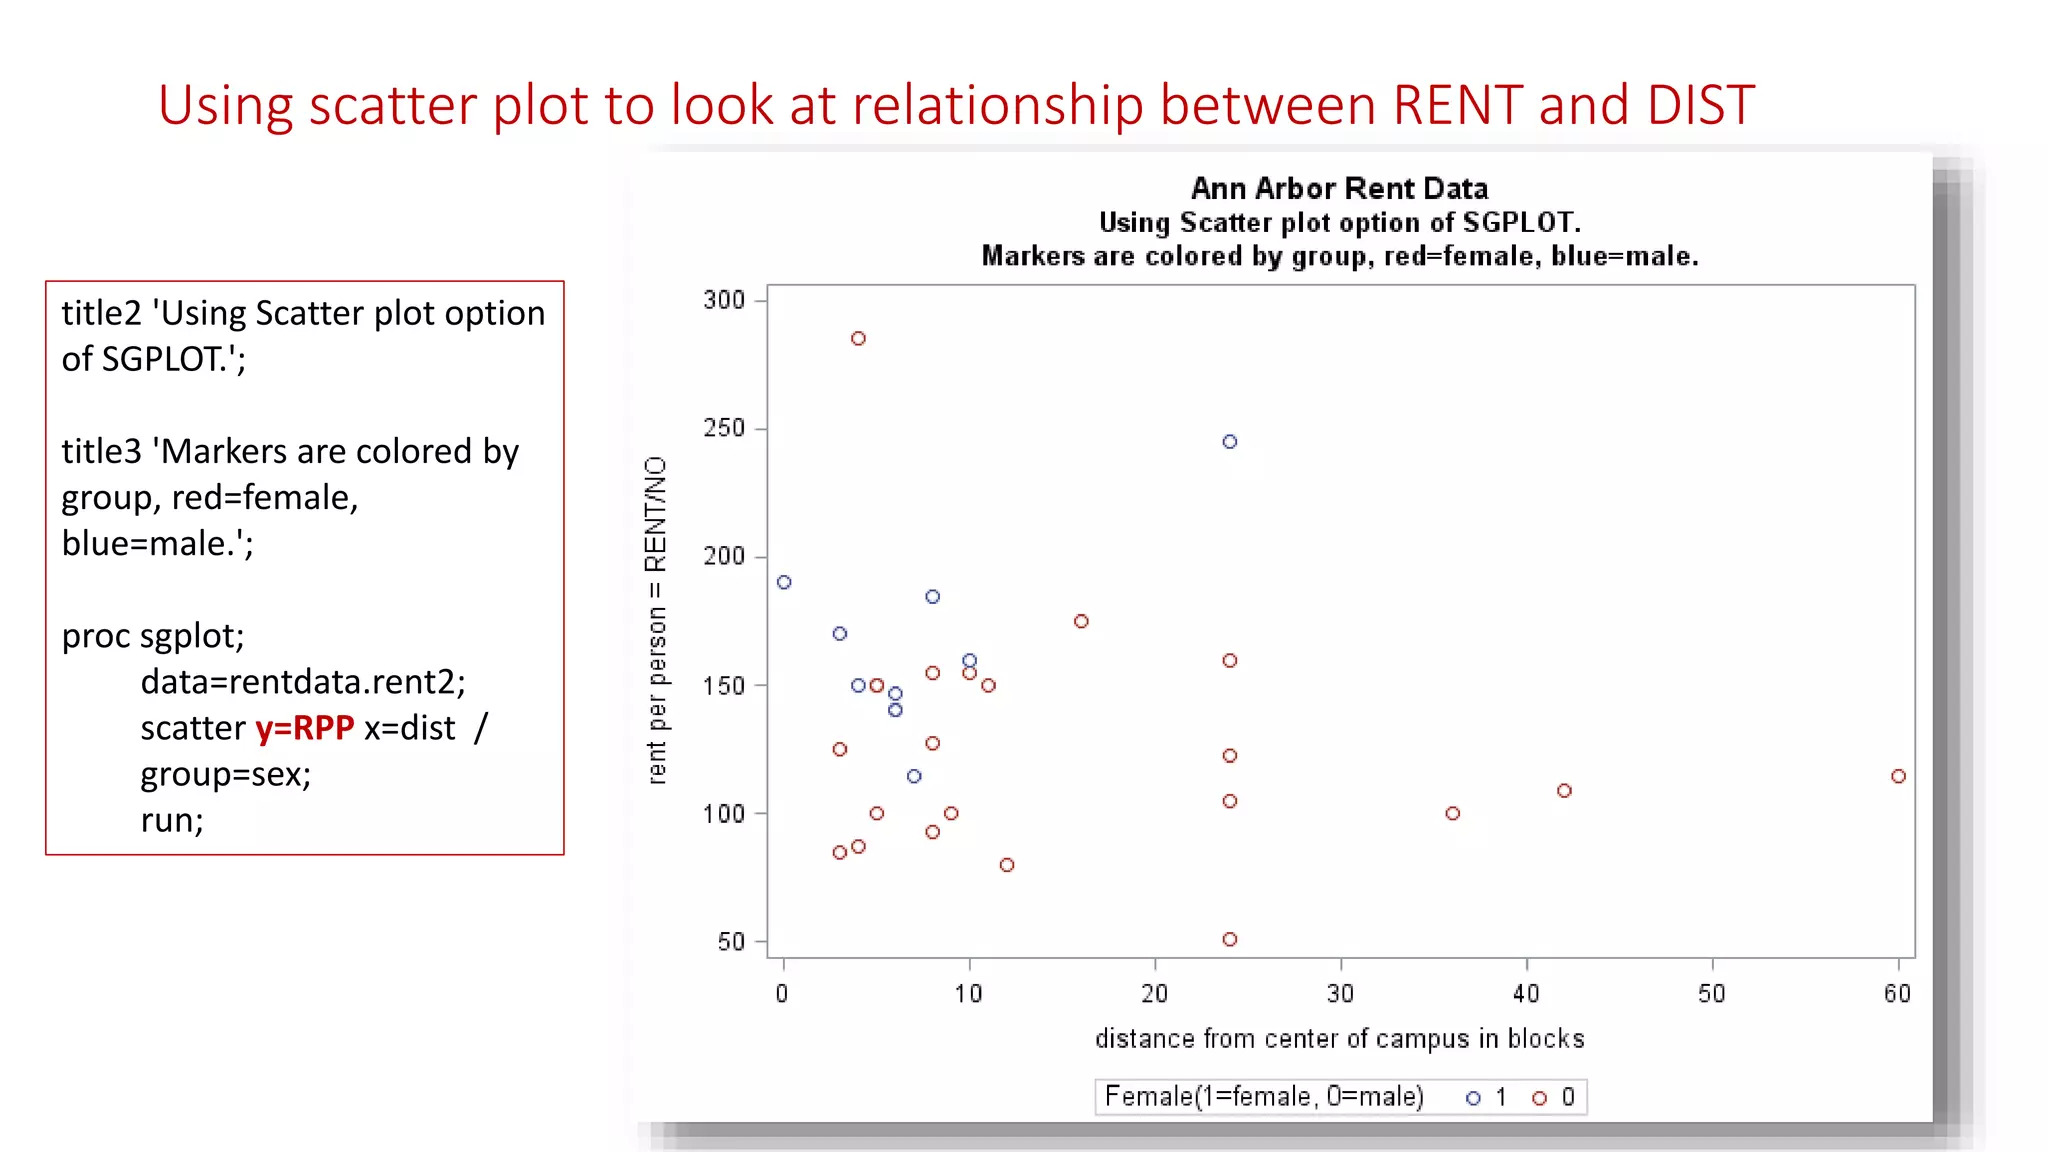
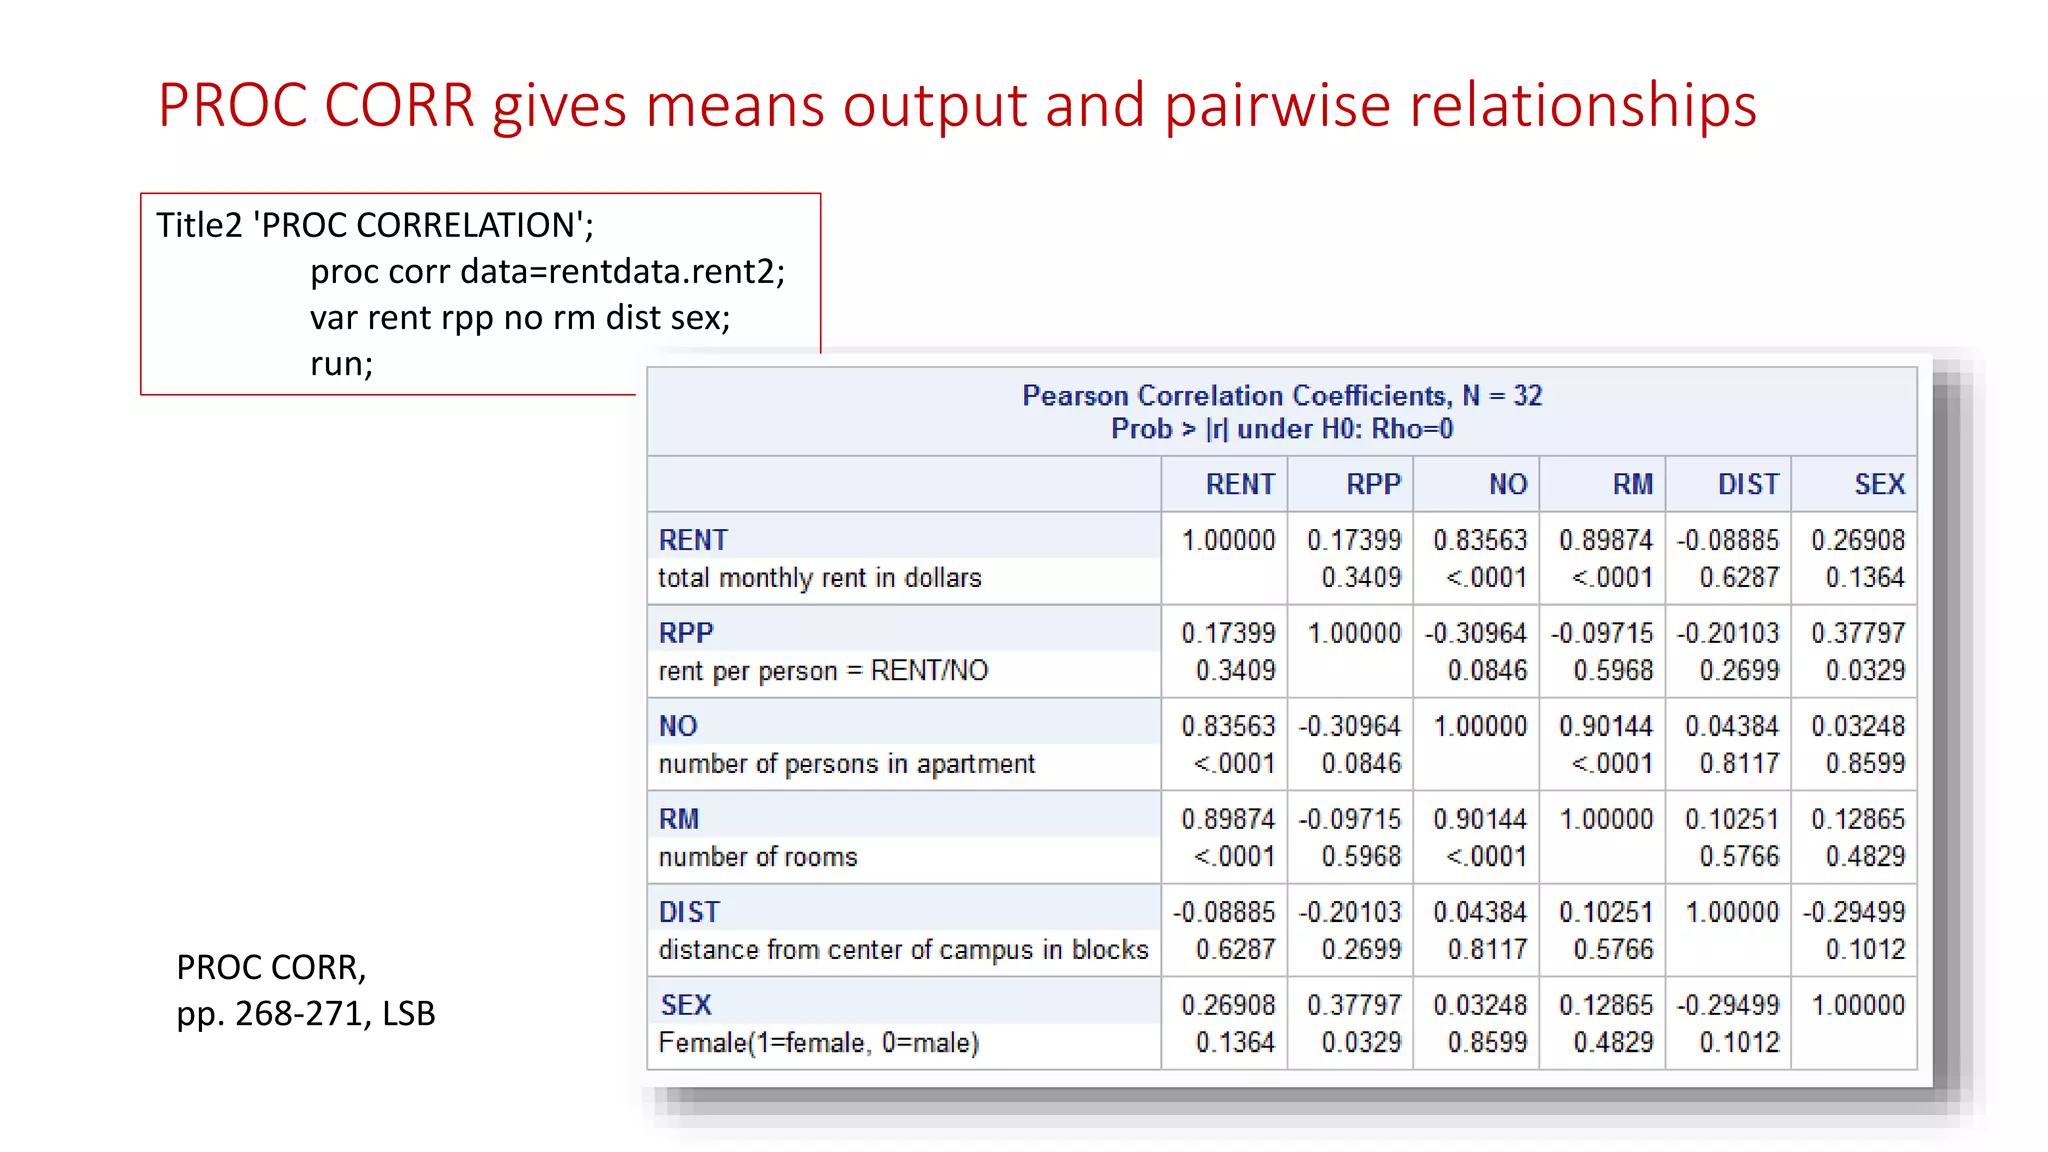
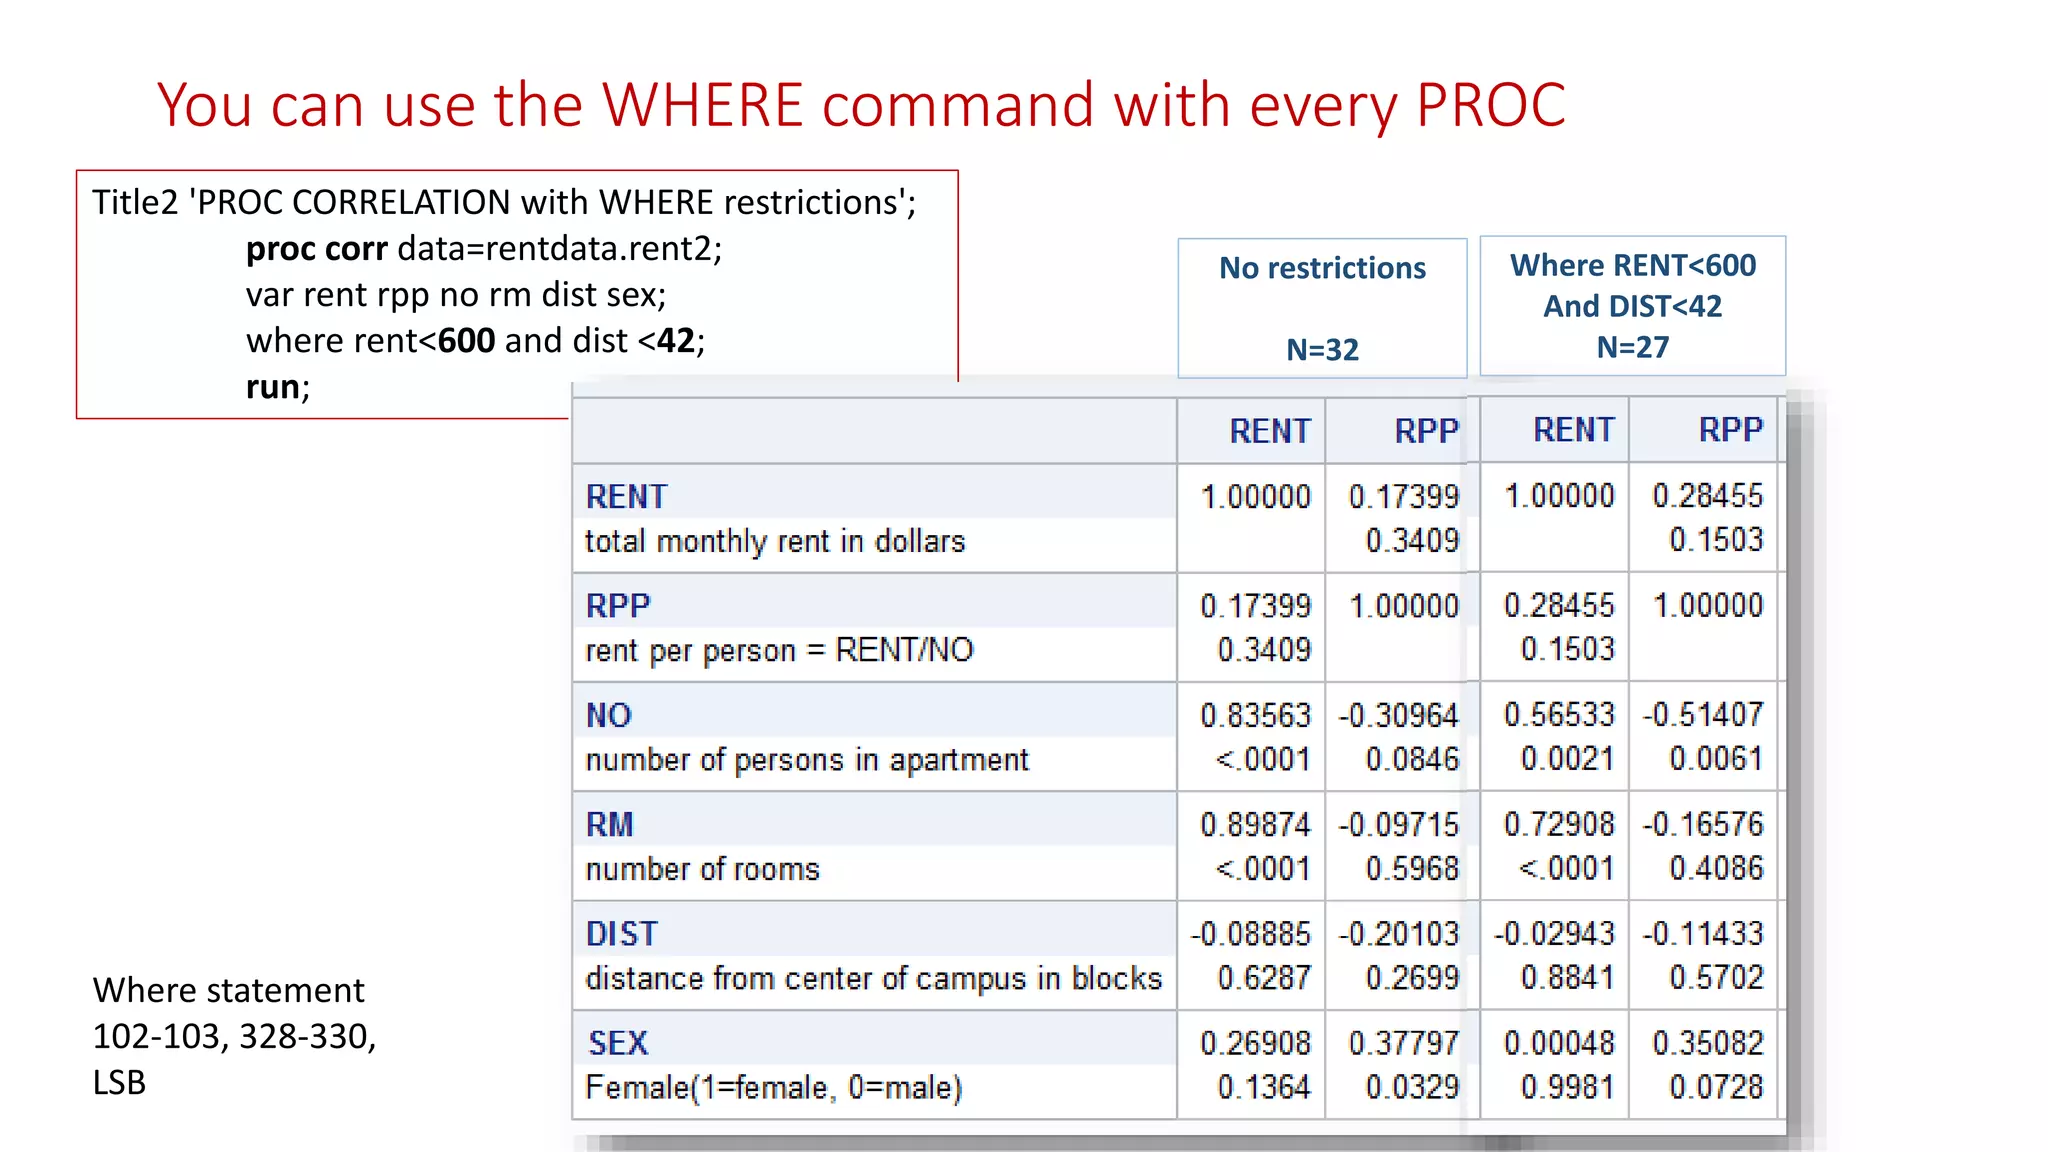
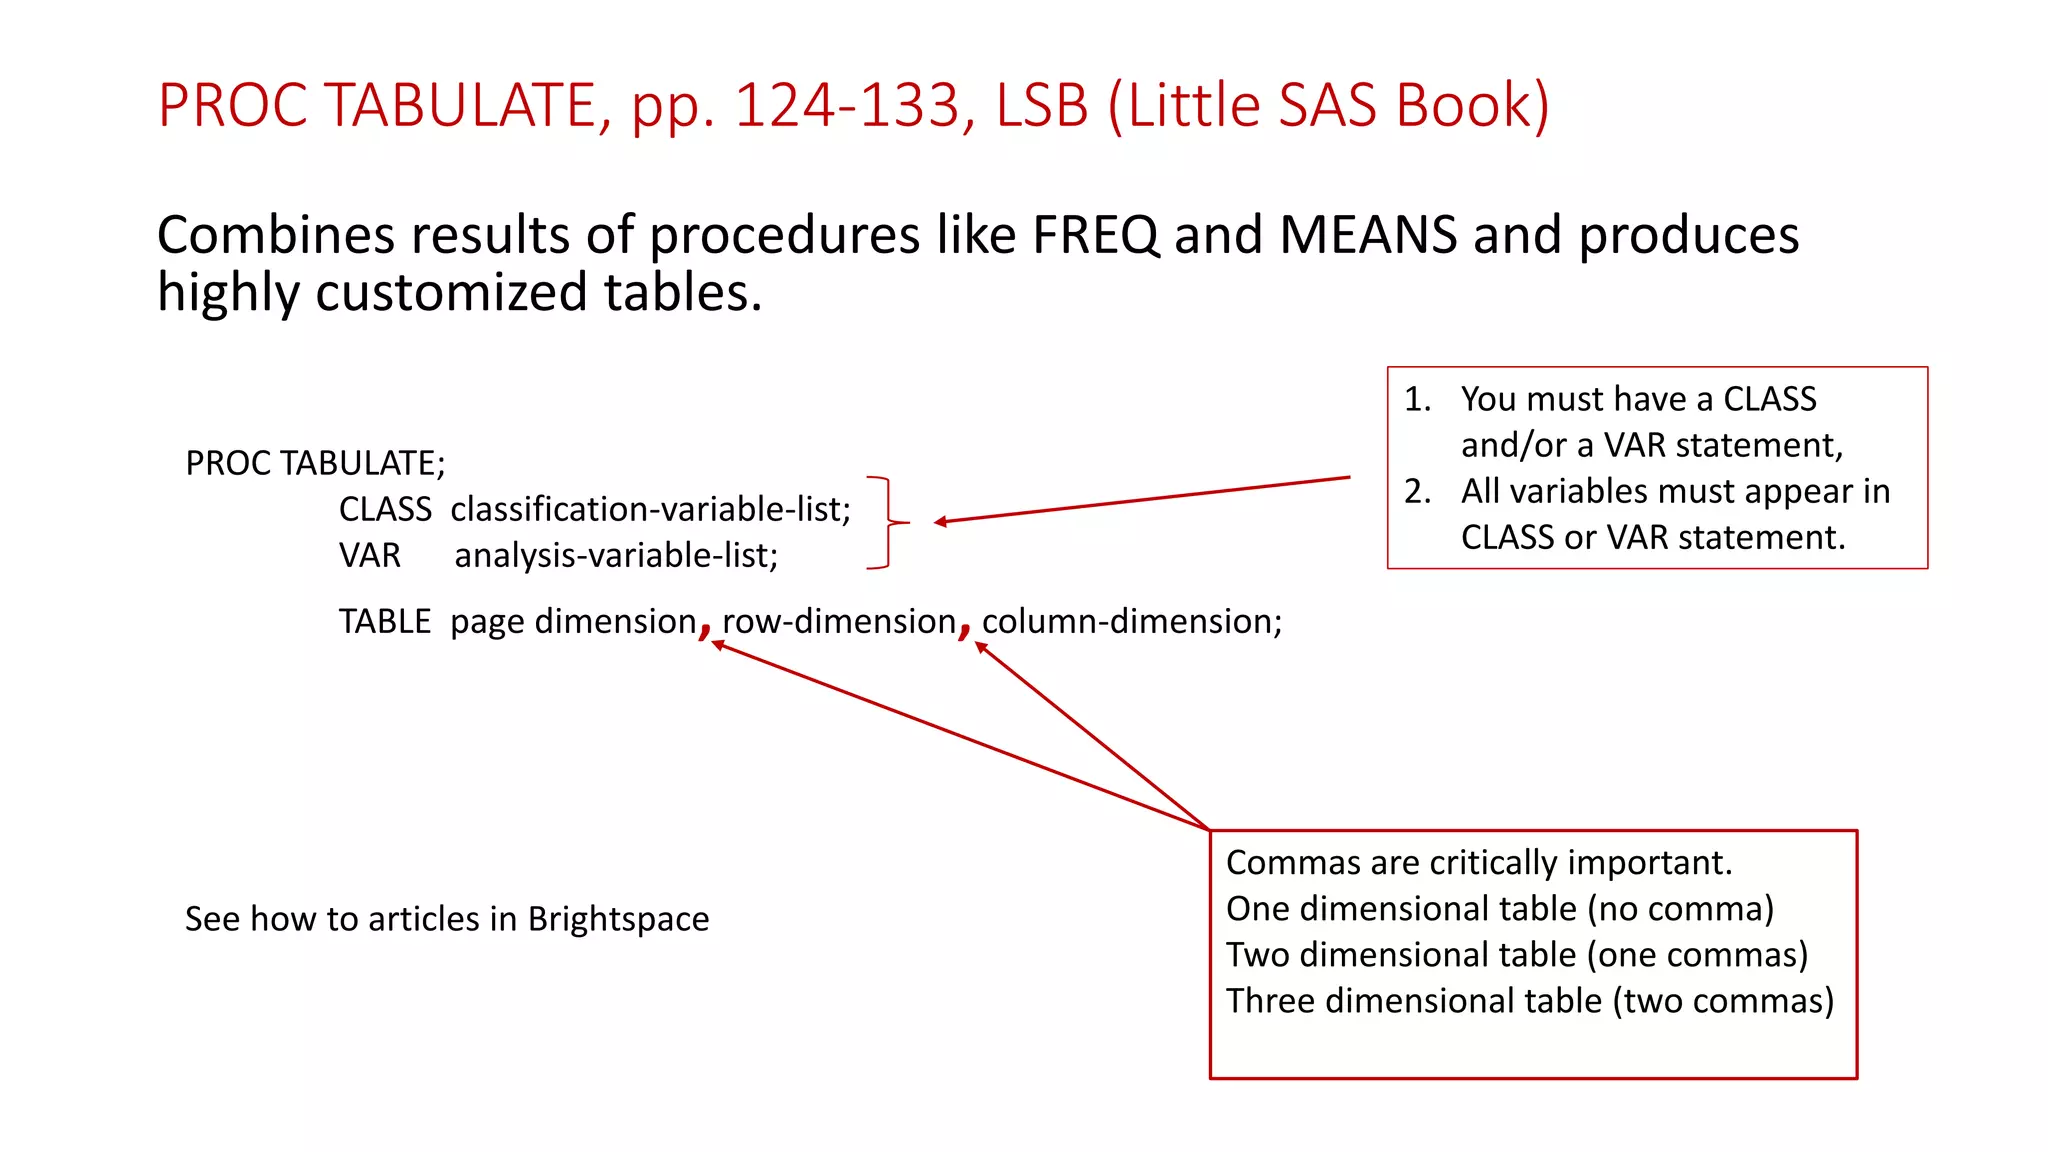
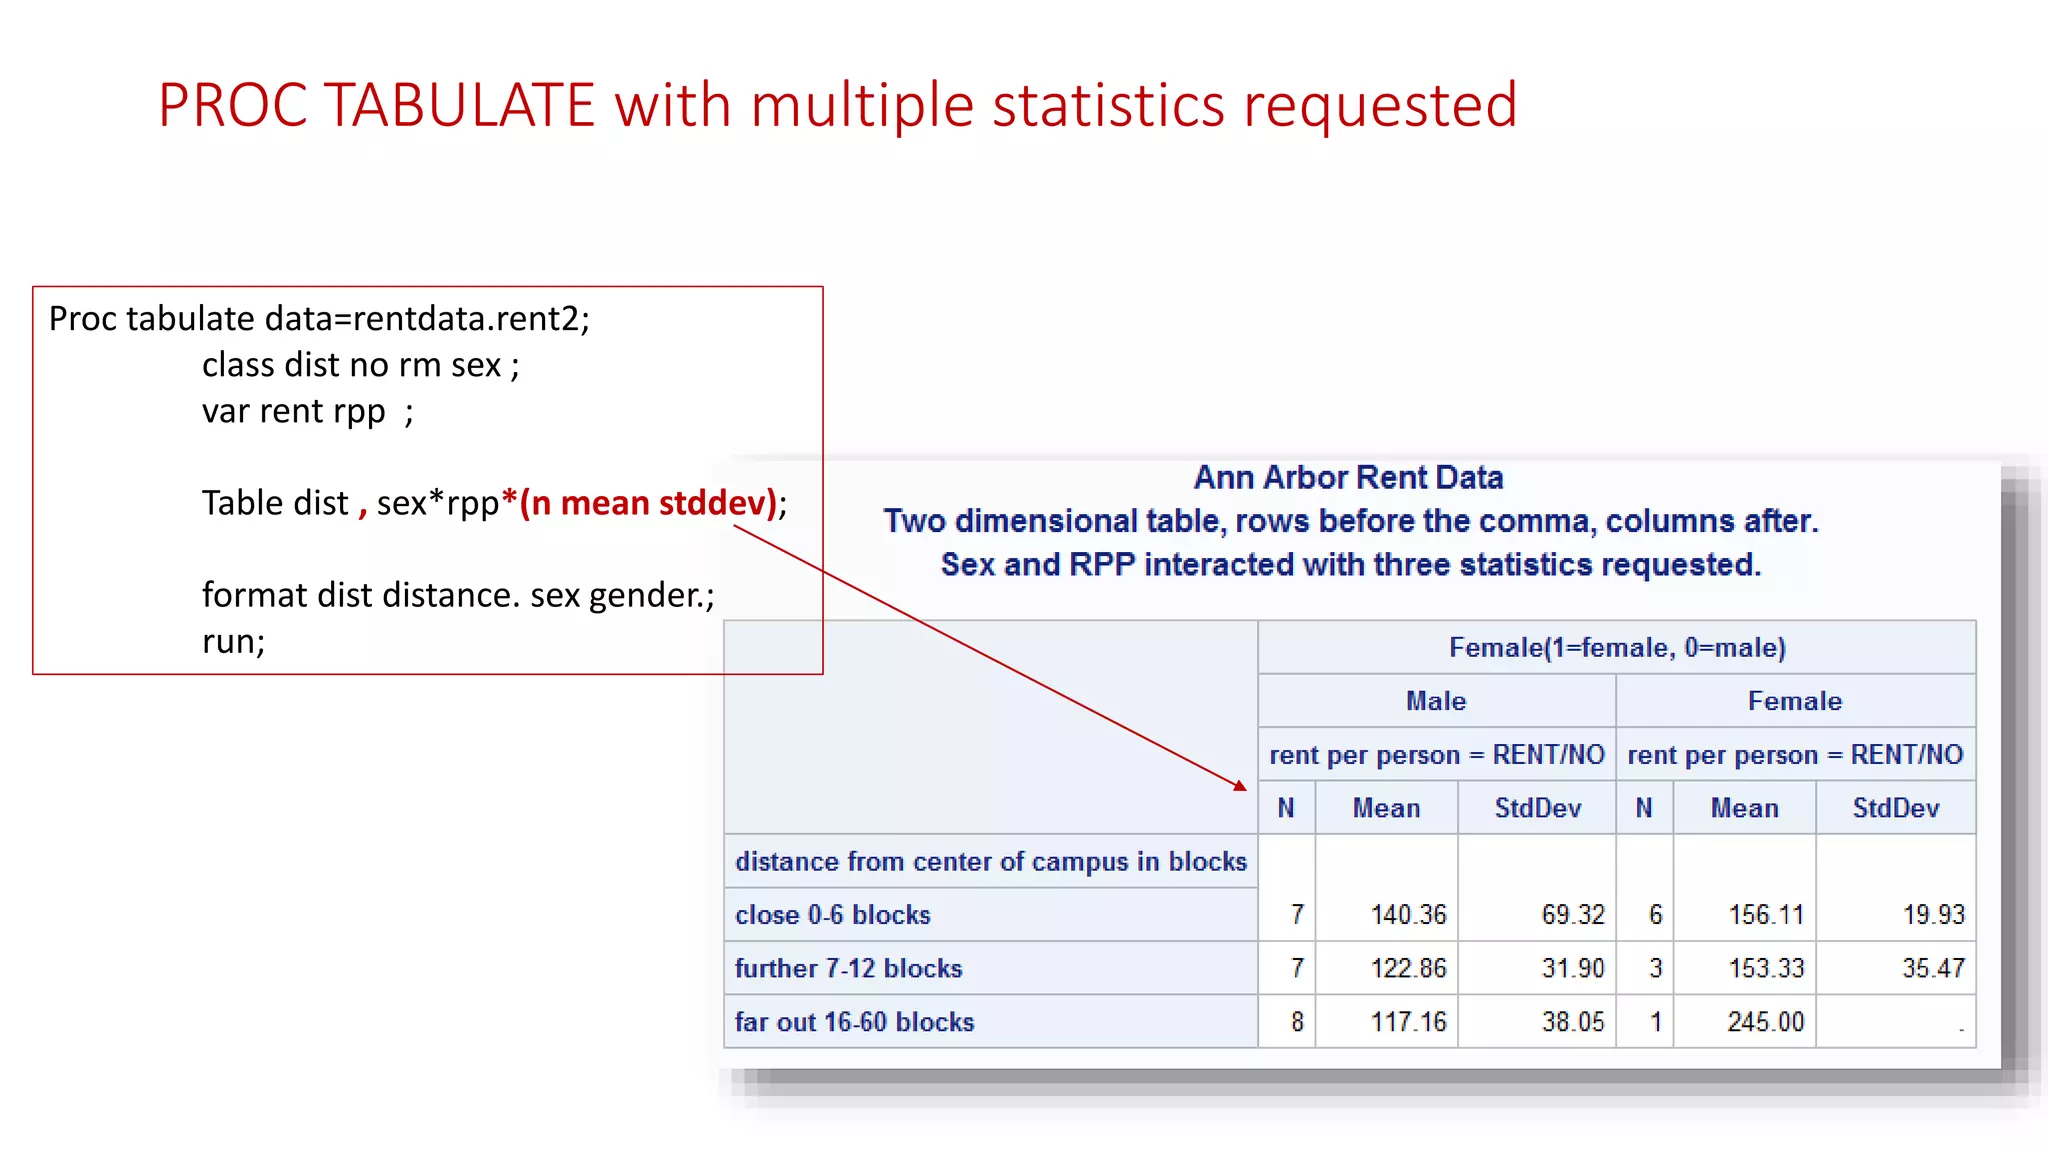
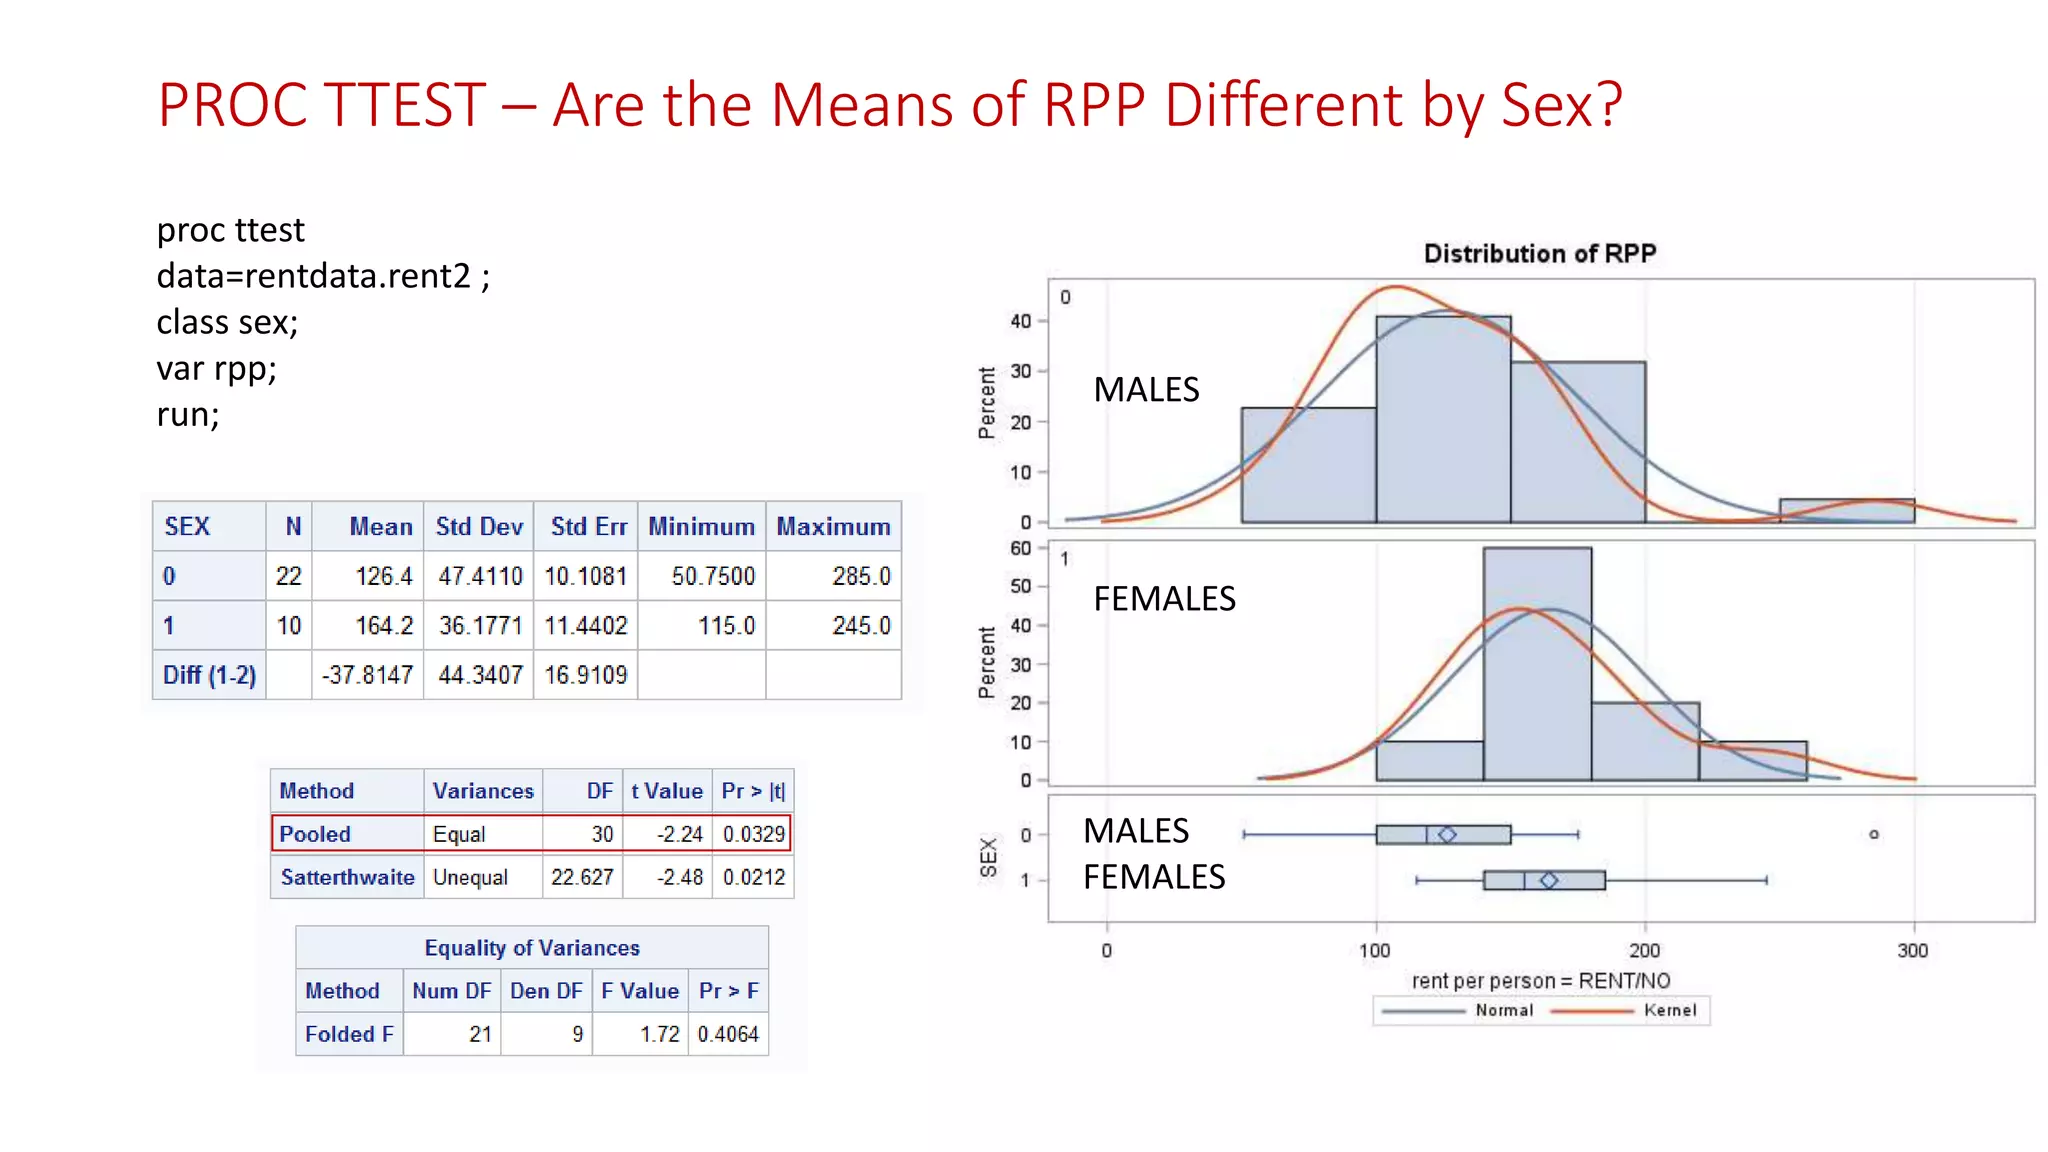
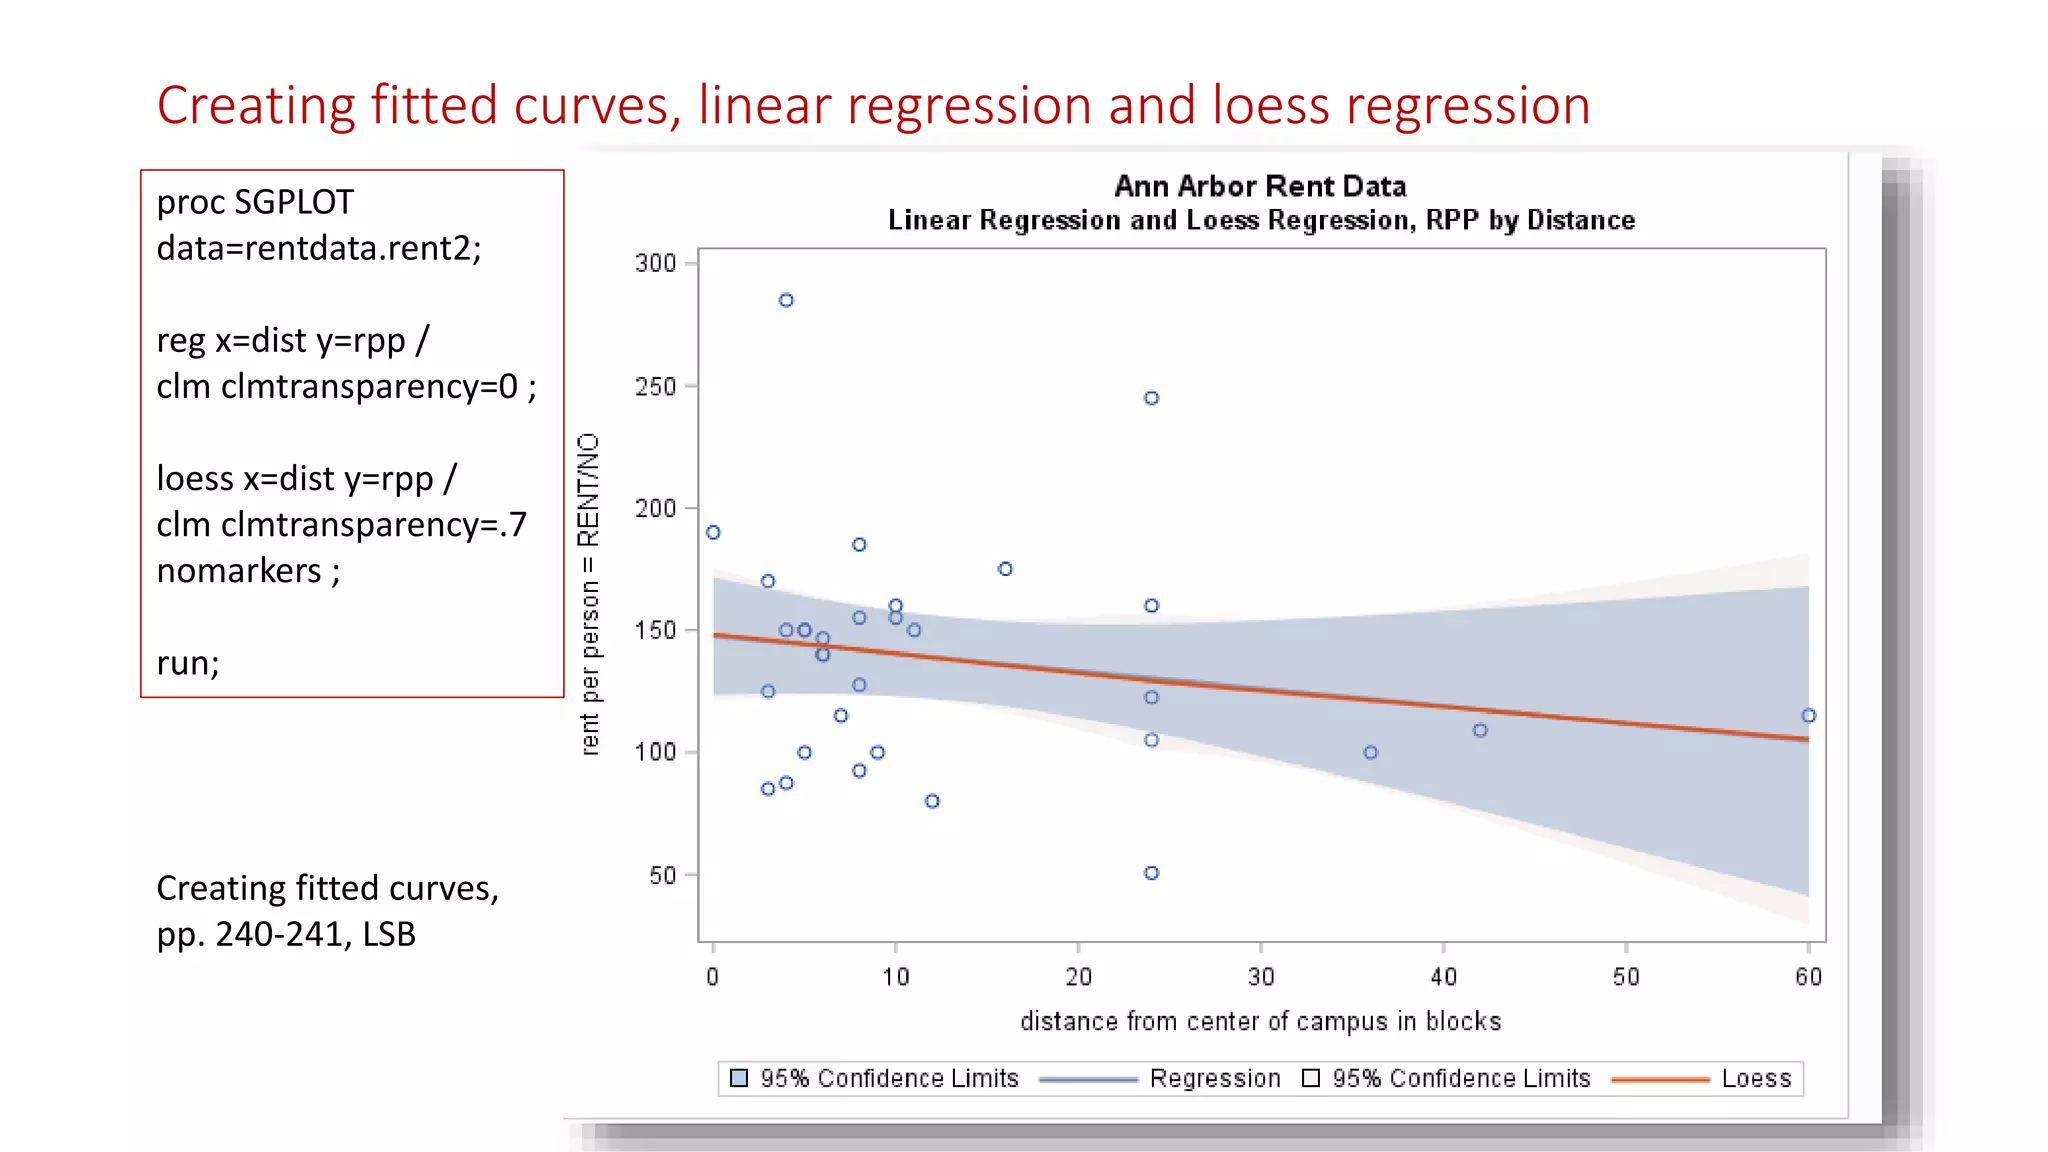
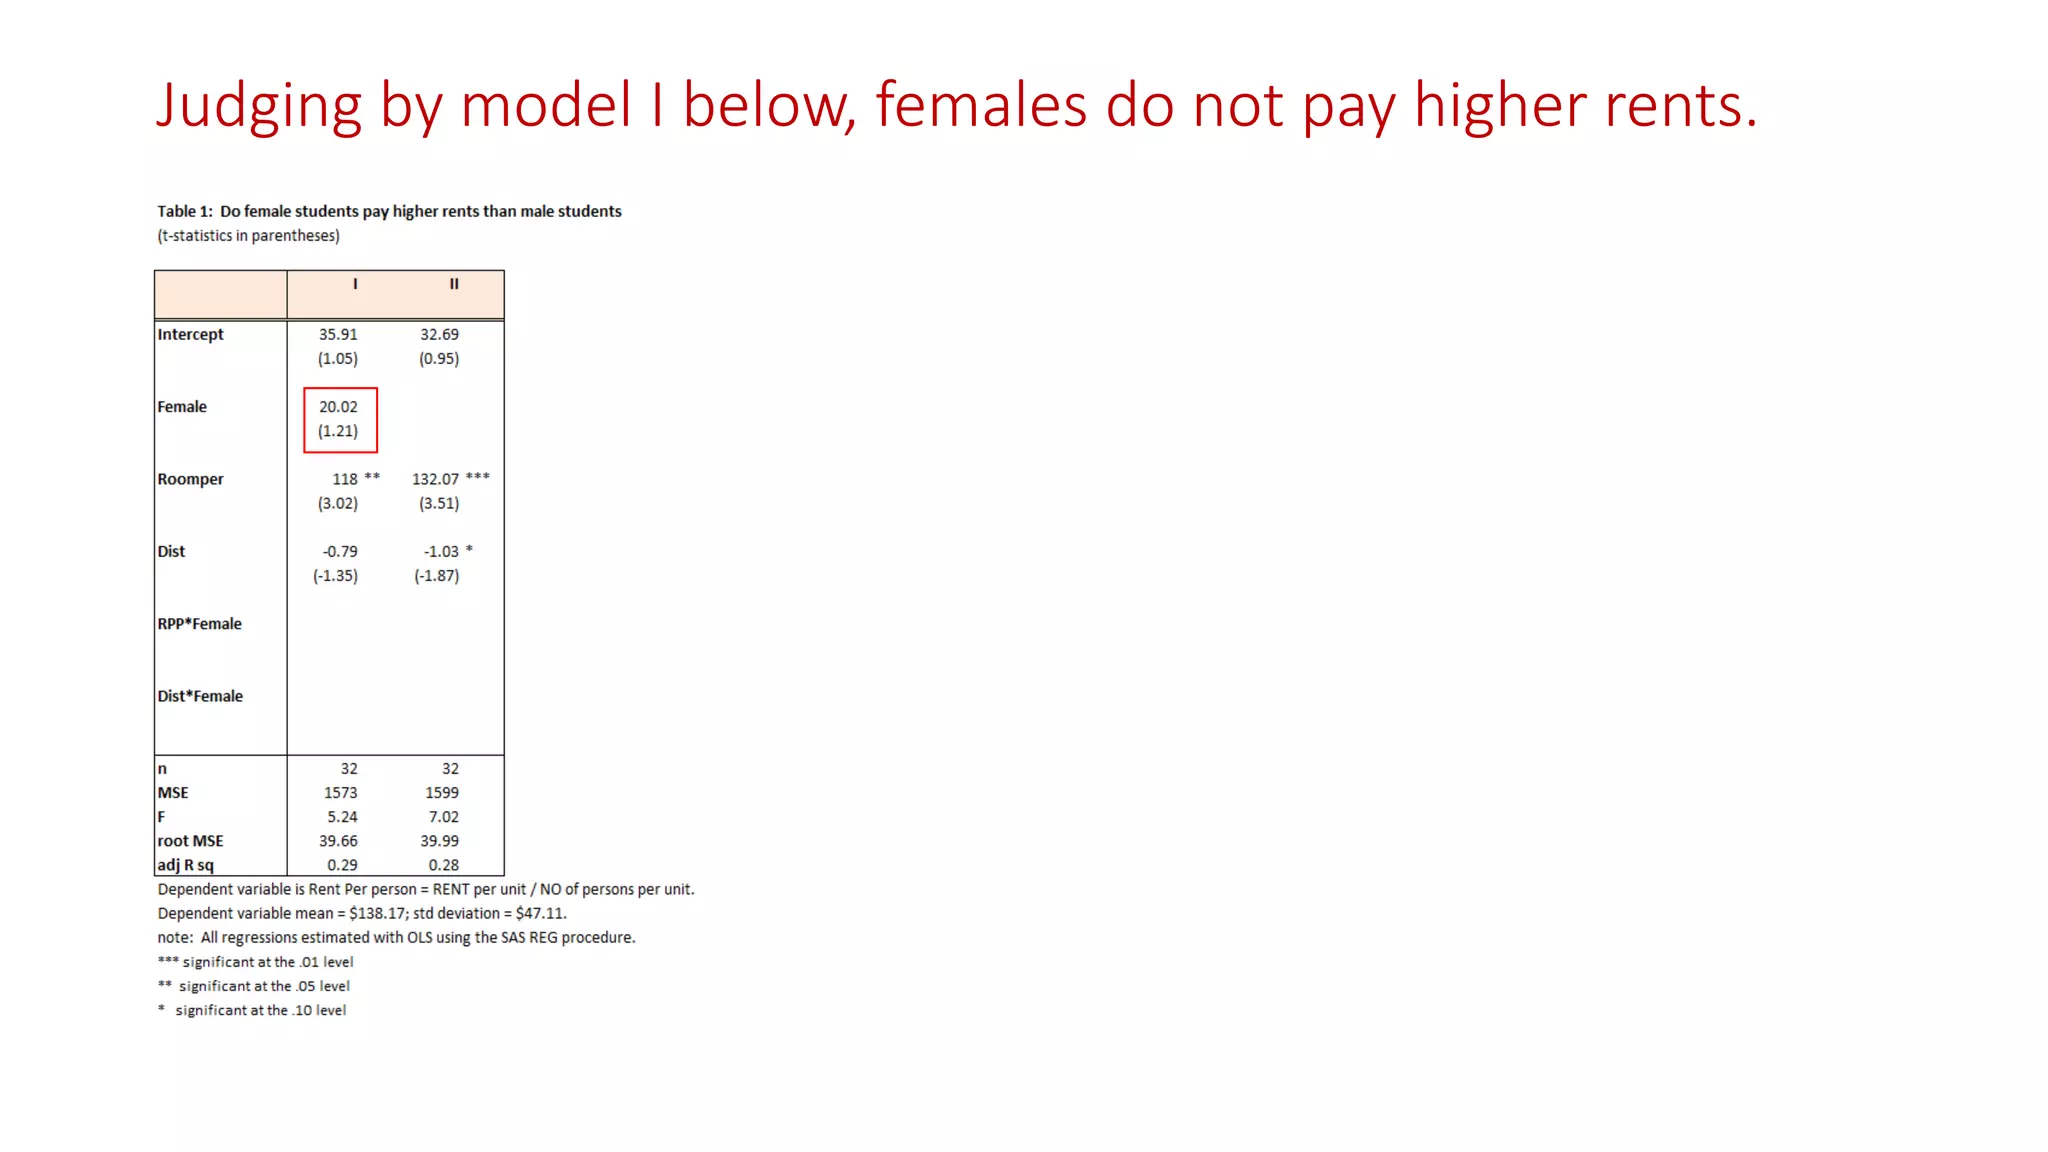
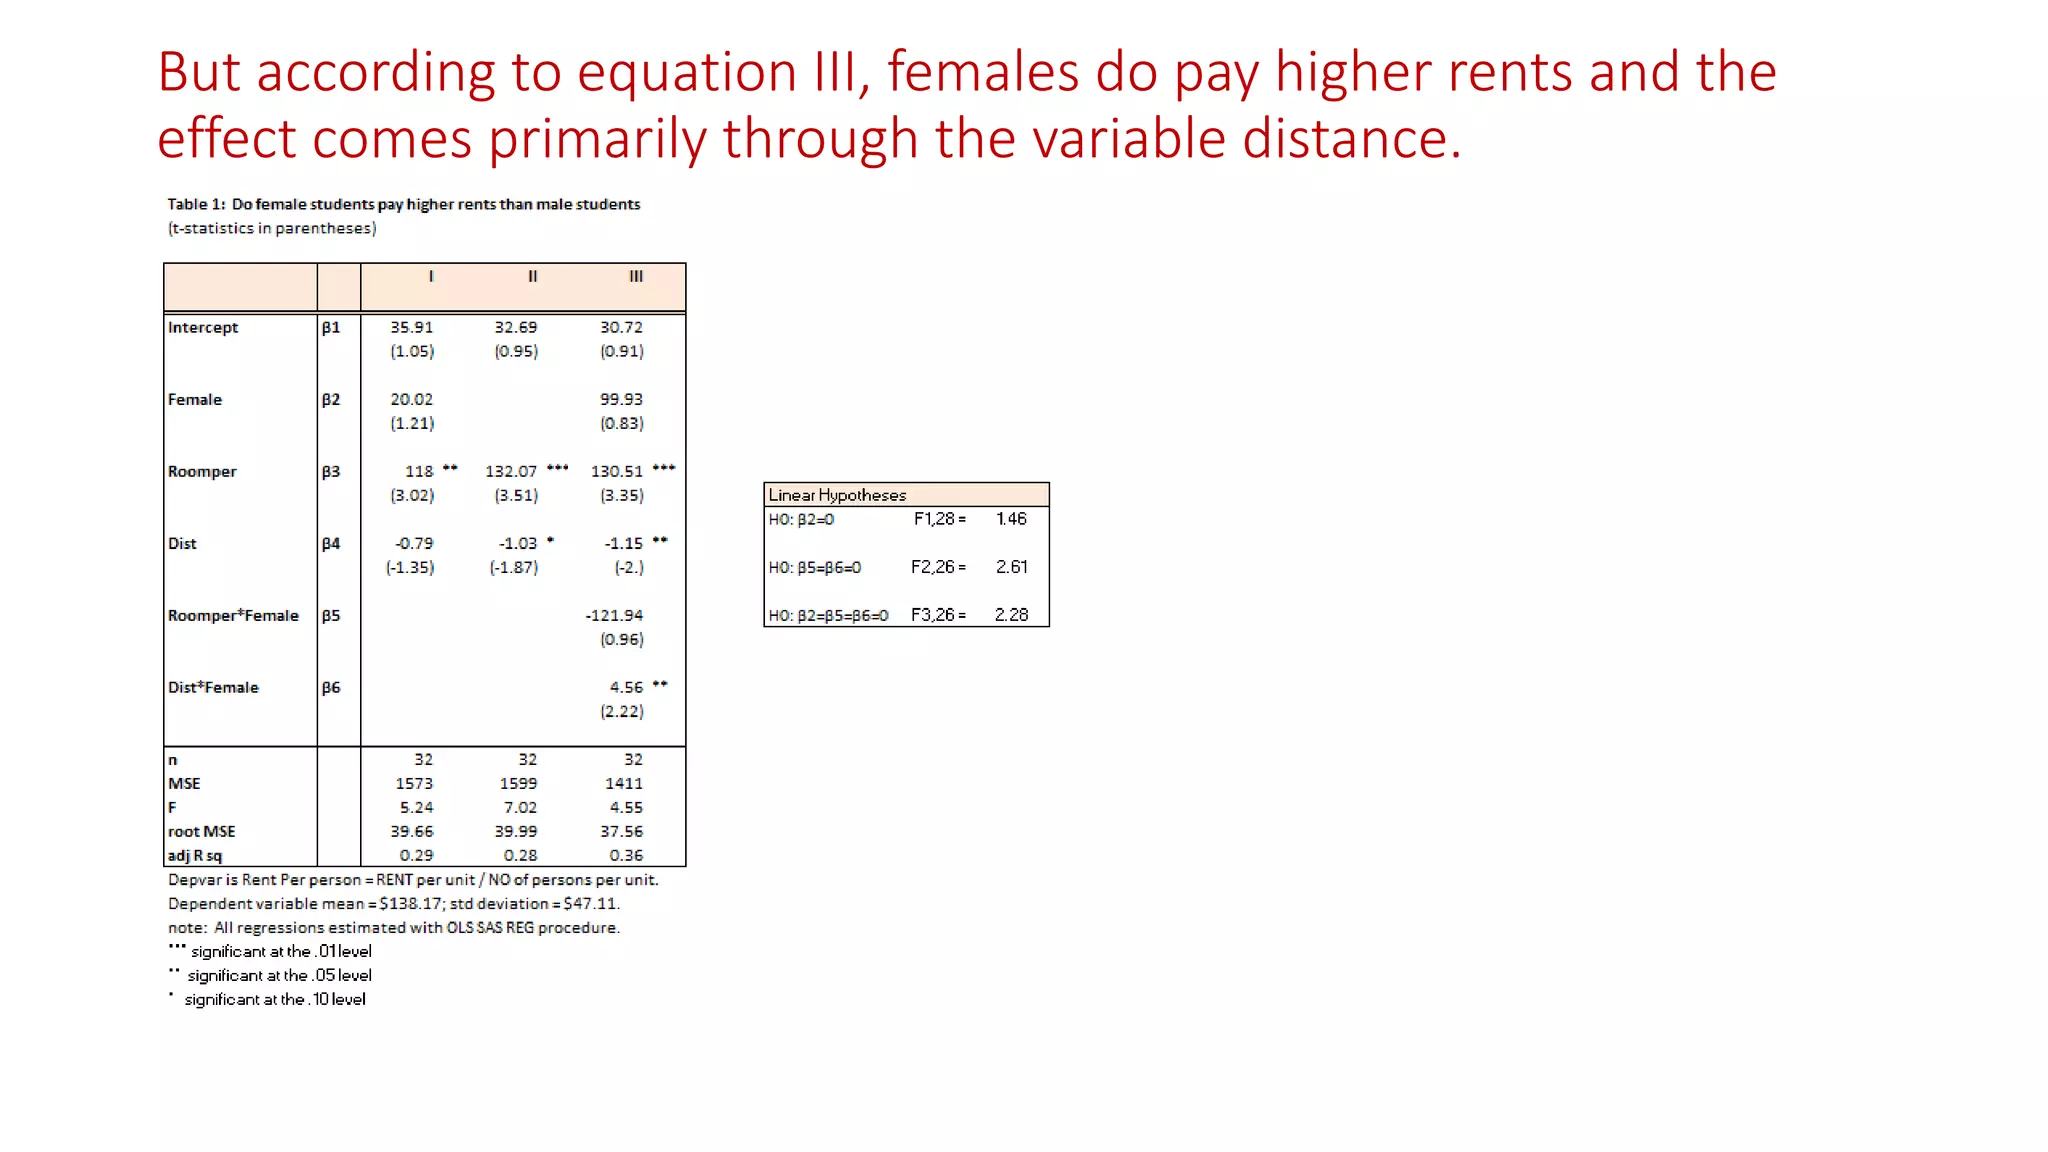
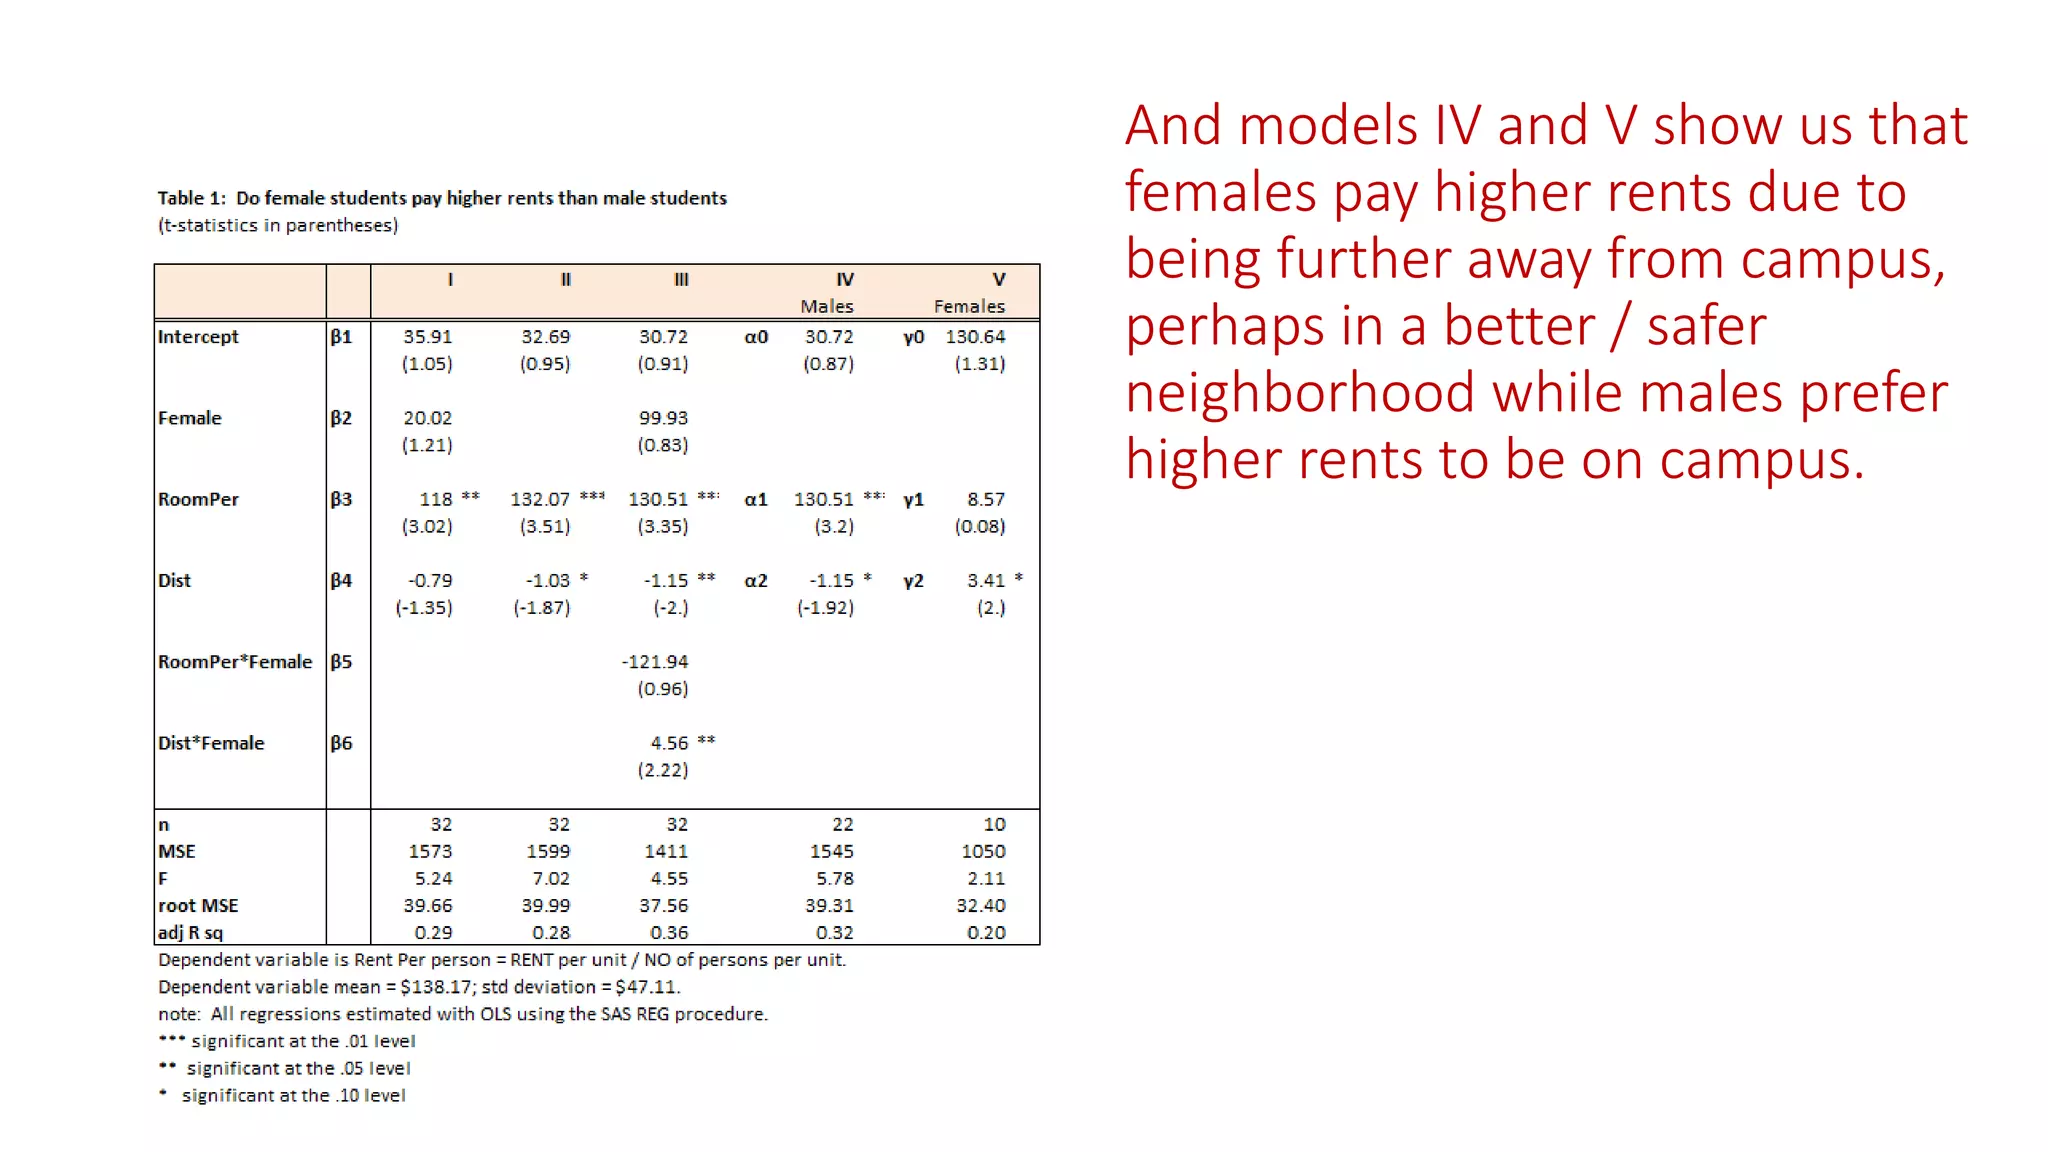
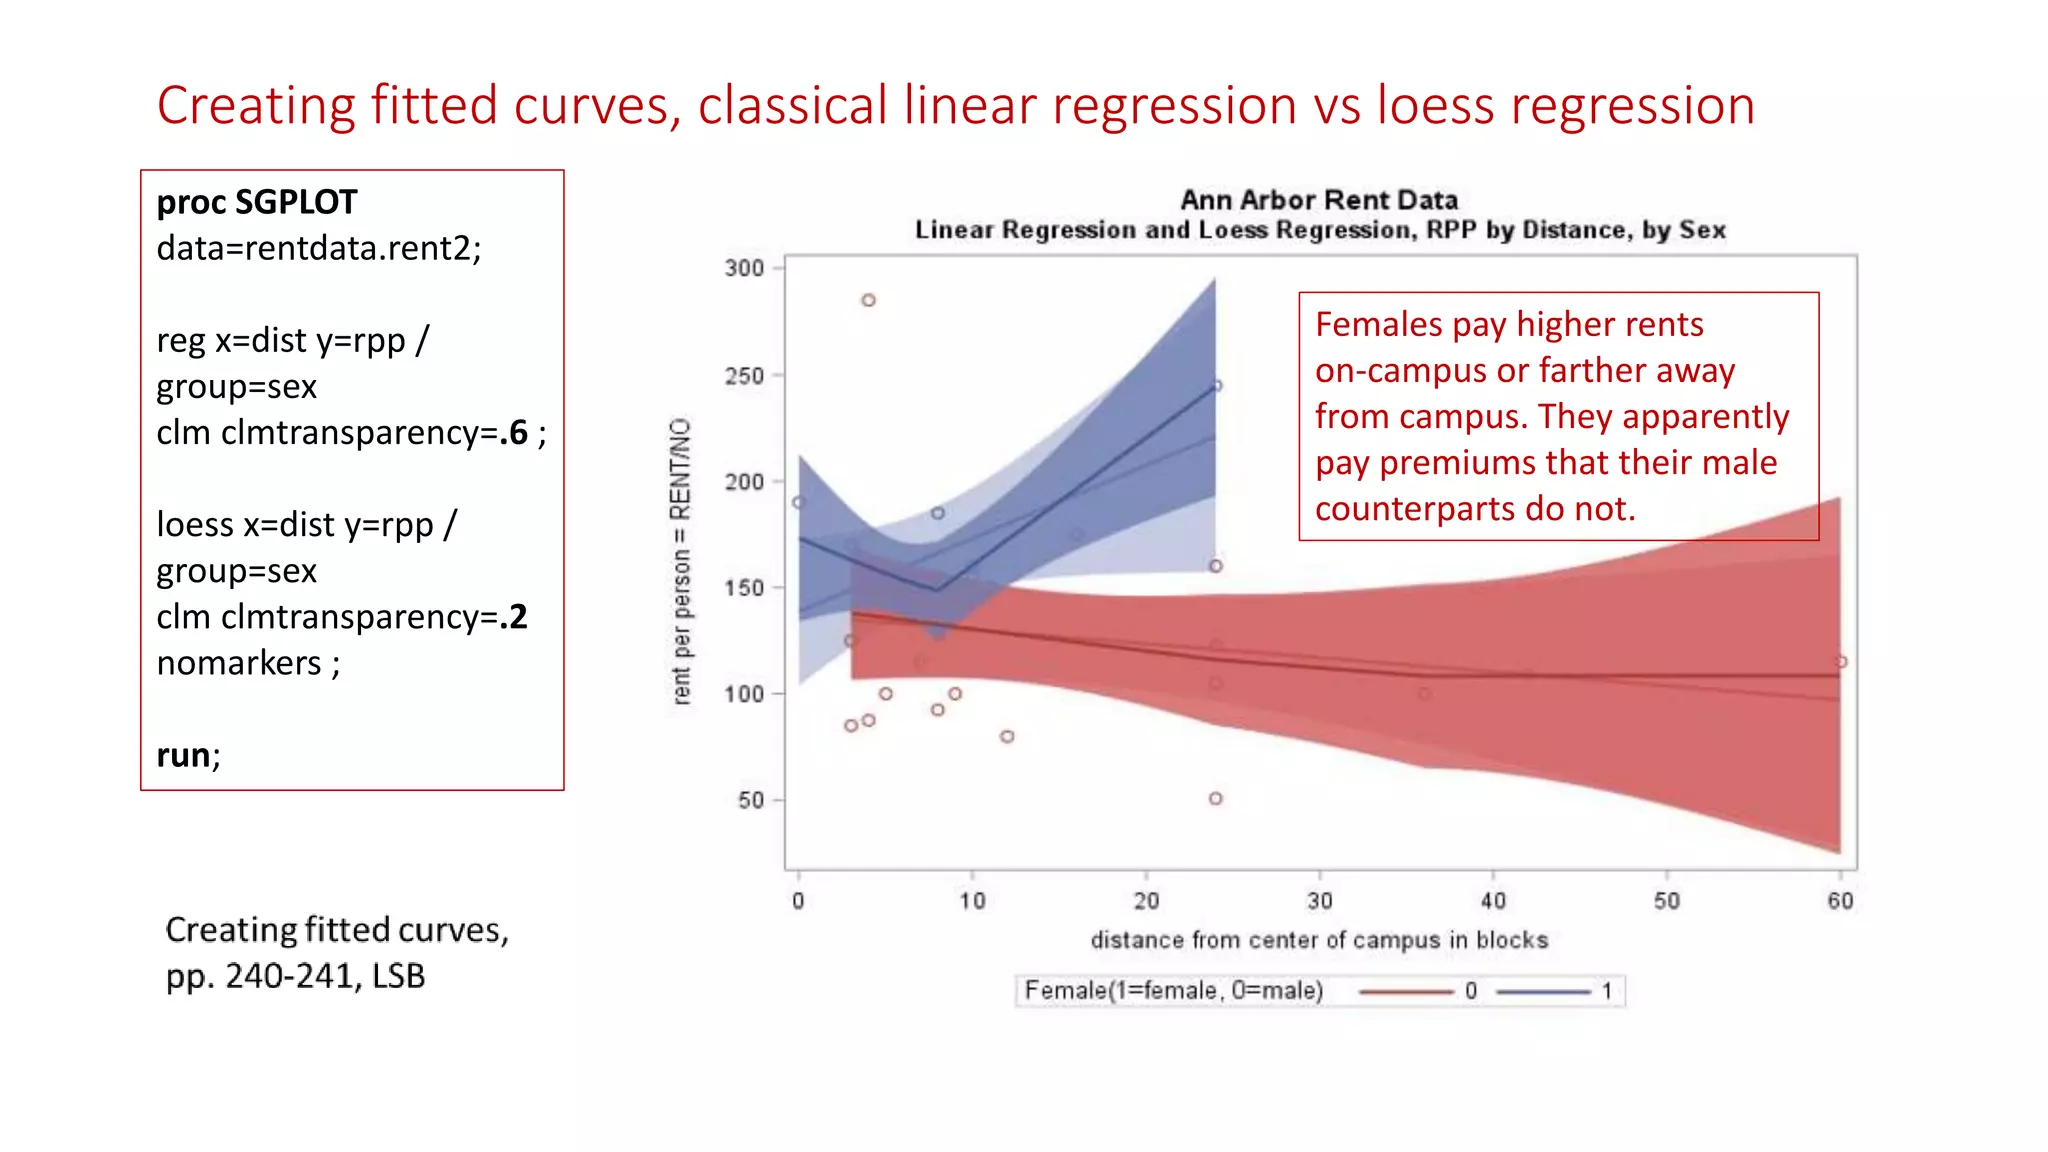
Basic Cross-Section
Exploratory Data Analysis
Procs MEANS, SGPLOT, FREQ, CORR, REG, and TABULATE
Dr. Steven C. Myers
Department of Economics
College of Business Administration
The University of Akron
econdatascience.com
May 2, 2019
Cross sectional (and panel and longitudinal) data
Previously we focused on exploration of Time Series Data and on
reporting our results.
Now we will focus on
Cross Sectional data
Many observations interviewed during one time period
Panel data
Different observations interviewed each year
&
Longitudinal Data
Same observations re-interviewed each year
Why are female students paying higher rents?
Rental data on the campus of Ann Arbor involving gender, rooms,
number of persons and distance from campus. N=32.
https://amzn.to/2q49OwA
Variable Explanation
RENT Monthly apartment rent (dollars)
NO Number of persons living in the
apartment
RM Number of rooms in the apartment
SEX Sex
DIST Distance in blocks from campus
RPP Rent per person (RENT/NO)
Source: Pindyck and Rubinfeld, Econometric Models and Economic Forecasts, 4th edition, McGraw-Hill.
Why are female students paying higher rents?
proc means data=rentdata.rent2 maxdec=2;
class sex;
var rent rpp no rm dist;
run;
Learn how to add labels to your dataset
Page 101, LSB (Little SAS Book)
PROC MEANS, pp. 118-119 LSB
SGPLOT is still helpful
Male Female Male Female
MonthlyRent
RentperPerson,RPP
Title2 'RENT distribution box plots';
proc sgplot data=rentdata.rent2;
vbox RENT / category = sex;
run;
Title2 'RENT distribution box plots';
proc sgplot data=rentdata.rent2;
vbox RPP / category = sex;
run;
Creating Box Plots, pp. 234-235, LSB
Does distance matter?
proc freq data=rentdata.rent2;
tables dist*sex /norow nocol nocum noprecent;
run;
proc means data=rentdata.rent2 maxdec=2;
class sex dist;
var rent rpp no rm ;
run;
NO!
Too much output.
Not easy to read or use.
Hard to read and doesn’t deal with RENT
PROC FREQ,
pp.122-124
LSB
Creating your own formats, PROC FORMAT, pp. 114-115 LSB
proc format ;
value distance 0-6 ='close 0-6 blocks'
7-12 ='further 7-12 blocks'
13-60 ='far out 16-60 blocks' ;
value gender 1 ='Female'
0 ='Male';
run;
proc freq data=rentdata.rent2;
tables dist*sex /norow nocol nocum noprecent;
format dist distance. sex gender.;
run;
Easier to read.
Still doesn’t deal with RENT
PROC MEANS using your defined FORMAT statements
proc means data=rentdata.rent2 maxdec=2;
class dist sex;
var rent rpp;
format dist distance. sex gender.;
run;
Now it is easier to understand.
Using scatter plot to look at relationship between RENT and DIST
title2 'Using Scatter plot option
of SGPLOT.';
title3 'Markers are colored by
group, red=female,
blue=male.';
proc sgplot;
data=rentdata.rent2;
scatter y=RENT x=dist /
group=sex;
run;
PROC SGPLOT, SCATTER
plots, pp. 236-237, LSB
Using scatter plot to look at relationship between RENT and DIST
title2 'Using Scatter plot option
of SGPLOT.';
title3 'Markers are colored by
group, red=female,
blue=male.';
proc sgplot;
data=rentdata.rent2;
scatter y=RPP x=dist /
group=sex;
run;
PROC CORR gives means output and pairwise relationships
Title2 'PROC CORRELATION';
proc corr data=rentdata.rent2;
var rent rpp no rm dist sex;
run;
PROC CORR,
pp. 268-271, LSB
You can use the WHERE command with every PROC
Title2 'PROC CORRELATION with WHERE restrictions';
proc corr data=rentdata.rent2;
var rent rpp no rm dist sex;
where rent<600 and dist <42;
run;
No restrictions
N=32
Where RENT<600
And DIST<42
N=27
Where statement
102-103, 328-330,
LSB
PROC TABULATE, pp. 124-133, LSB (Little SAS Book)
Combines results of procedures like FREQ and MEANS and produces
highly customized tables.
PROC TABULATE;
CLASS classification-variable-list;
VAR analysis-variable-list;
TABLE page dimension,row-dimension, column-dimension;
1. You must have a CLASS
and/or a VAR statement,
2. All variables must appear in
CLASS or VAR statement.
Commas are critically important.
One dimensional table (no comma)
Two dimensional table (one commas)
Three dimensional table (two commas)
See how to articles in Brightspace
Pretty basic PROC TABULATE
Proc tabulate data=rentdata.rent2;
class dist no rm sex ;
var rent rpp ;
Table dist ,sex*rpp*mean;
format dist distance. sex gender.;
run;
PROC TABULATE with multiple statistics requested
Proc tabulate data=rentdata.rent2;
class dist no rm sex ;
var rent rpp ;
Table dist , sex*rpp*(n mean stddev);
format dist distance. sex gender.;
run;
PROC TABULATE with headings cleaned up.
Proc tabulate data=rentdata.rent2;
class dist no rm sex ;
var rent rpp ;
Table
(all=Total dist) ,
(all='Total' sex='')*rpp=''*(n mean stddev);
format dist distance. sex gender.;
run;
PROC TTEST – Are the Means of RPP Different by Sex?
proc ttest
data=rentdata.rent2 ;
class sex;
var rpp;
run;
MALES
FEMALES
MALES
FEMALES
Creating fitted curves, linear regression and loess regression
proc SGPLOT
data=rentdata.rent2;
reg x=dist y=rpp /
clm clmtransparency=0 ;
loess x=dist y=rpp /
clm clmtransparency=.7
nomarkers ;
run;
Creating fitted curves,
pp. 240-241, LSB
Judging by model I below, females do not pay higher rents.
But according to equation III, females do pay higher rents and the
effect comes primarily through the variable distance.
And models IV and V show us that
females pay higher rents due to
being further away from campus,
perhaps in a better / safer
neighborhood while males prefer
higher rents to be on campus.
Creating fitted curves, classical linear regression vs loess regression
proc SGPLOT
data=rentdata.rent2;
reg x=dist y=rpp /
group=sex
clm clmtransparency=.6 ;
loess x=dist y=rpp /
group=sex
clm clmtransparency=.2
nomarkers ;
run;
Females pay higher rents
on-campus or farther away
from campus. They apparently
pay premiums that their male
counterparts do not.

Basic cross section and exploratory data analysis

  • 1.
    Basic Cross-Section Exploratory DataAnalysis Procs MEANS, SGPLOT, FREQ, CORR, REG, and TABULATE Dr. Steven C. Myers Department of Economics College of Business Administration The University of Akron econdatascience.com May 2, 2019
  • 2.
    Cross sectional (andpanel and longitudinal) data Previously we focused on exploration of Time Series Data and on reporting our results. Now we will focus on Cross Sectional data Many observations interviewed during one time period Panel data Different observations interviewed each year & Longitudinal Data Same observations re-interviewed each year
  • 3.
    Why are femalestudents paying higher rents? Rental data on the campus of Ann Arbor involving gender, rooms, number of persons and distance from campus. N=32. https://amzn.to/2q49OwA Variable Explanation RENT Monthly apartment rent (dollars) NO Number of persons living in the apartment RM Number of rooms in the apartment SEX Sex DIST Distance in blocks from campus RPP Rent per person (RENT/NO) Source: Pindyck and Rubinfeld, Econometric Models and Economic Forecasts, 4th edition, McGraw-Hill.
  • 4.
    Why are femalestudents paying higher rents? proc means data=rentdata.rent2 maxdec=2; class sex; var rent rpp no rm dist; run; Learn how to add labels to your dataset Page 101, LSB (Little SAS Book) PROC MEANS, pp. 118-119 LSB
  • 5.
    SGPLOT is stillhelpful Male Female Male Female MonthlyRent RentperPerson,RPP Title2 'RENT distribution box plots'; proc sgplot data=rentdata.rent2; vbox RENT / category = sex; run; Title2 'RENT distribution box plots'; proc sgplot data=rentdata.rent2; vbox RPP / category = sex; run; Creating Box Plots, pp. 234-235, LSB
  • 6.
    Does distance matter? procfreq data=rentdata.rent2; tables dist*sex /norow nocol nocum noprecent; run; proc means data=rentdata.rent2 maxdec=2; class sex dist; var rent rpp no rm ; run; NO! Too much output. Not easy to read or use. Hard to read and doesn’t deal with RENT PROC FREQ, pp.122-124 LSB
  • 7.
    Creating your ownformats, PROC FORMAT, pp. 114-115 LSB proc format ; value distance 0-6 ='close 0-6 blocks' 7-12 ='further 7-12 blocks' 13-60 ='far out 16-60 blocks' ; value gender 1 ='Female' 0 ='Male'; run; proc freq data=rentdata.rent2; tables dist*sex /norow nocol nocum noprecent; format dist distance. sex gender.; run; Easier to read. Still doesn’t deal with RENT
  • 8.
    PROC MEANS usingyour defined FORMAT statements proc means data=rentdata.rent2 maxdec=2; class dist sex; var rent rpp; format dist distance. sex gender.; run; Now it is easier to understand.
  • 9.
    Using scatter plotto look at relationship between RENT and DIST title2 'Using Scatter plot option of SGPLOT.'; title3 'Markers are colored by group, red=female, blue=male.'; proc sgplot; data=rentdata.rent2; scatter y=RENT x=dist / group=sex; run; PROC SGPLOT, SCATTER plots, pp. 236-237, LSB
  • 10.
    Using scatter plotto look at relationship between RENT and DIST title2 'Using Scatter plot option of SGPLOT.'; title3 'Markers are colored by group, red=female, blue=male.'; proc sgplot; data=rentdata.rent2; scatter y=RPP x=dist / group=sex; run;
  • 11.
    PROC CORR givesmeans output and pairwise relationships Title2 'PROC CORRELATION'; proc corr data=rentdata.rent2; var rent rpp no rm dist sex; run; PROC CORR, pp. 268-271, LSB
  • 12.
    You can usethe WHERE command with every PROC Title2 'PROC CORRELATION with WHERE restrictions'; proc corr data=rentdata.rent2; var rent rpp no rm dist sex; where rent<600 and dist <42; run; No restrictions N=32 Where RENT<600 And DIST<42 N=27 Where statement 102-103, 328-330, LSB
  • 13.
    PROC TABULATE, pp.124-133, LSB (Little SAS Book) Combines results of procedures like FREQ and MEANS and produces highly customized tables. PROC TABULATE; CLASS classification-variable-list; VAR analysis-variable-list; TABLE page dimension,row-dimension, column-dimension; 1. You must have a CLASS and/or a VAR statement, 2. All variables must appear in CLASS or VAR statement. Commas are critically important. One dimensional table (no comma) Two dimensional table (one commas) Three dimensional table (two commas) See how to articles in Brightspace
  • 14.
    Pretty basic PROCTABULATE Proc tabulate data=rentdata.rent2; class dist no rm sex ; var rent rpp ; Table dist ,sex*rpp*mean; format dist distance. sex gender.; run;
  • 15.
    PROC TABULATE withmultiple statistics requested Proc tabulate data=rentdata.rent2; class dist no rm sex ; var rent rpp ; Table dist , sex*rpp*(n mean stddev); format dist distance. sex gender.; run;
  • 16.
    PROC TABULATE withheadings cleaned up. Proc tabulate data=rentdata.rent2; class dist no rm sex ; var rent rpp ; Table (all=Total dist) , (all='Total' sex='')*rpp=''*(n mean stddev); format dist distance. sex gender.; run;
  • 17.
    PROC TTEST –Are the Means of RPP Different by Sex? proc ttest data=rentdata.rent2 ; class sex; var rpp; run; MALES FEMALES MALES FEMALES
  • 18.
    Creating fitted curves,linear regression and loess regression proc SGPLOT data=rentdata.rent2; reg x=dist y=rpp / clm clmtransparency=0 ; loess x=dist y=rpp / clm clmtransparency=.7 nomarkers ; run; Creating fitted curves, pp. 240-241, LSB
  • 19.
    Judging by modelI below, females do not pay higher rents.
  • 20.
    But according toequation III, females do pay higher rents and the effect comes primarily through the variable distance.
  • 21.
    And models IVand V show us that females pay higher rents due to being further away from campus, perhaps in a better / safer neighborhood while males prefer higher rents to be on campus.
  • 22.
    Creating fitted curves,classical linear regression vs loess regression proc SGPLOT data=rentdata.rent2; reg x=dist y=rpp / group=sex clm clmtransparency=.6 ; loess x=dist y=rpp / group=sex clm clmtransparency=.2 nomarkers ; run; Females pay higher rents on-campus or farther away from campus. They apparently pay premiums that their male counterparts do not.