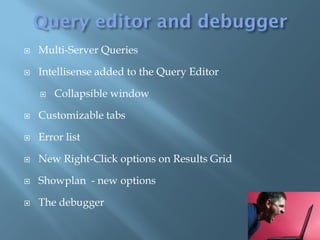
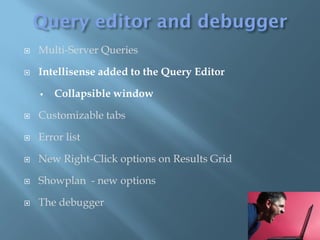
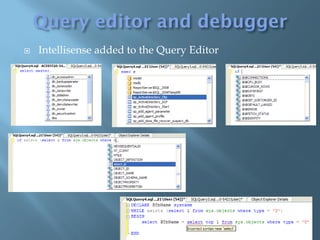
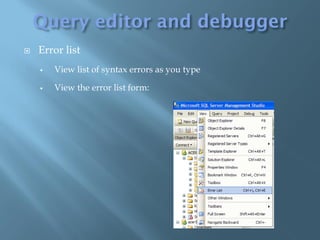
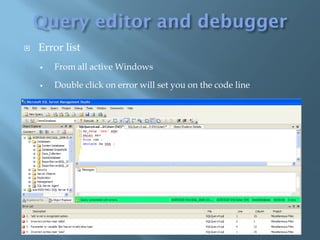
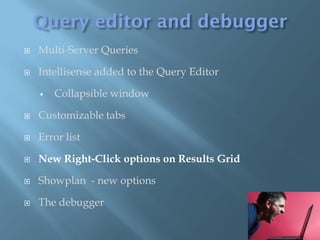
- Intellisense provides auto-completion of SQL elements like table and column names as you type queries.
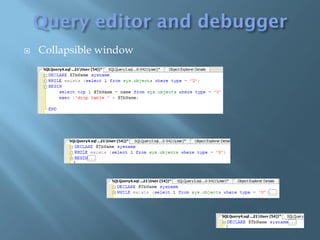
- The Intellisense window is now collapsible so it doesn't take up extra screen space when not needed.
- Intellisense supports multiple servers, databases and schemas so it works across multiple objects.
- It understands SQL syntax better and provides more accurate suggestions compared to prior versions of SSMS.
- Overall Intellisense improves the querying experience by reducing typing and syntax errors through auto-completion of valid SQL elements.


![ Querying DMVs
Process information SELECT fn.text,p.* from sysprocesses as p
CROSS APPLY fn_get_sql(sql_handle) as fn
ORDER BY spid
Top wait statistics SELECT TOP 10
[Wait type] = wait_type, [Wait time (s)] = wait_time_ms / 1000,
[% waiting] = CONVERT(DECIMAL(12,2),
wait_time_ms * 100.0 / SUM(wait_time_ms) OVER())
FROM sys.dm_os_wait_stats
WHERE wait_type NOT LIKE '%SLEEP%'
ORDER BY wait_time_ms DESC
Top files under load SELECT db_name(mf.database_id),physical_name,num_of_reads
Top files under load FROM sys.master_files mf
Inner join sys.dm_io_virtual_file_stats(NULL,NULL) as vf
on mf.database_id = vf.database_id and mf.file_id=vf.file_id
order by num_of_reads desc
Top query by Avg: SELECT TOP 10
[Average CPU used] = total_worker_time / qs.execution_count,
[Total CPU used] = total_worker_time ,
Top by CPU [Execution count] = qs.execution_count ,
Top by IO [Individual Query] = SUBSTRING (qt.text,qs.statement_start_offset/2,
(CASE WHEN qs.statement_end_offset = -1 THEN
Top by Duration LEN(CONVERT(NVARCHAR(MAX), qt.text)) * 2
ELSE qs.statement_end_offset END - qs.statement_start_offset)/2) ,[Parent
Query] = qt.text ,DatabaseName = DB_NAME(qt.dbid)
FROM sys.dm_exec_query_stats qs CROSS APPLY
sys.dm_exec_sql_text(qs.sql_handle) as qt
ORDER BY [Average CPU used] DESC](https://image.slidesharecdn.com/back2basic-tools-100704165139-phpapp01/85/Back-2-basics-SSMS-Tips-IDf-20-320.jpg)