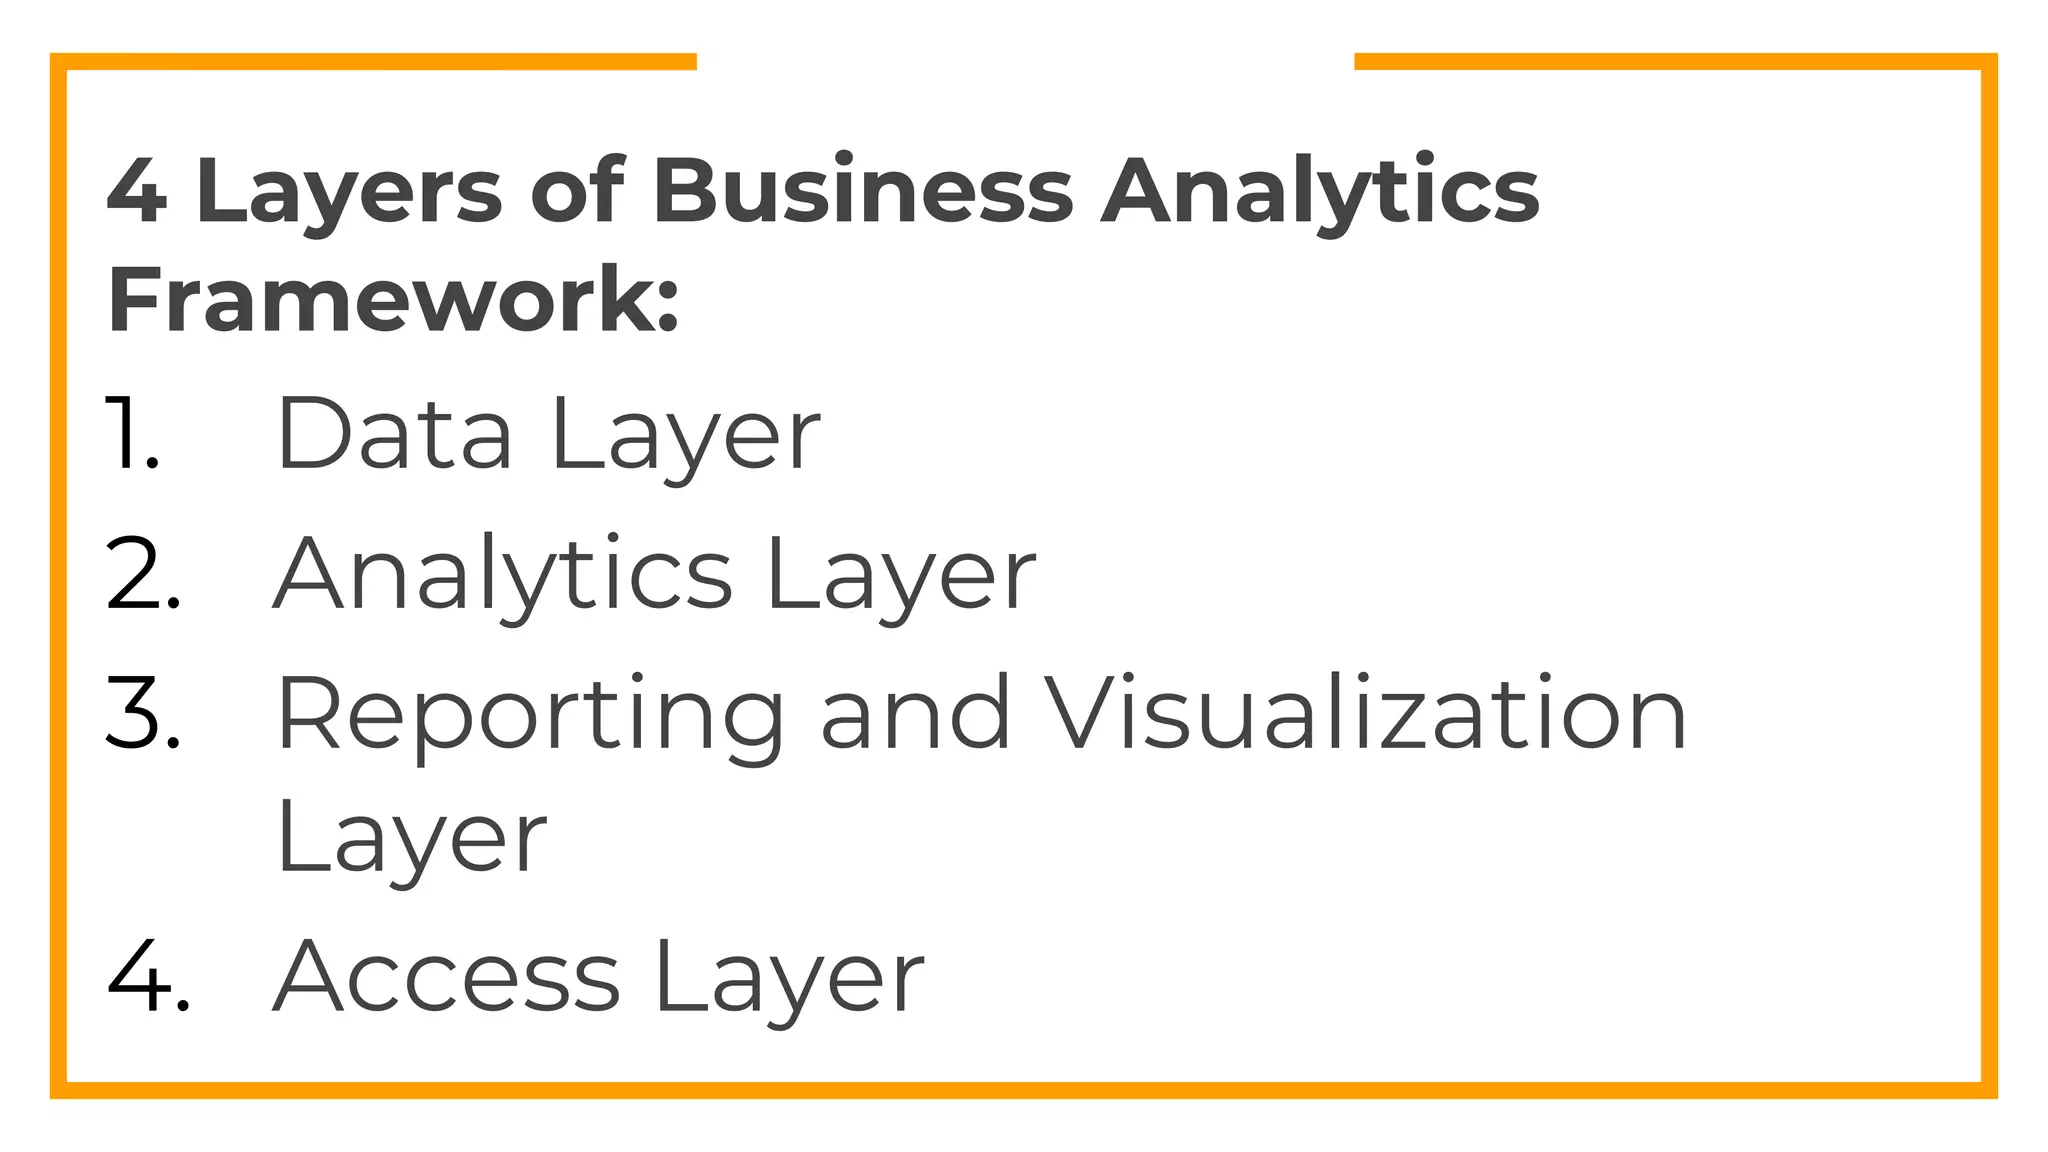
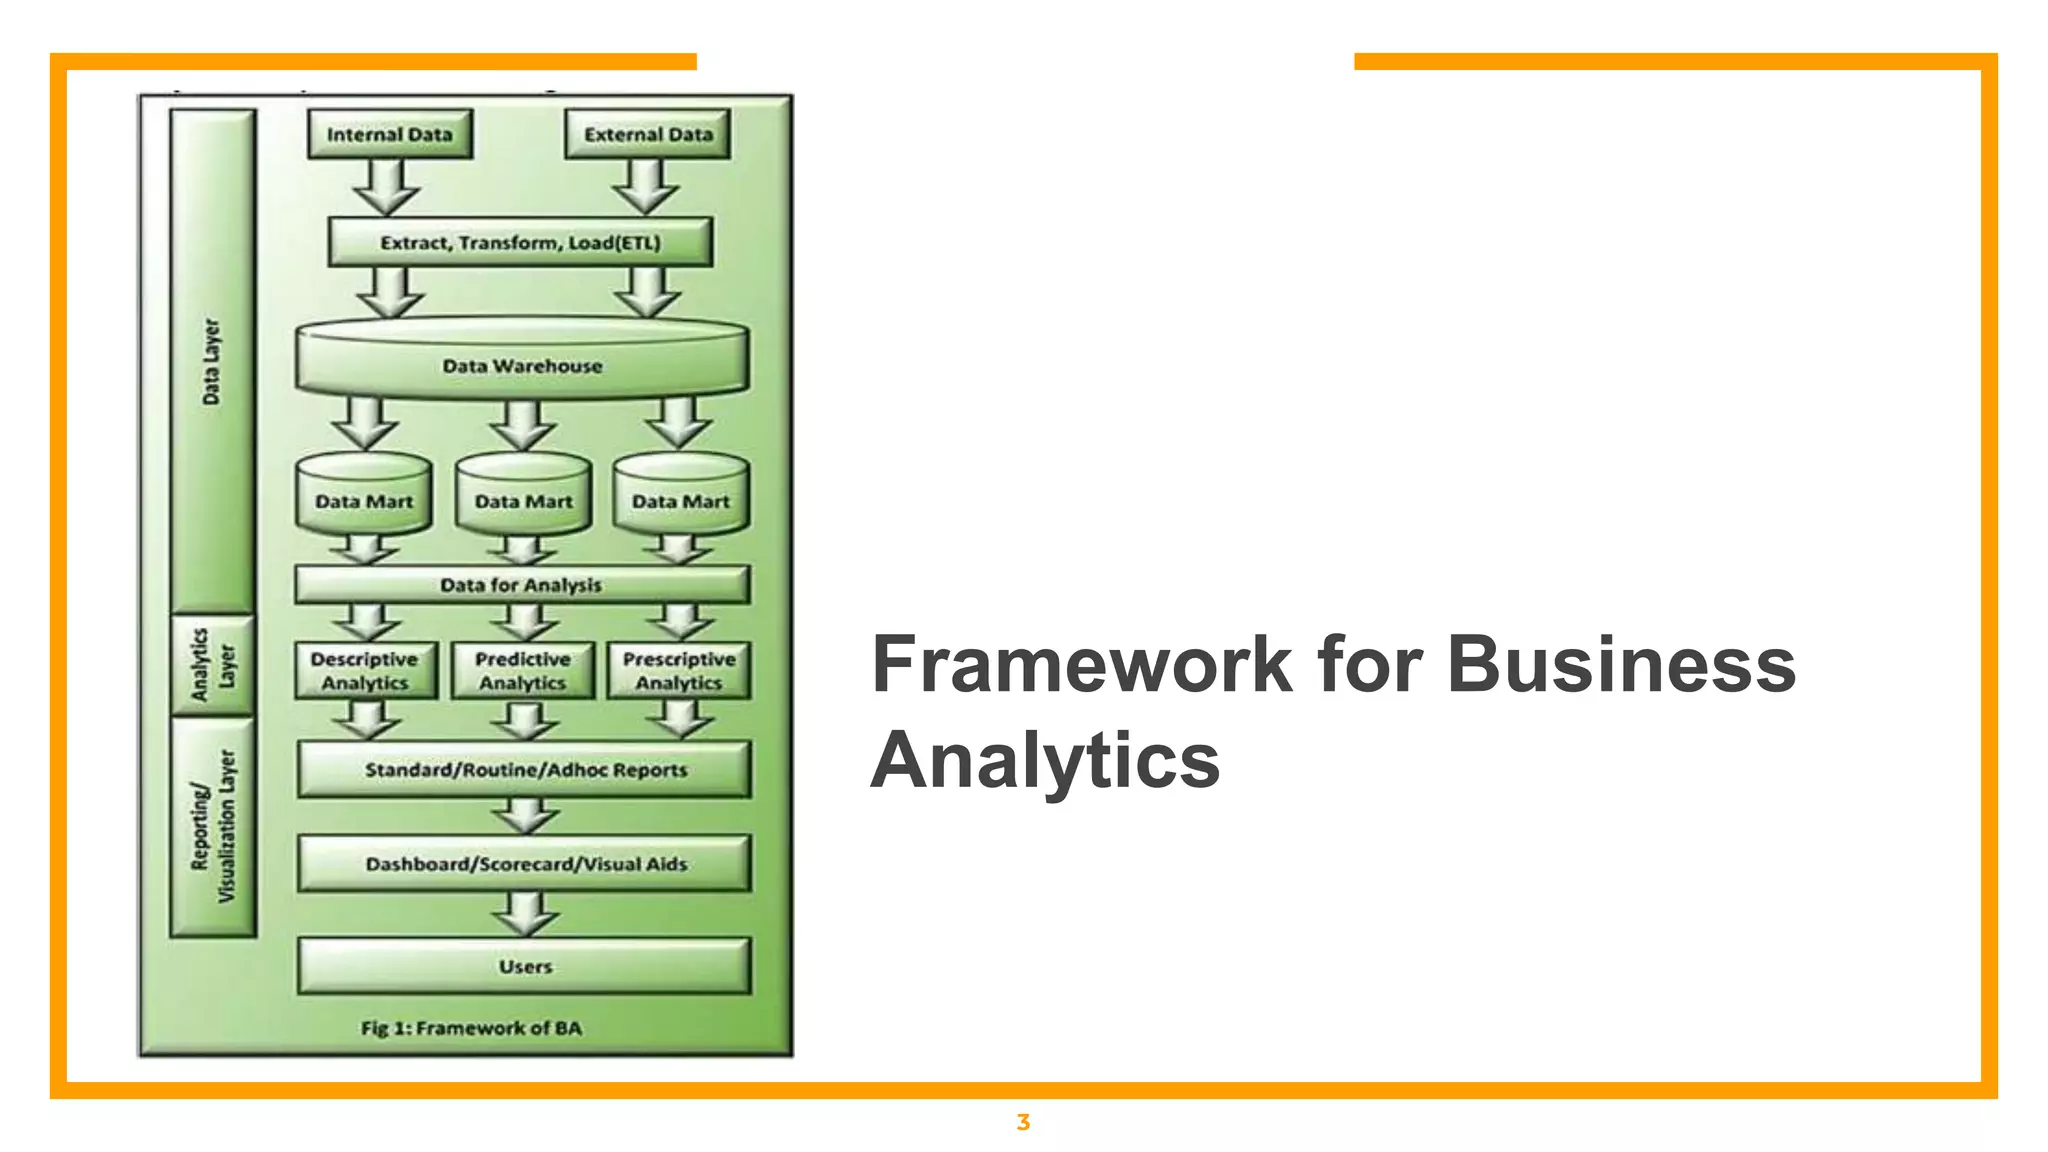
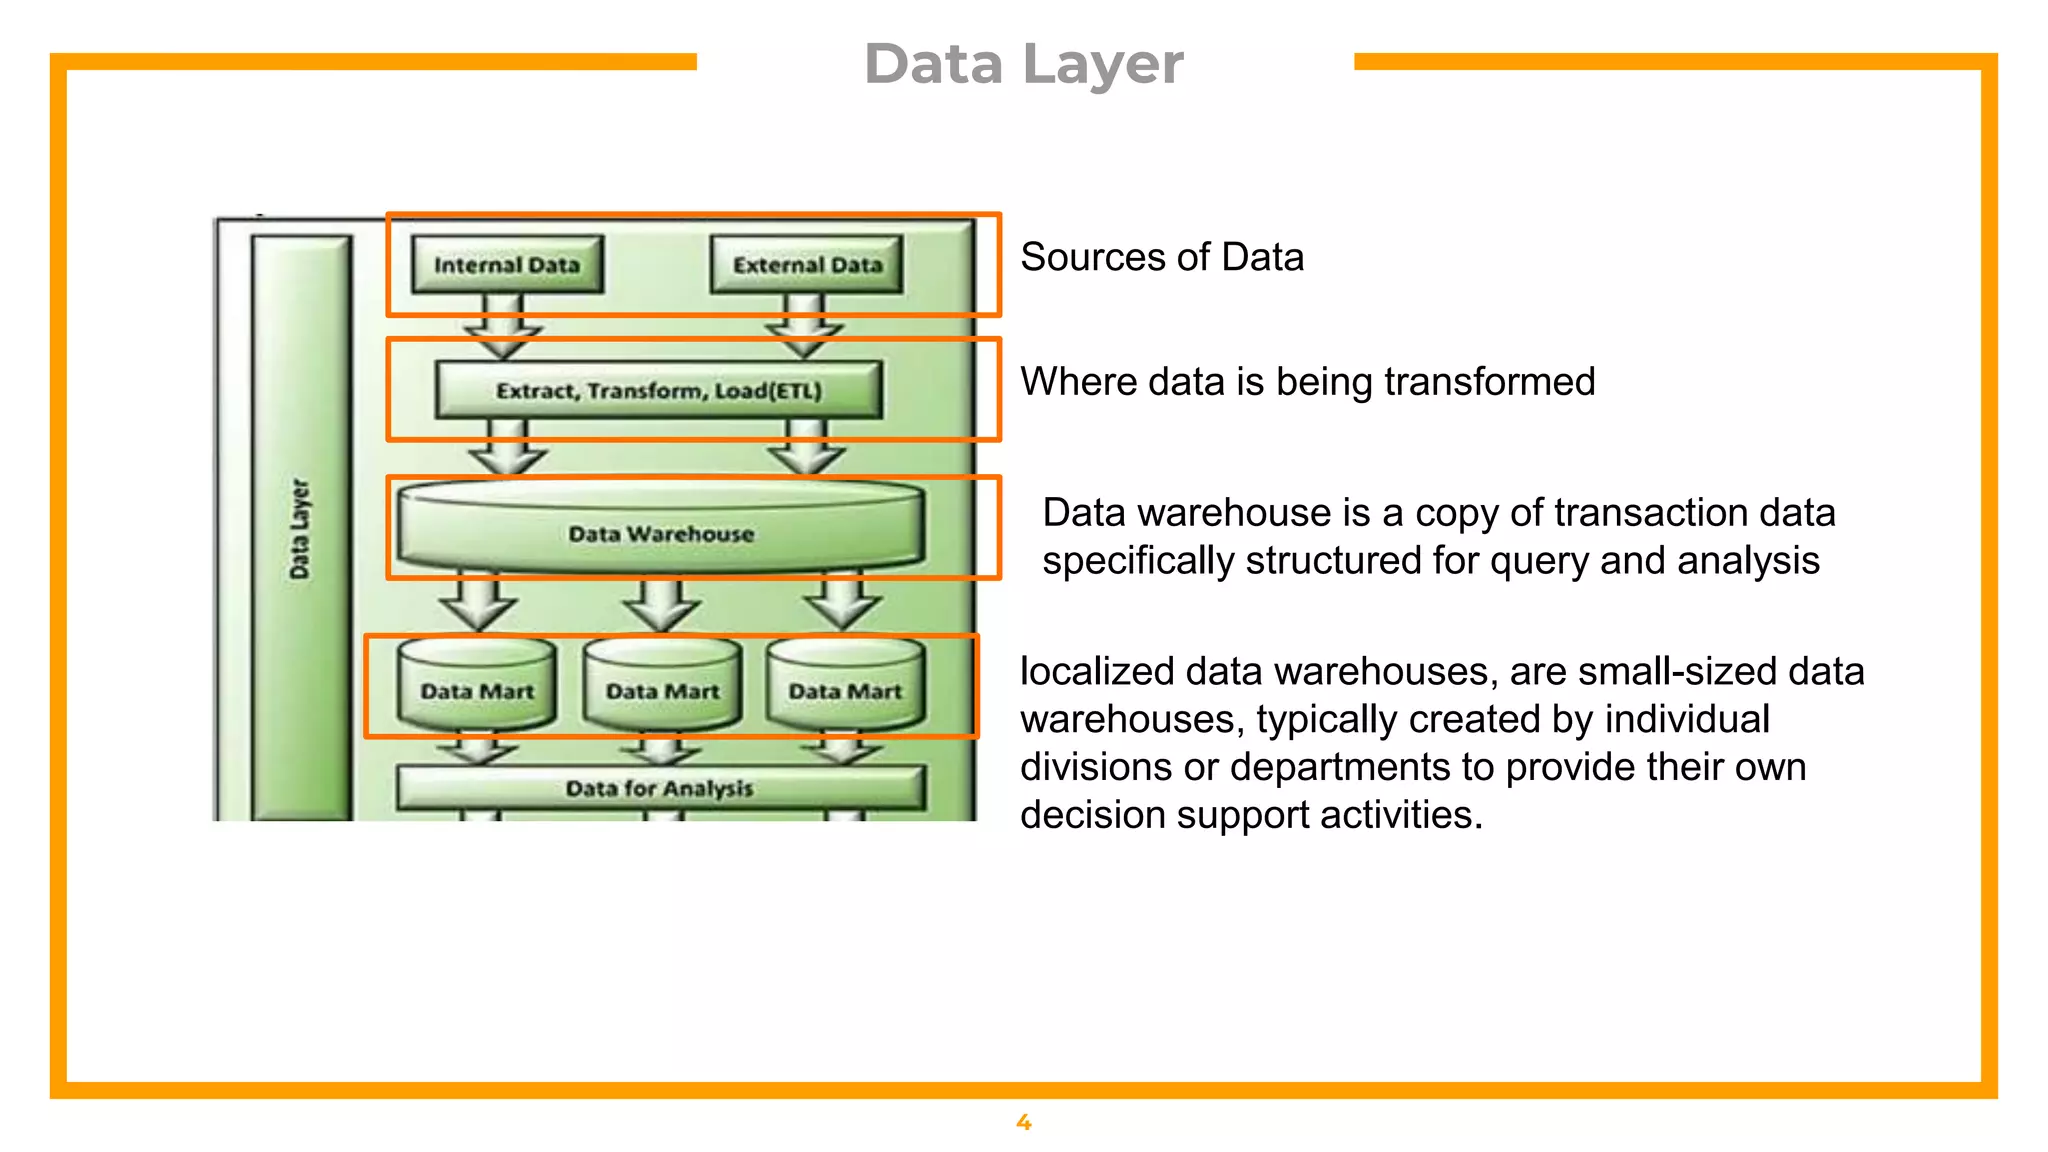
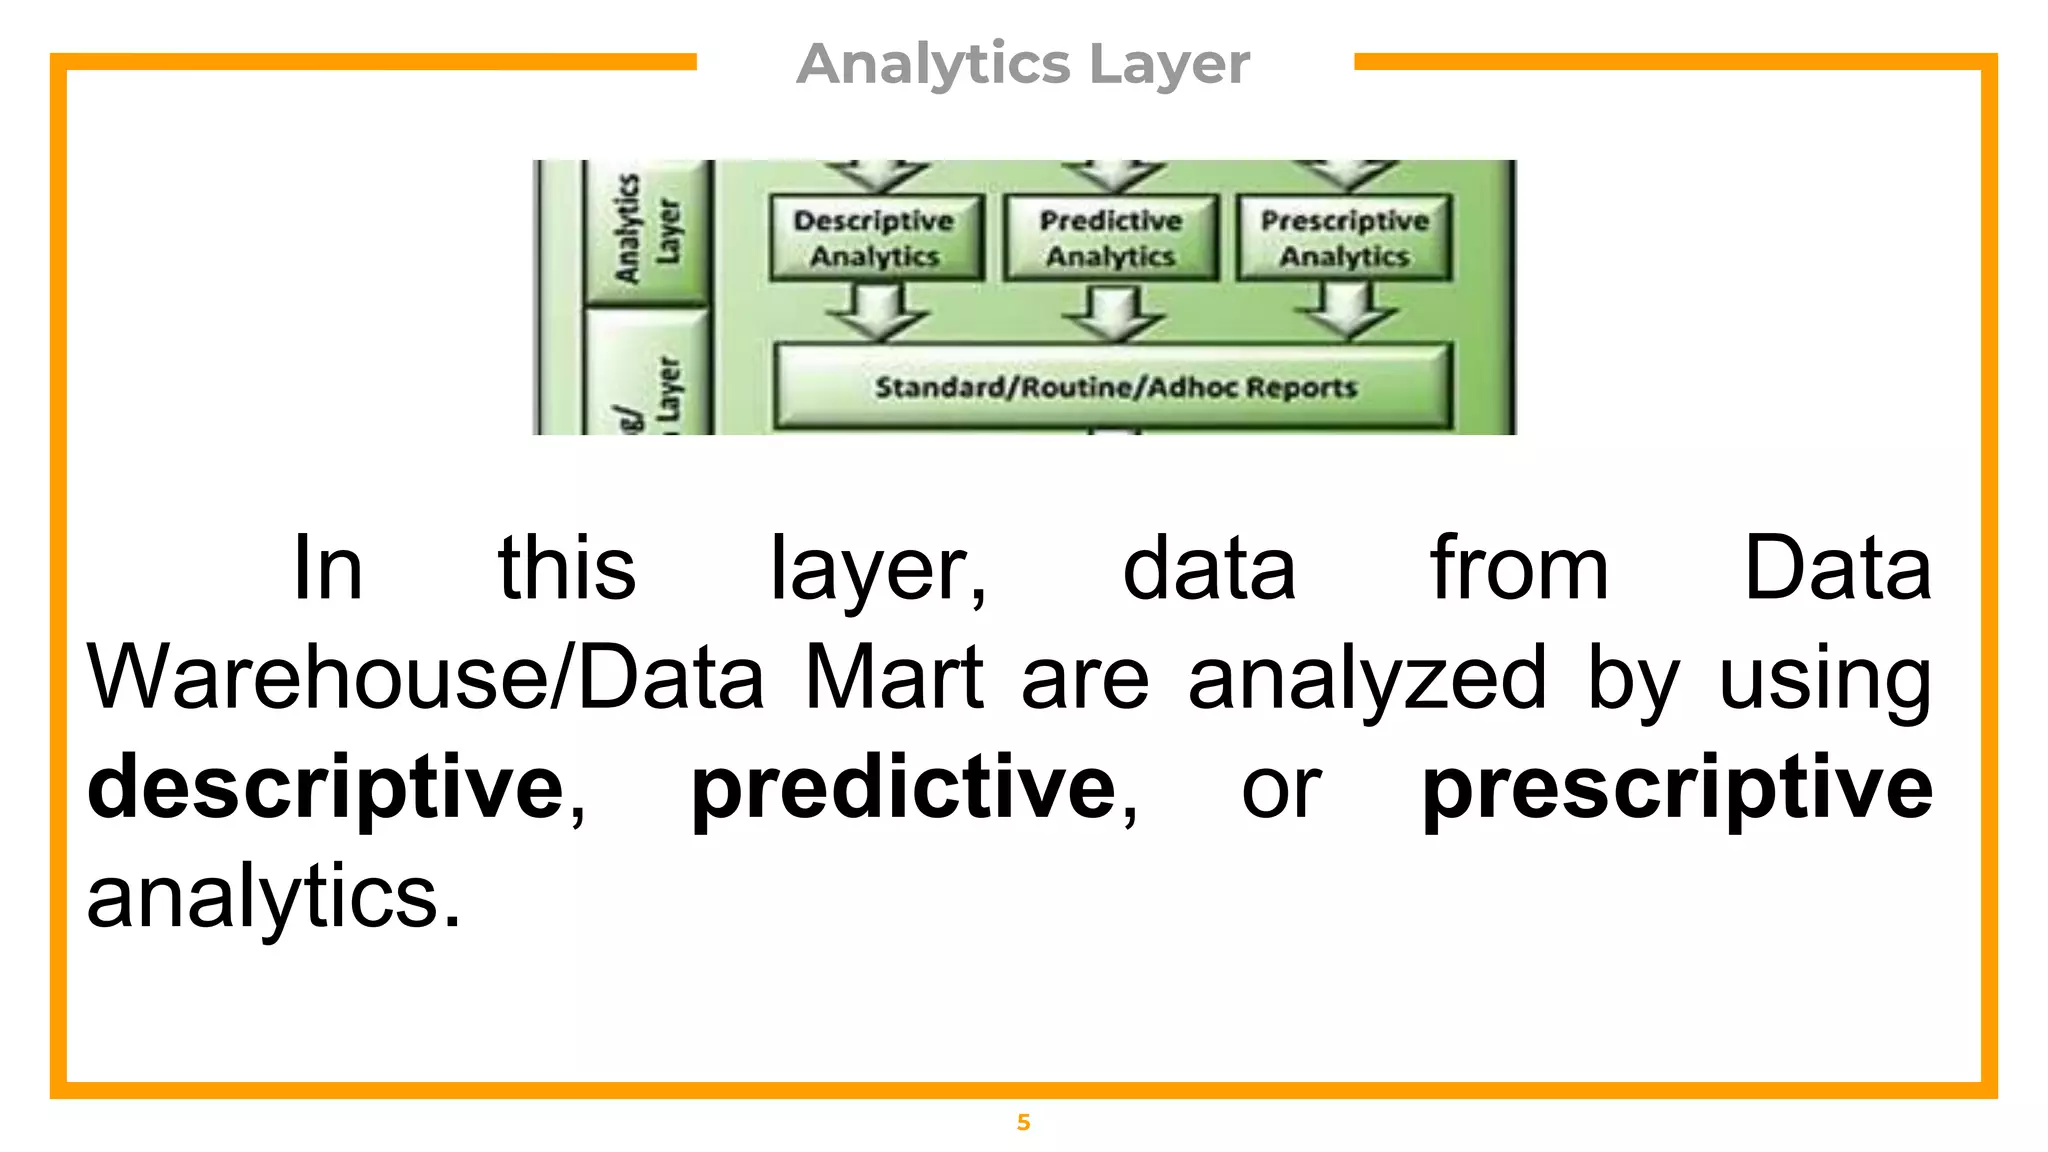
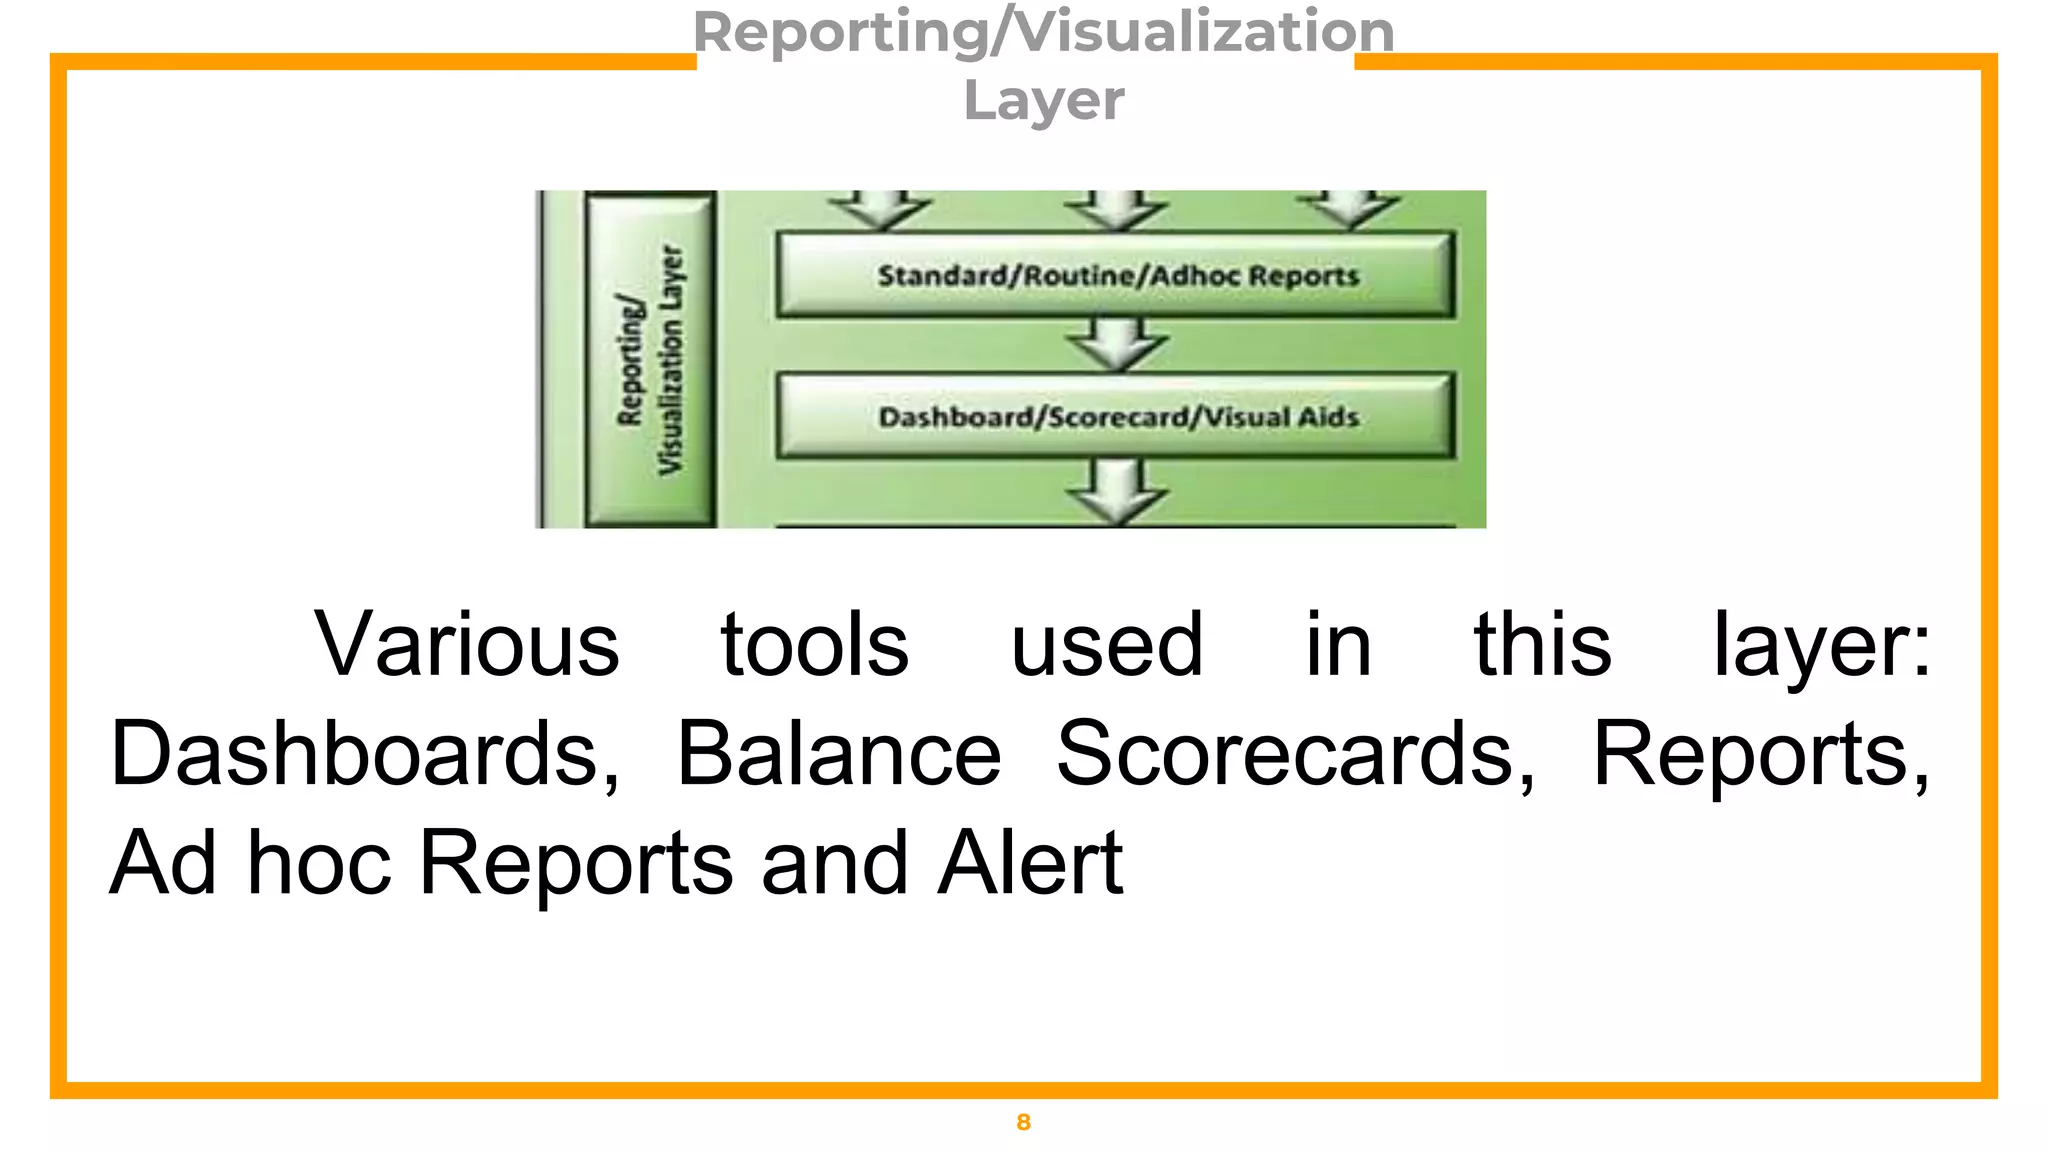
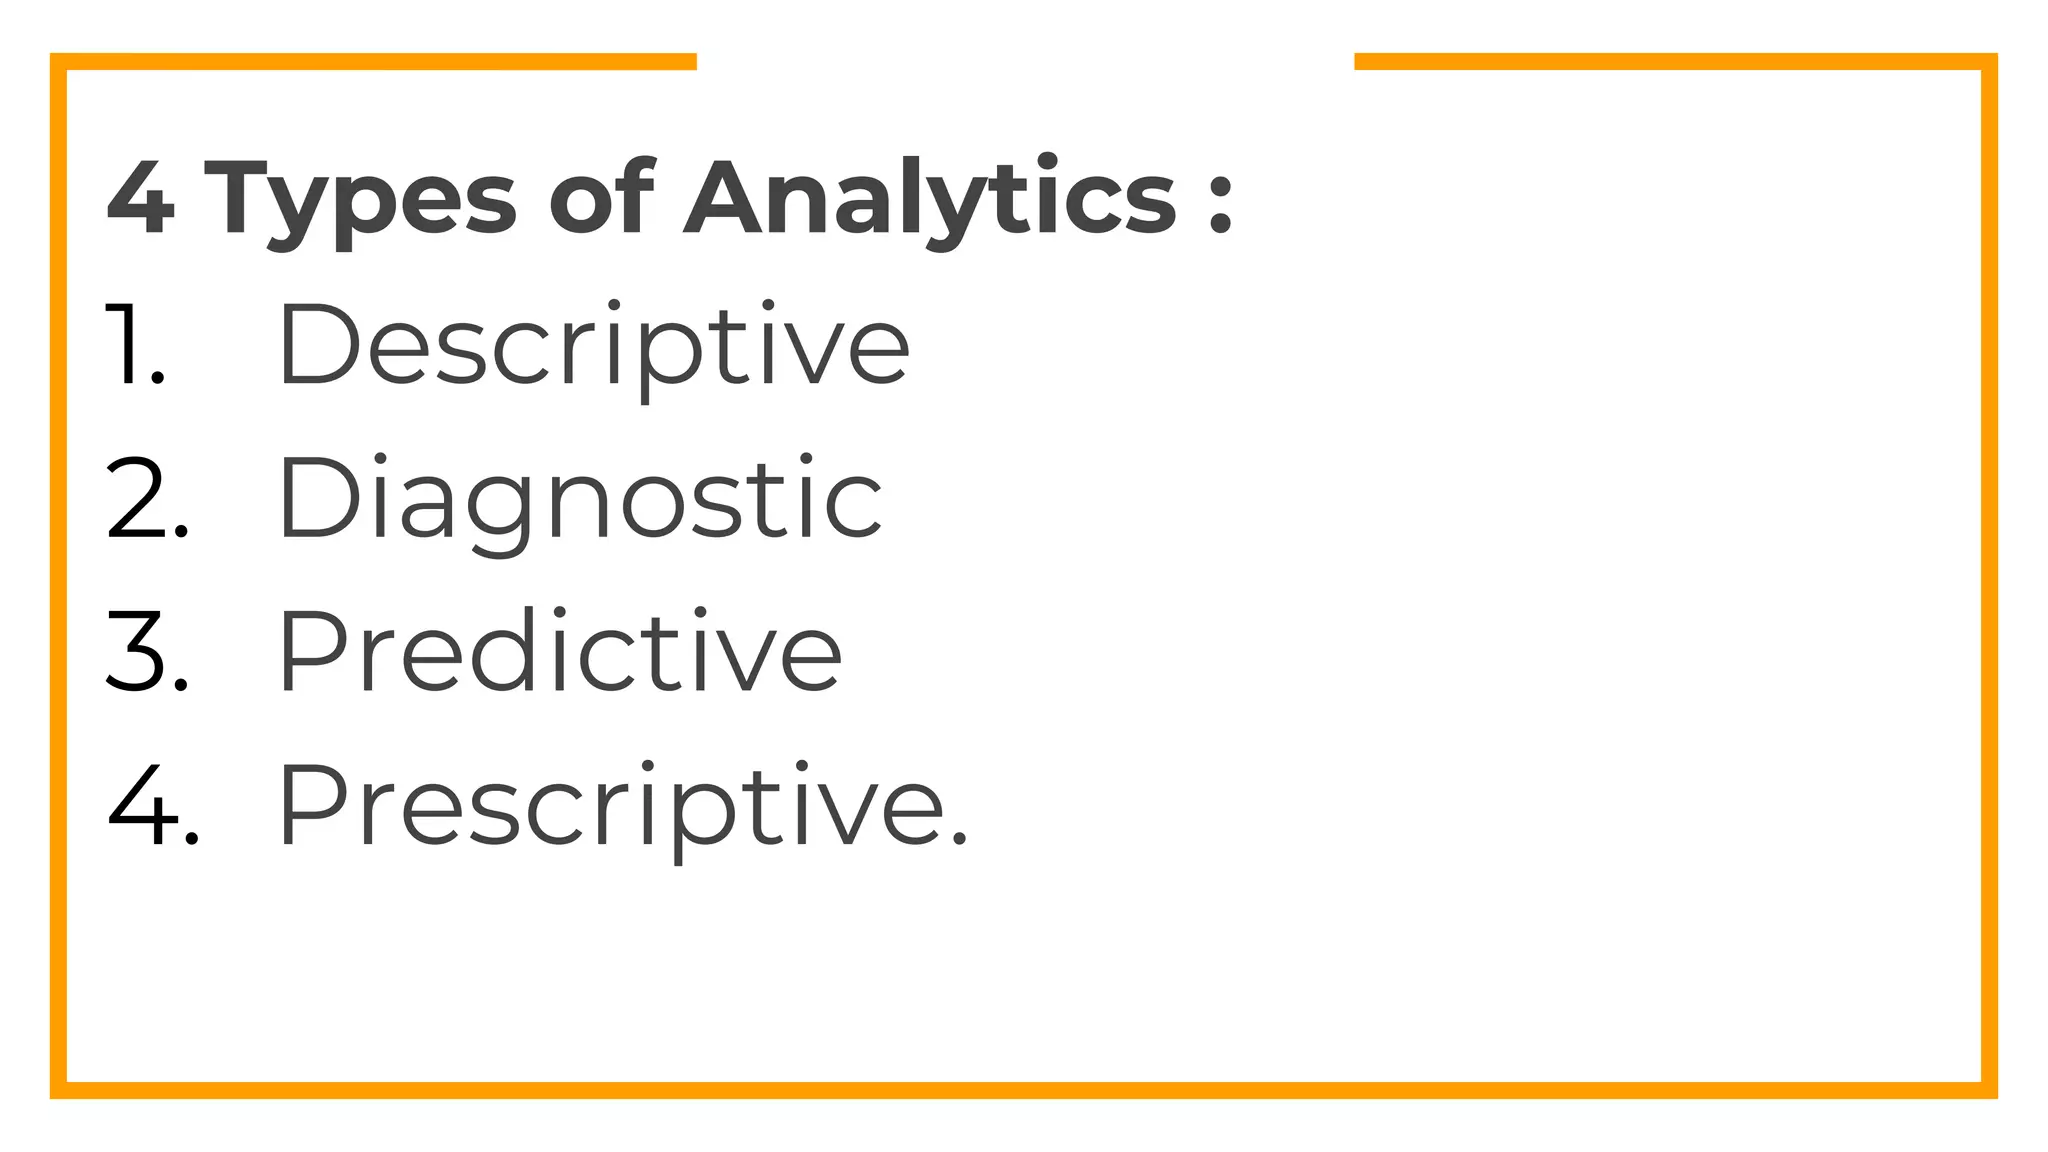
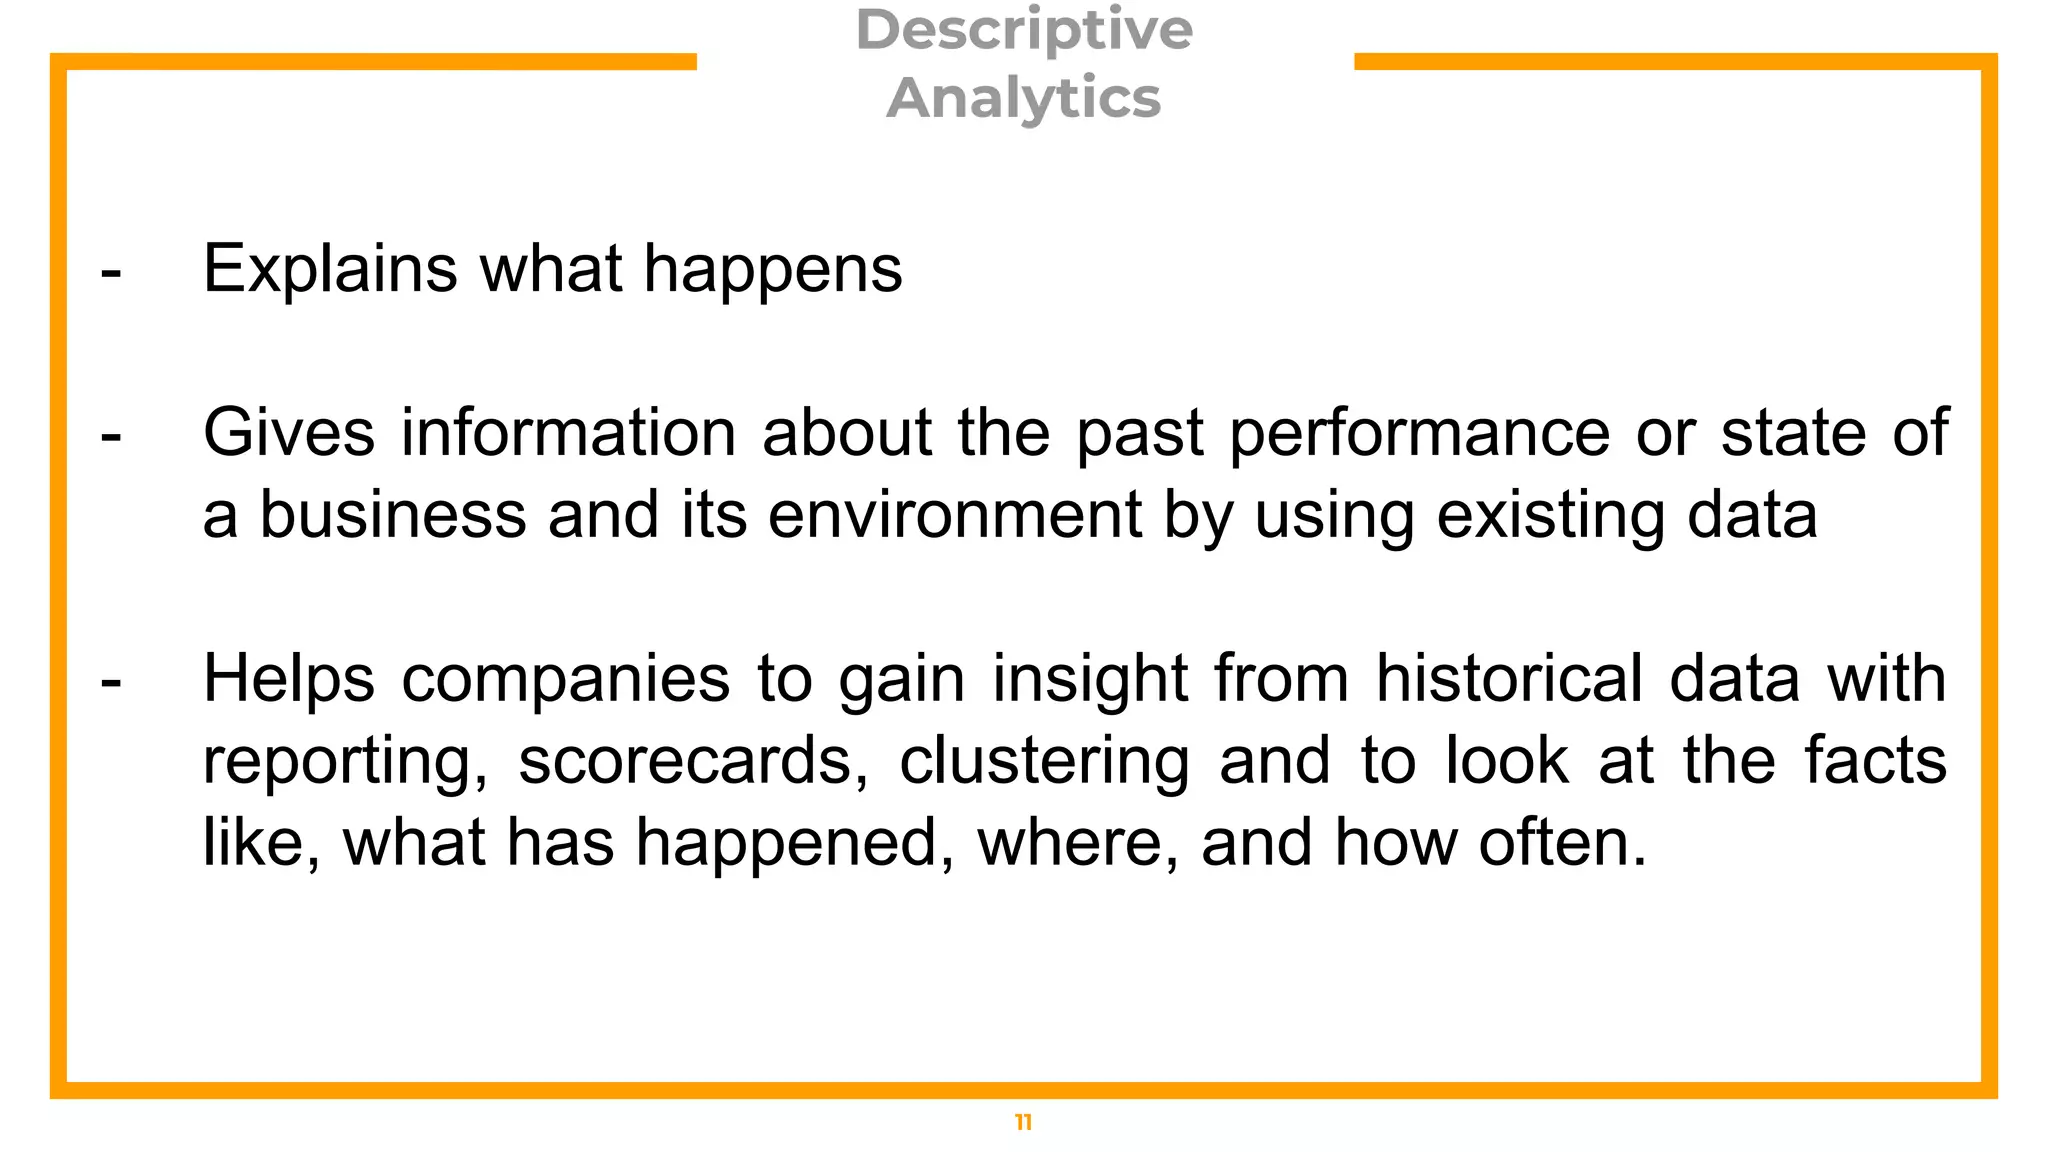
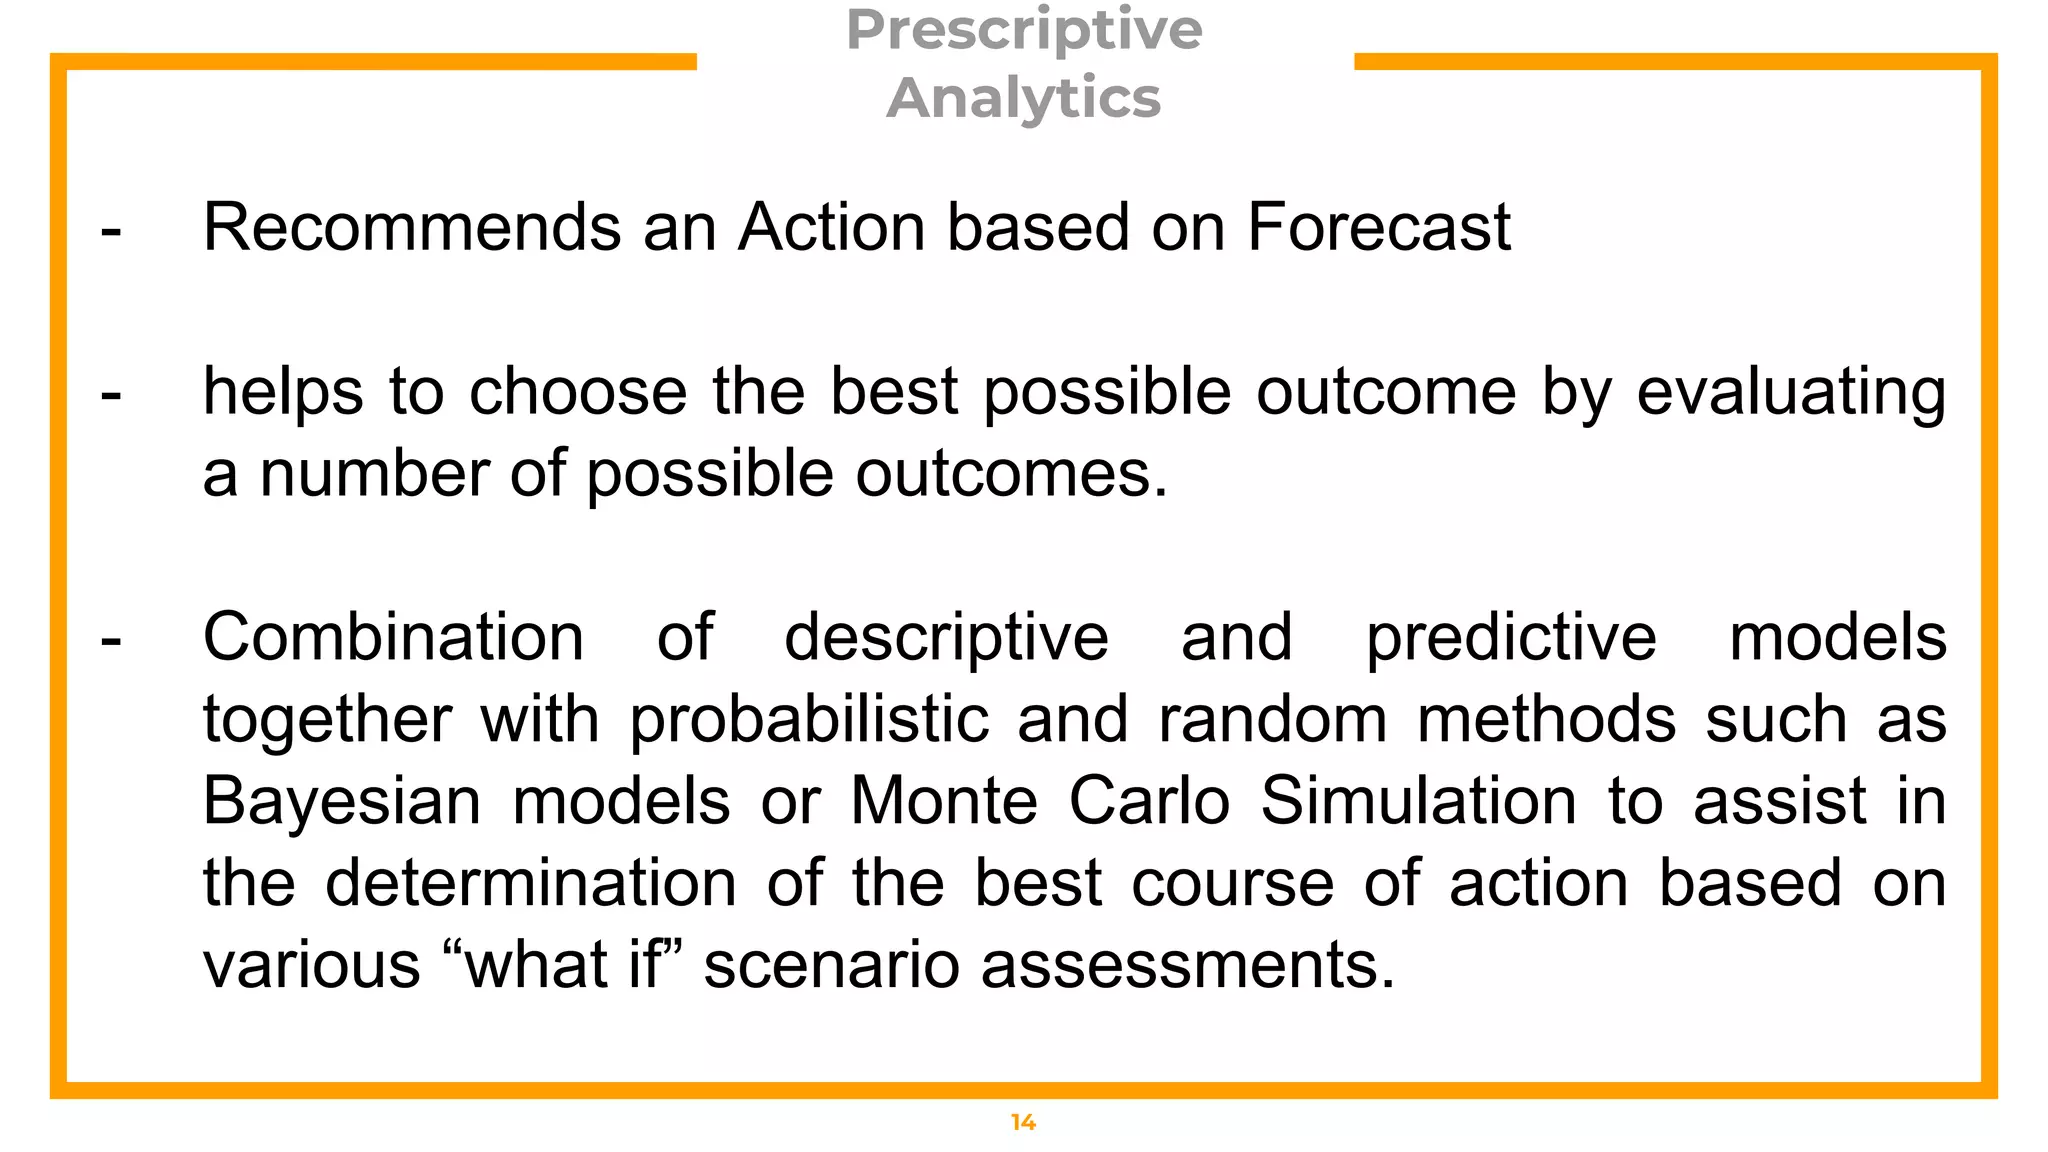
BUSINESS
ANALYTICS
FRAMEWORK
John Christopher V. Reguindin, MIS
Faculty
STI-West Negros University
4 Layers of Business Analytics
Framework:
1. Data Layer
2. Analytics Layer
3. Reporting and Visualization
Layer
4. Access Layer
Framework for Business
Analytics
3
Data Layer
4
Sources of Data
Where data is being transformed
Data warehouse is a copy of transaction data
specifically structured for query and analysis
localized data warehouses, are small-sized data
warehouses, typically created by individual
divisions or departments to provide their own
decision support activities.
Analytics Layer
5
In this layer, data from Data
Warehouse/Data Mart are analyzed by using
descriptive, predictive, or prescriptive
analytics.
Analytics Layer
6
Various techniques used in this layer:
A. Data Mining –
The process of exploration and analysis, by semi-automatic or
automatic means, of huge quantities of data in order to discover
meaningful patterns and rules
The technique that includes management science, statistical,
mathematical and financial models and methods, used to find the vital
relationships between variables in the historical data, perform analysis on
the data or to forecast from data.
Analytics Layer
7
Various techniques used in this layer:
B. Multidimensional Data Analysis
Also known as Online Analytical Processing (OLAP), it is part of
the wider variety of business intelligence software that enables
managers, executives, and analysts to gain insight into data through
rapid, reliable, collaborative access to a wide range of multidimensional
views of information.
It also allows business analysts to rotate data, changing the
relationships to get more detailed insight into corporate information.
Reporting/Visualization
Layer
8
Various tools used in this layer:
Dashboards, Balance Scorecards, Reports,
Ad hoc Reports and Alert
TYPES OF
ANALYTICS
John Christopher V. Reguindin, MIS
Faculty
STI-West Negros University
4 Types of Analytics :
1. Descriptive
2. Diagnostic
3. Predictive
4. Prescriptive.
Descriptive
Analytics
11
- Explains what happens
- Gives information about the past performance or state of
a business and its environment by using existing data
- Helps companies to gain insight from historical data with
reporting, scorecards, clustering and to look at the facts
like, what has happened, where, and how often.
Diagnostic
Analytics
12
- Explains why it happens
- focuses on past performance to determine the answer to
the questions like why it is happening or why something
happened.
- gives companies deep insight into a problem by
techniques such as drill-down, data discovery, data
mining, etc. to find out dependencies and to discover
patterns from the historical data.
Predictive Analytics
13
- Forecast what may happens
- determine the probable future outcome for an event, or
the likelihood of the situation occurring and identify
relationship patterns.
- Its objective is to understand the causes and
relationships in the data to make accurate predictions.
Prescriptive
Analytics
14
- Recommends an Action based on Forecast
- helps to choose the best possible outcome by evaluating
a number of possible outcomes.
- Combination of descriptive and predictive models
together with probabilistic and random methods such as
Bayesian models or Monte Carlo Simulation to assist in
the determination of the best course of action based on
various “what if” scenario assessments.
THANK YOU AND
GODBLESS

BA Framework, Anaytics and types newest Farmeowrk.pptx

  • 1.
    BUSINESS ANALYTICS FRAMEWORK John Christopher V.Reguindin, MIS Faculty STI-West Negros University
  • 2.
    4 Layers ofBusiness Analytics Framework: 1. Data Layer 2. Analytics Layer 3. Reporting and Visualization Layer 4. Access Layer
  • 3.
  • 4.
    Data Layer 4 Sources ofData Where data is being transformed Data warehouse is a copy of transaction data specifically structured for query and analysis localized data warehouses, are small-sized data warehouses, typically created by individual divisions or departments to provide their own decision support activities.
  • 5.
    Analytics Layer 5 In thislayer, data from Data Warehouse/Data Mart are analyzed by using descriptive, predictive, or prescriptive analytics.
  • 6.
    Analytics Layer 6 Various techniquesused in this layer: A. Data Mining – The process of exploration and analysis, by semi-automatic or automatic means, of huge quantities of data in order to discover meaningful patterns and rules The technique that includes management science, statistical, mathematical and financial models and methods, used to find the vital relationships between variables in the historical data, perform analysis on the data or to forecast from data.
  • 7.
    Analytics Layer 7 Various techniquesused in this layer: B. Multidimensional Data Analysis Also known as Online Analytical Processing (OLAP), it is part of the wider variety of business intelligence software that enables managers, executives, and analysts to gain insight into data through rapid, reliable, collaborative access to a wide range of multidimensional views of information. It also allows business analysts to rotate data, changing the relationships to get more detailed insight into corporate information.
  • 8.
    Reporting/Visualization Layer 8 Various tools usedin this layer: Dashboards, Balance Scorecards, Reports, Ad hoc Reports and Alert
  • 9.
    TYPES OF ANALYTICS John ChristopherV. Reguindin, MIS Faculty STI-West Negros University
  • 10.
    4 Types ofAnalytics : 1. Descriptive 2. Diagnostic 3. Predictive 4. Prescriptive.
  • 11.
    Descriptive Analytics 11 - Explains whathappens - Gives information about the past performance or state of a business and its environment by using existing data - Helps companies to gain insight from historical data with reporting, scorecards, clustering and to look at the facts like, what has happened, where, and how often.
  • 12.
    Diagnostic Analytics 12 - Explains whyit happens - focuses on past performance to determine the answer to the questions like why it is happening or why something happened. - gives companies deep insight into a problem by techniques such as drill-down, data discovery, data mining, etc. to find out dependencies and to discover patterns from the historical data.
  • 13.
    Predictive Analytics 13 - Forecastwhat may happens - determine the probable future outcome for an event, or the likelihood of the situation occurring and identify relationship patterns. - Its objective is to understand the causes and relationships in the data to make accurate predictions.
  • 14.
    Prescriptive Analytics 14 - Recommends anAction based on Forecast - helps to choose the best possible outcome by evaluating a number of possible outcomes. - Combination of descriptive and predictive models together with probabilistic and random methods such as Bayesian models or Monte Carlo Simulation to assist in the determination of the best course of action based on various “what if” scenario assessments.
  • 15.