Download to read offline

![30
Copyright © 2020, Oracle and/or its affiliates | Confidential: Internal/Restricted/Highly Restricted
[Date]
Product Unit price Unit
Database Management - Cloud
Databases
$0.04 OCPU Per Hour
Database Management - External DB $0.04 Host CPU per hour
Database Management - External DB
BYOL
$0.02 Host CPU per hour
Observability and Management Platform - Database Management](https://image.slidesharecdn.com/avanttictechdates-delamonitorizacinalaobservabilidad-211202084130/75/Avanttic-tech-dates-de-la-monitorizacion-a-la-observabilidad-30-2048.jpg)
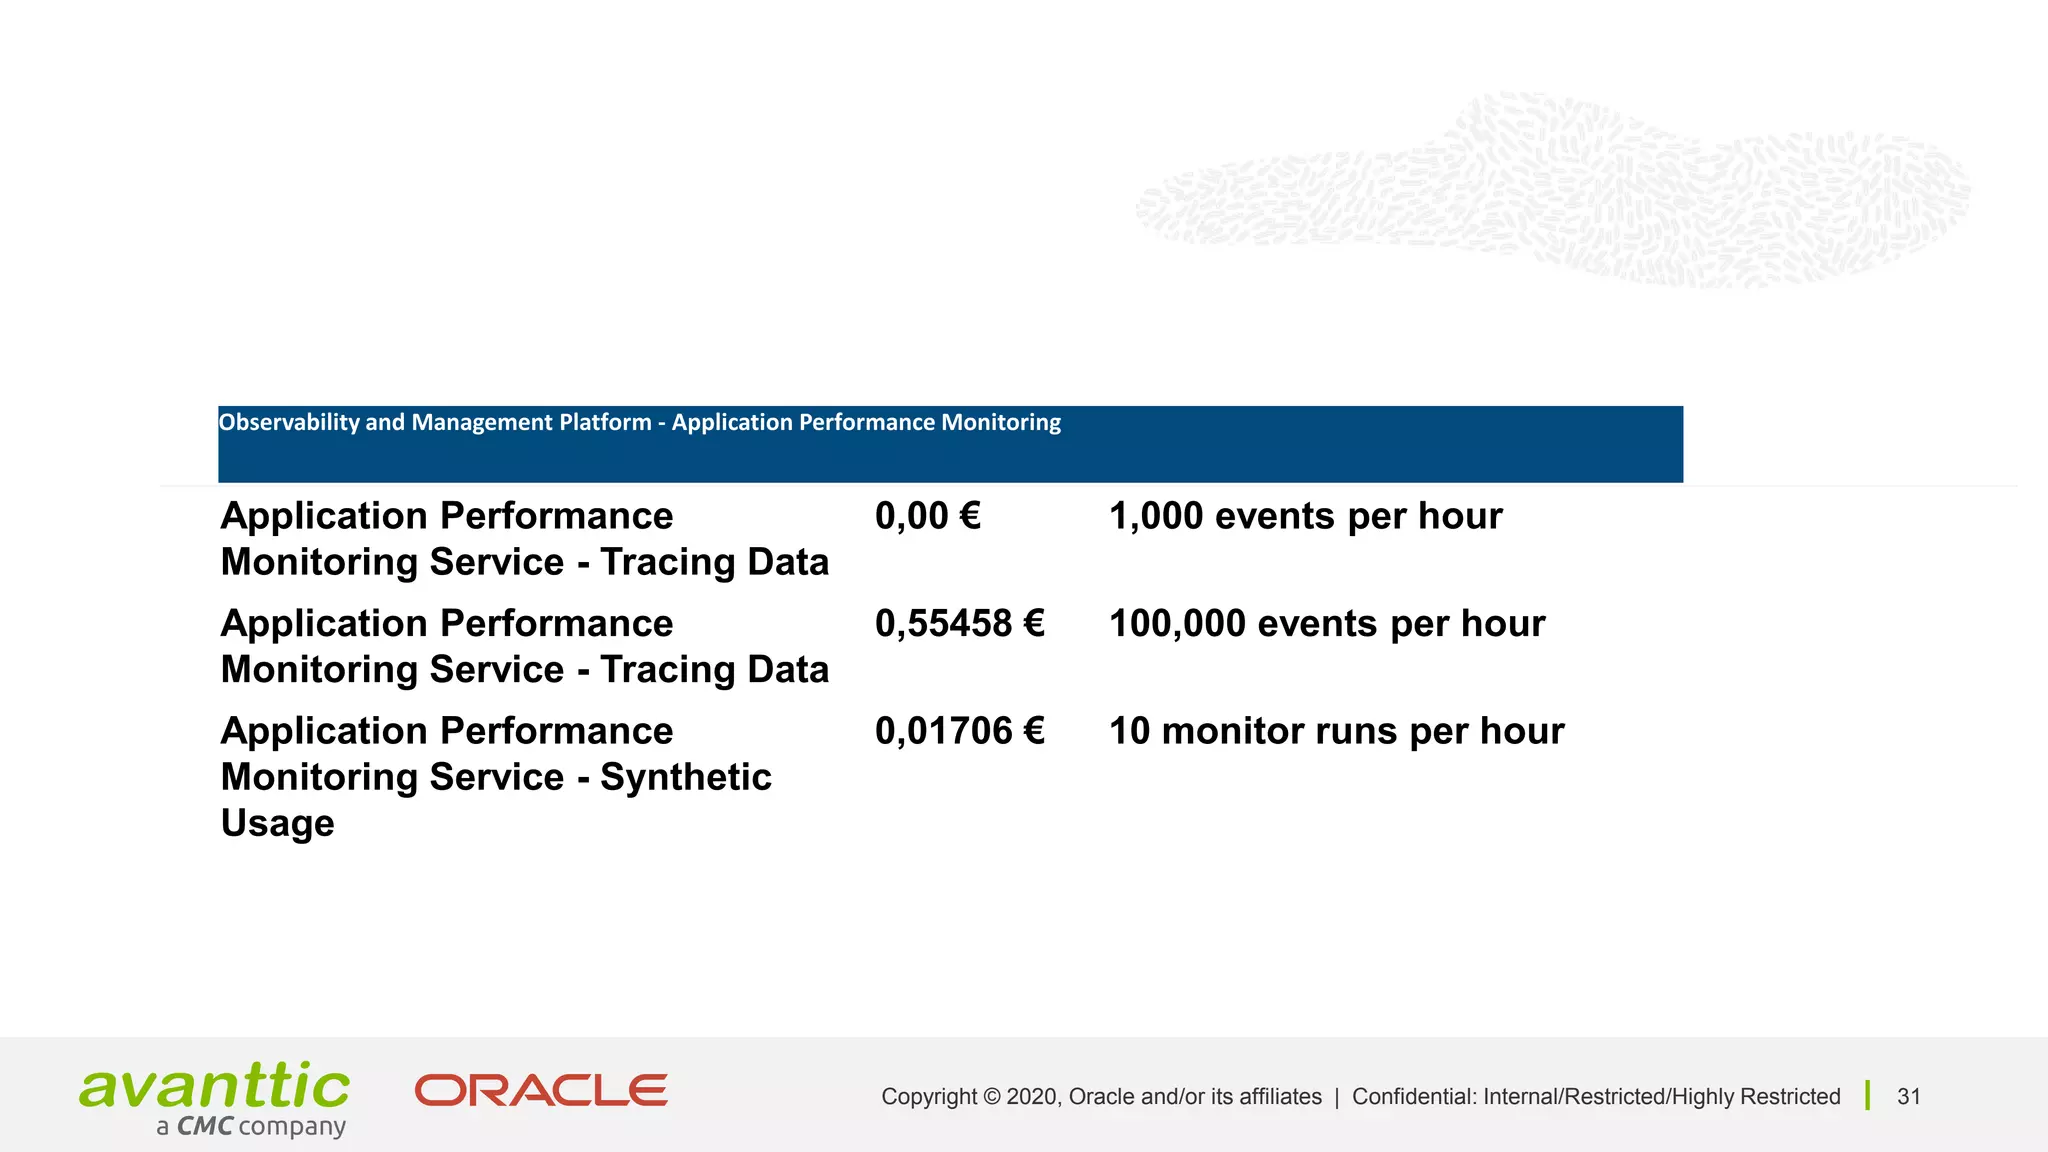

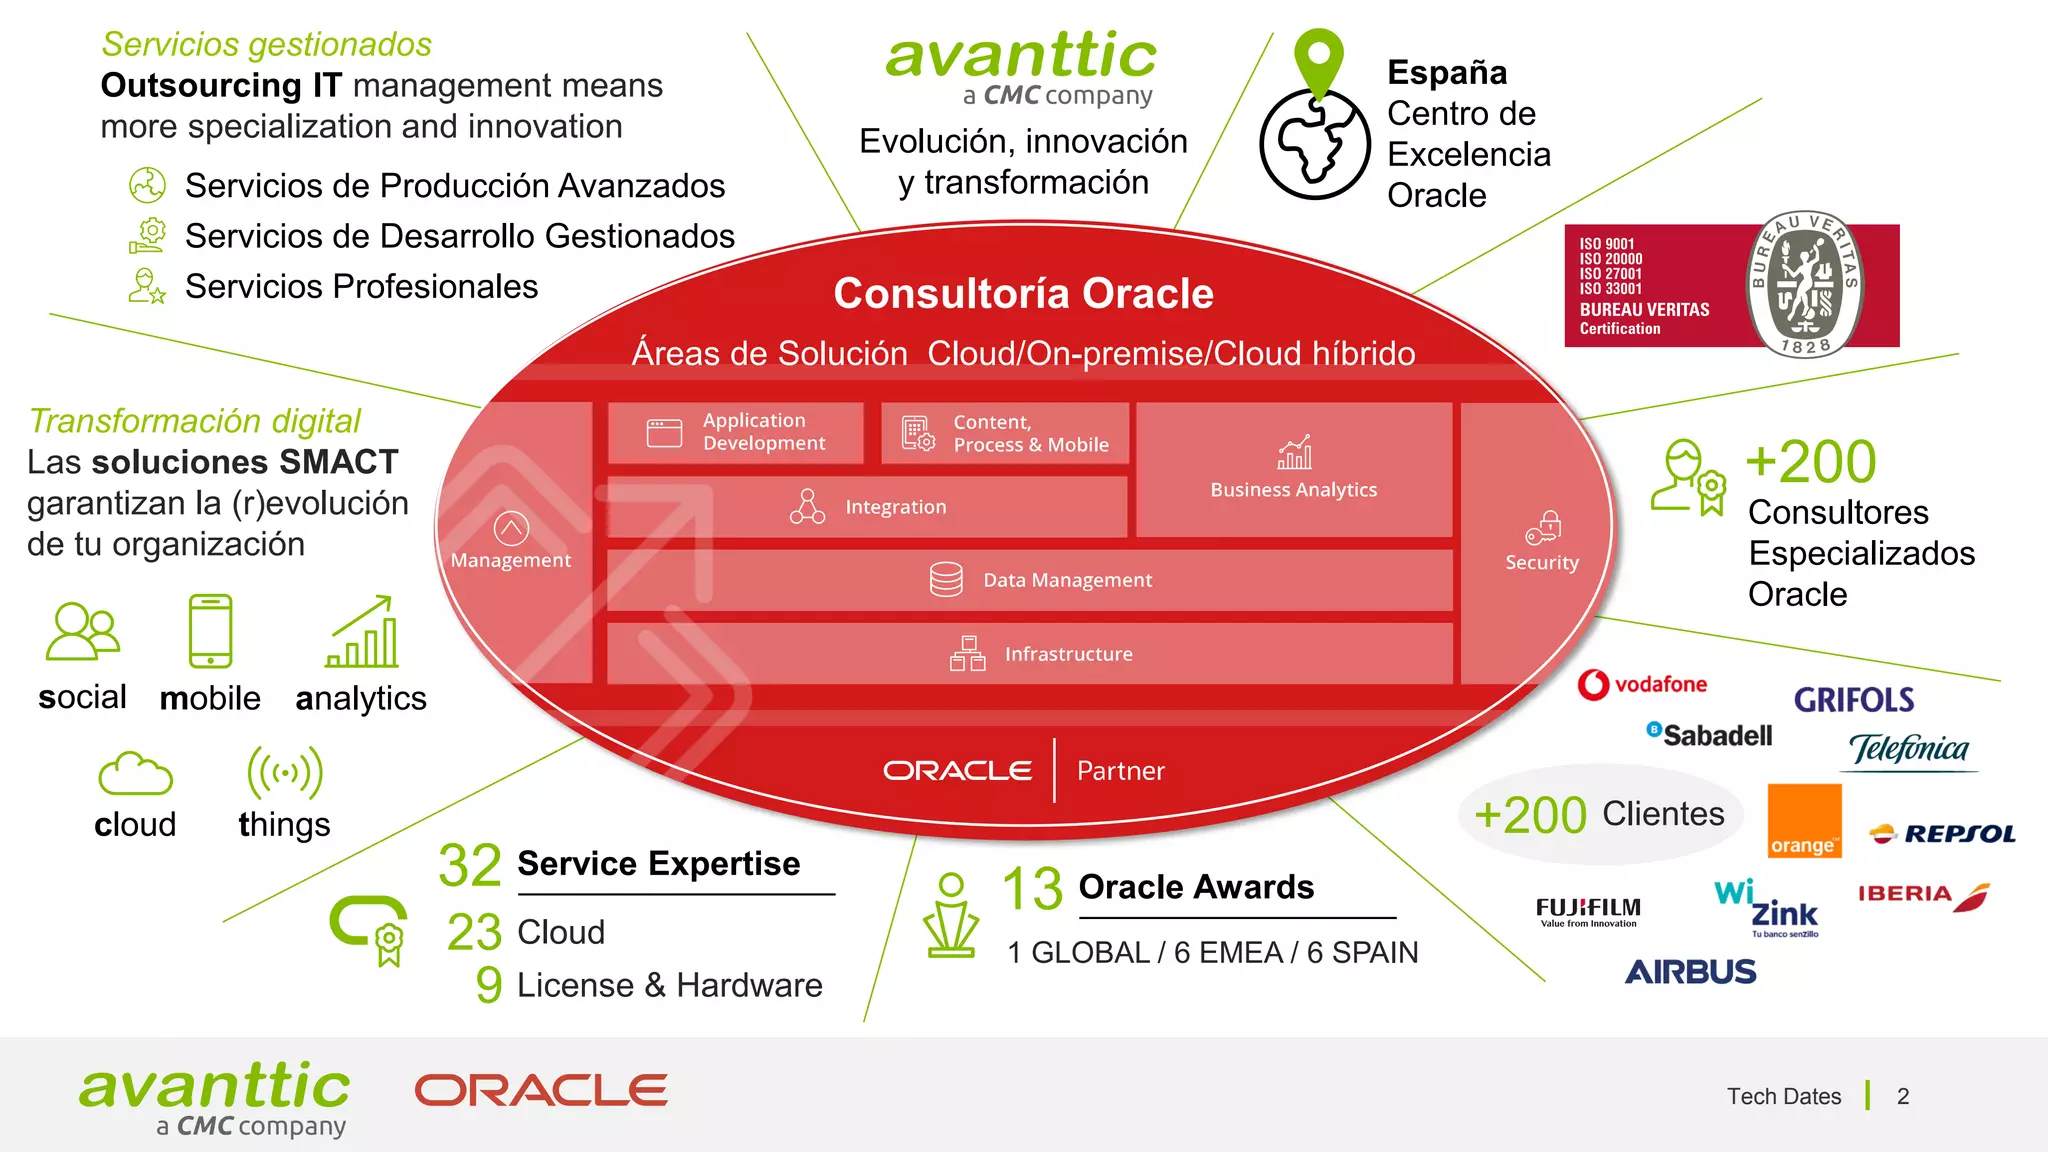
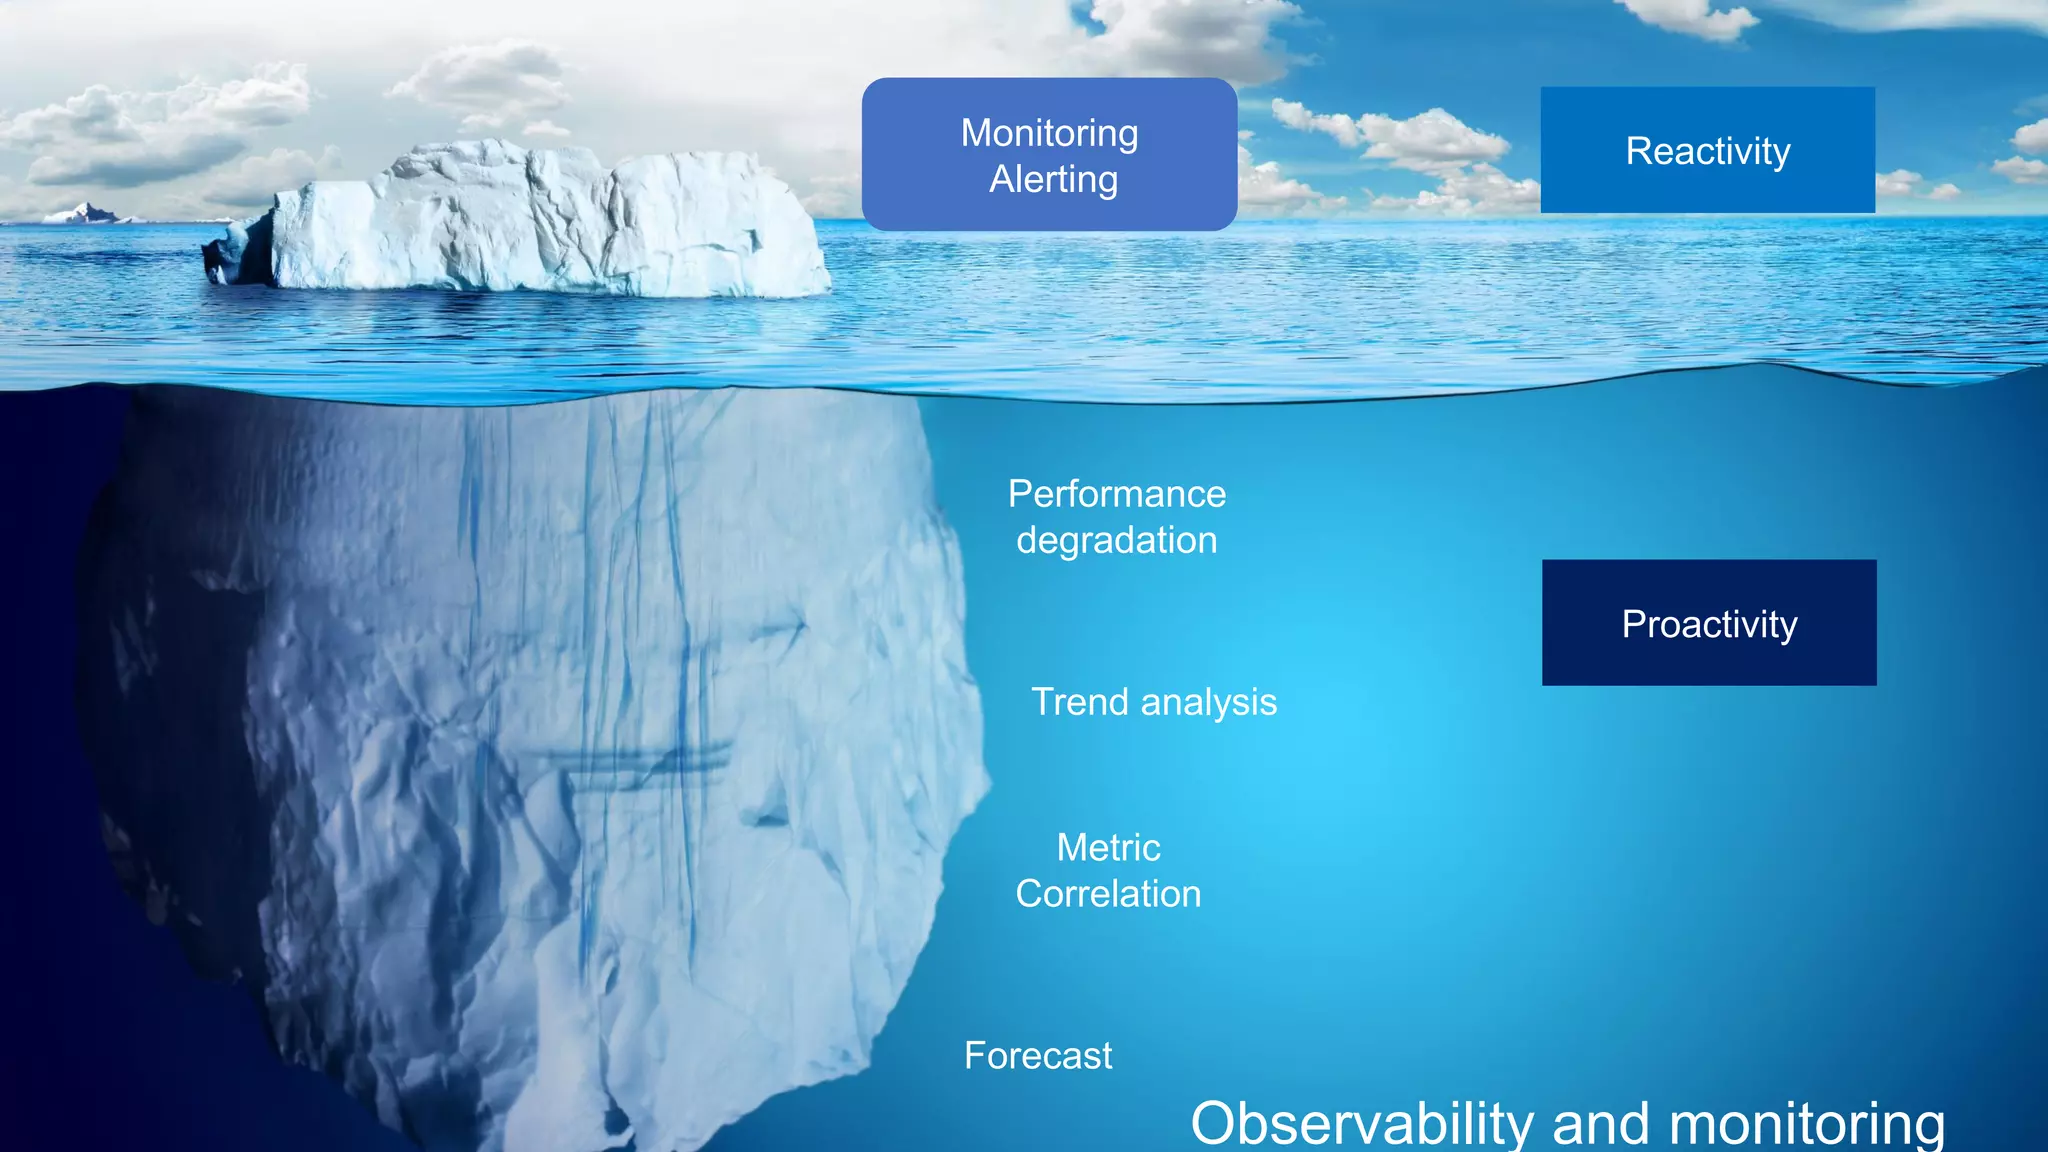
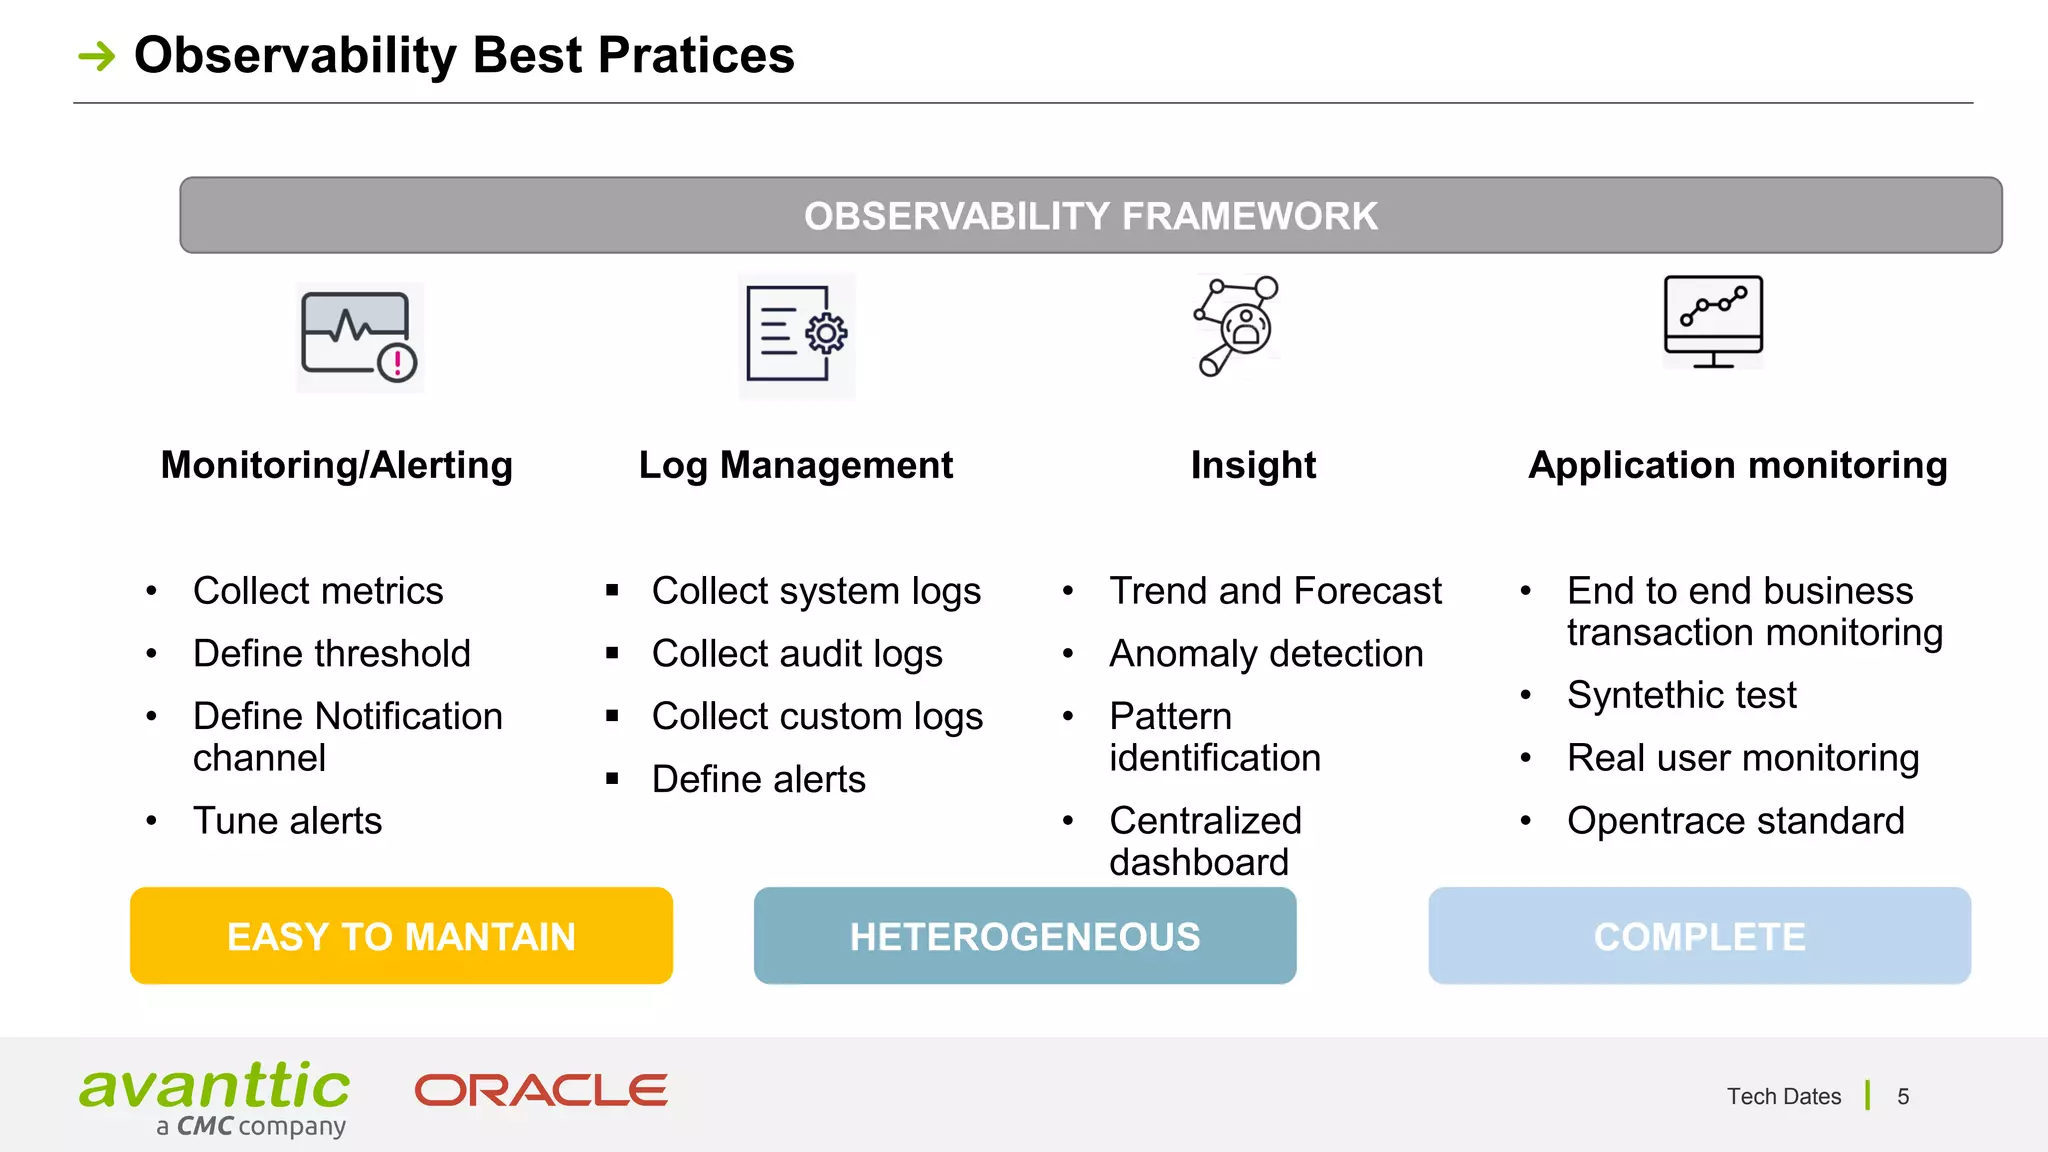
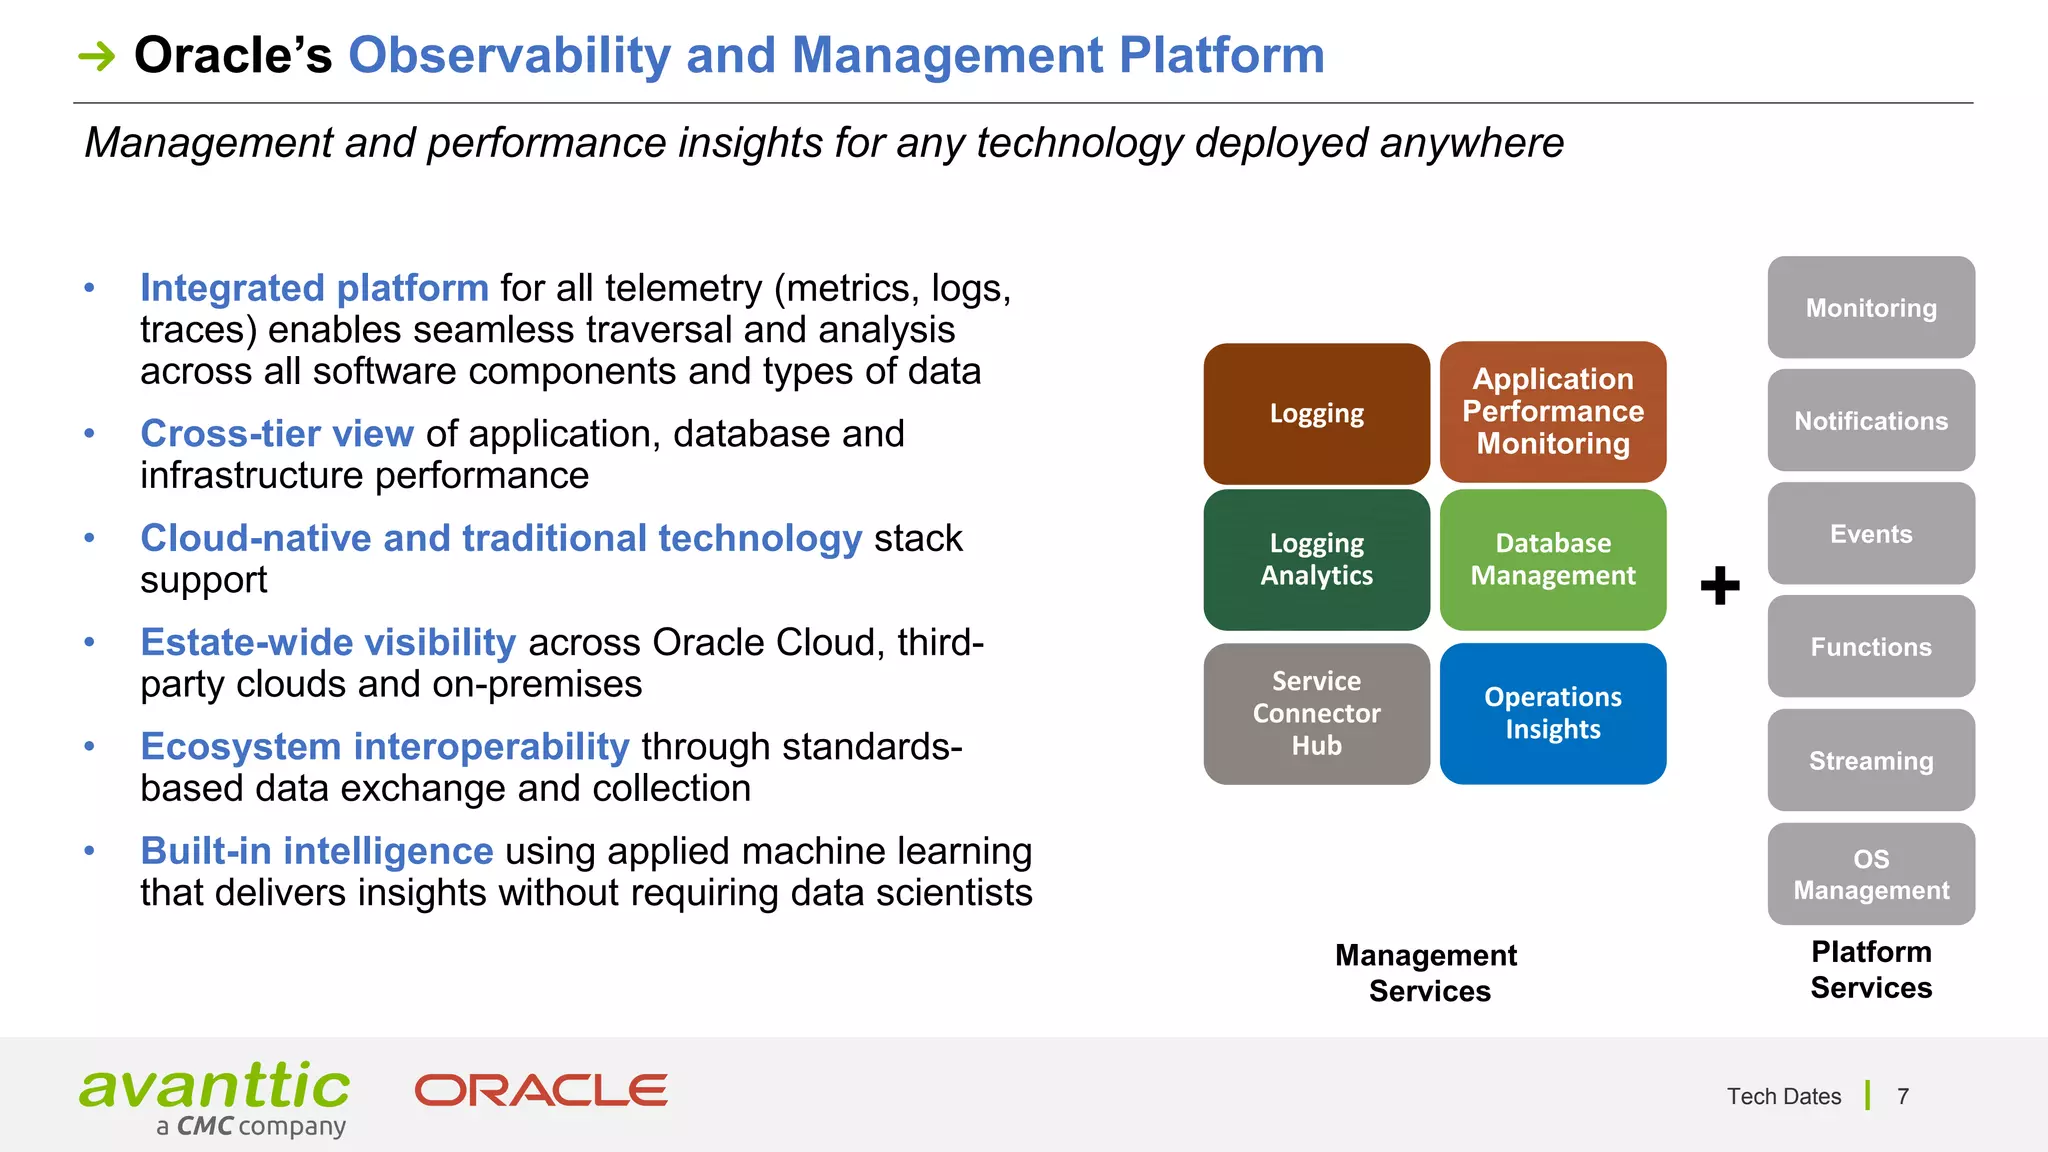
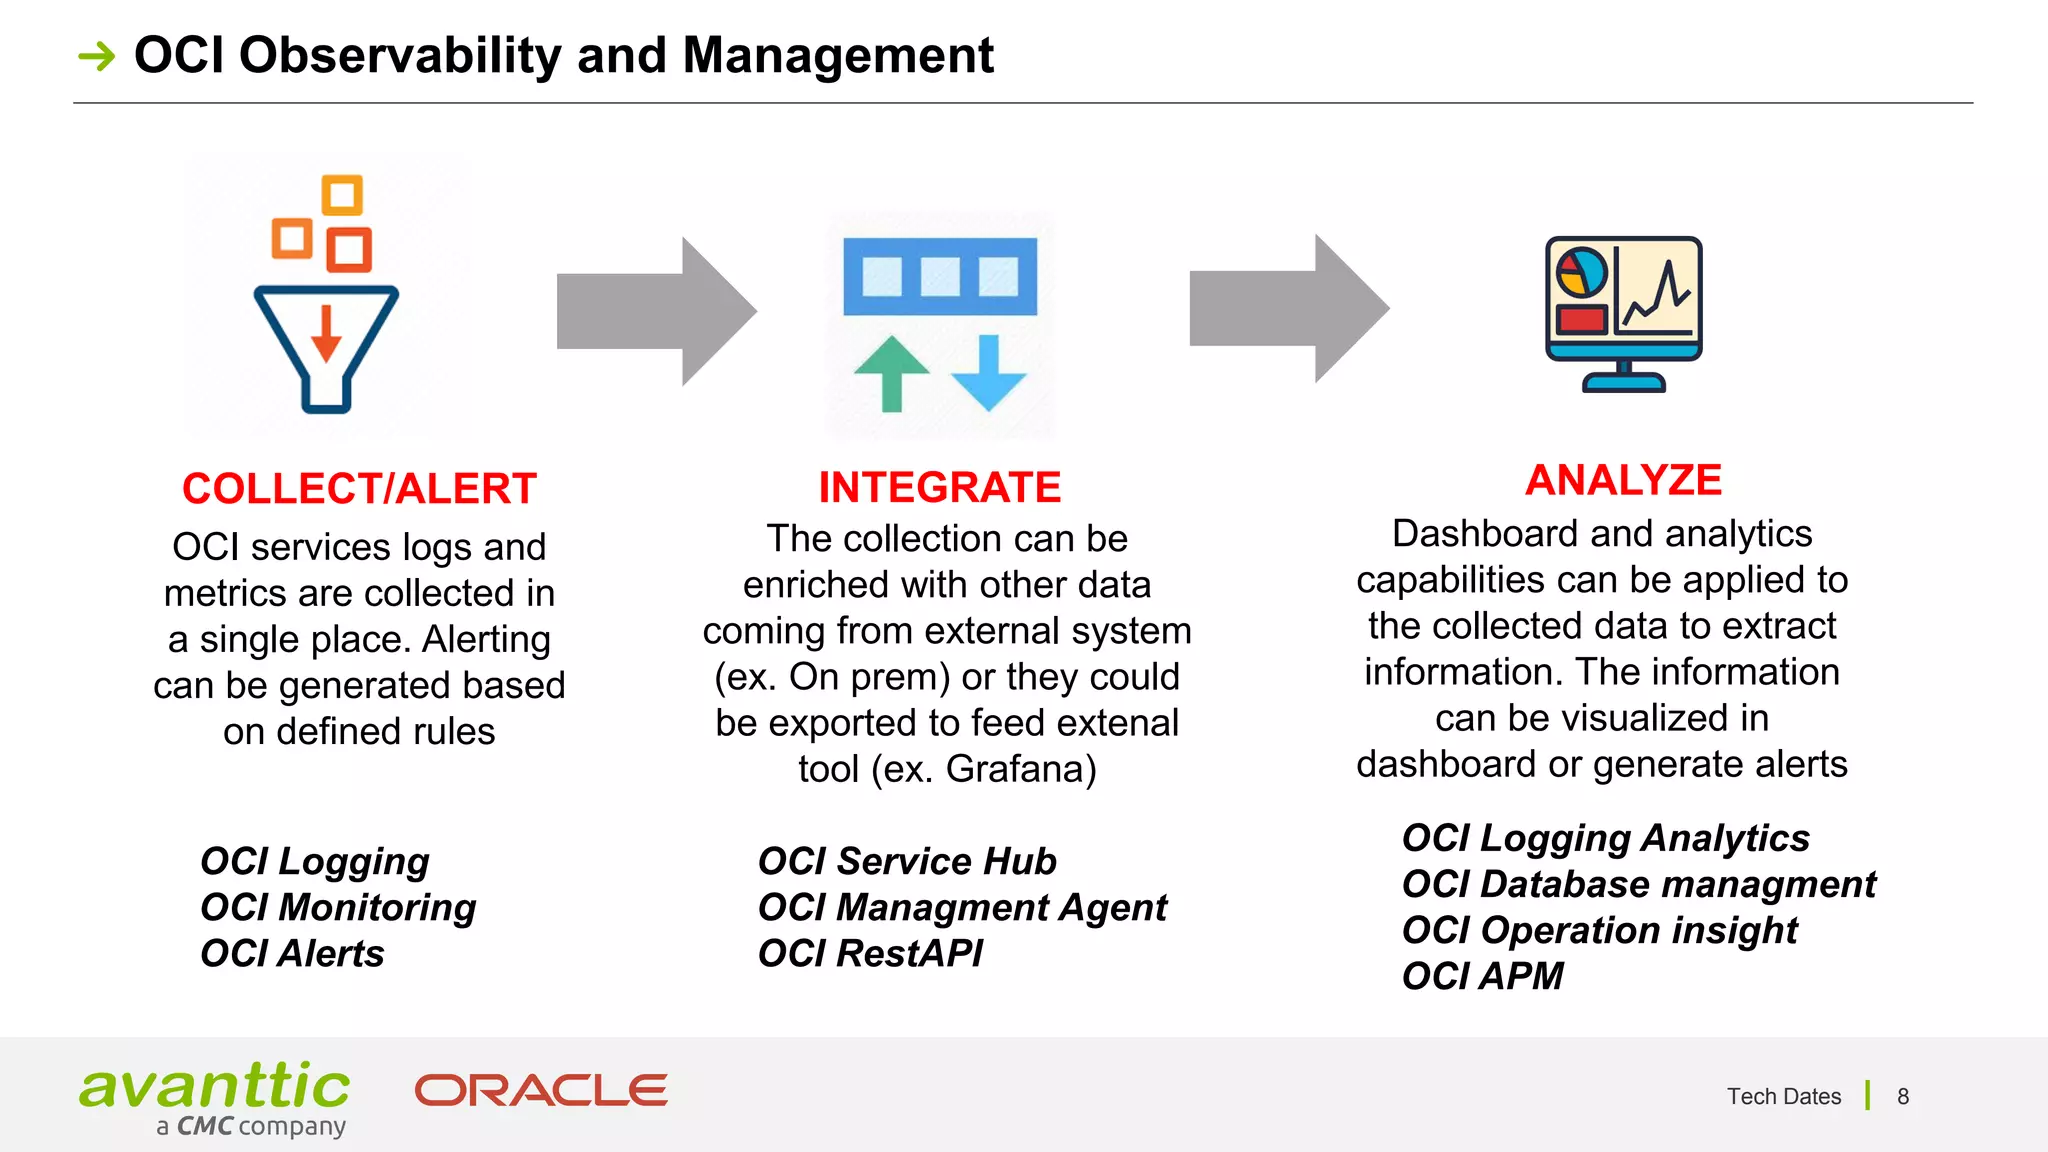
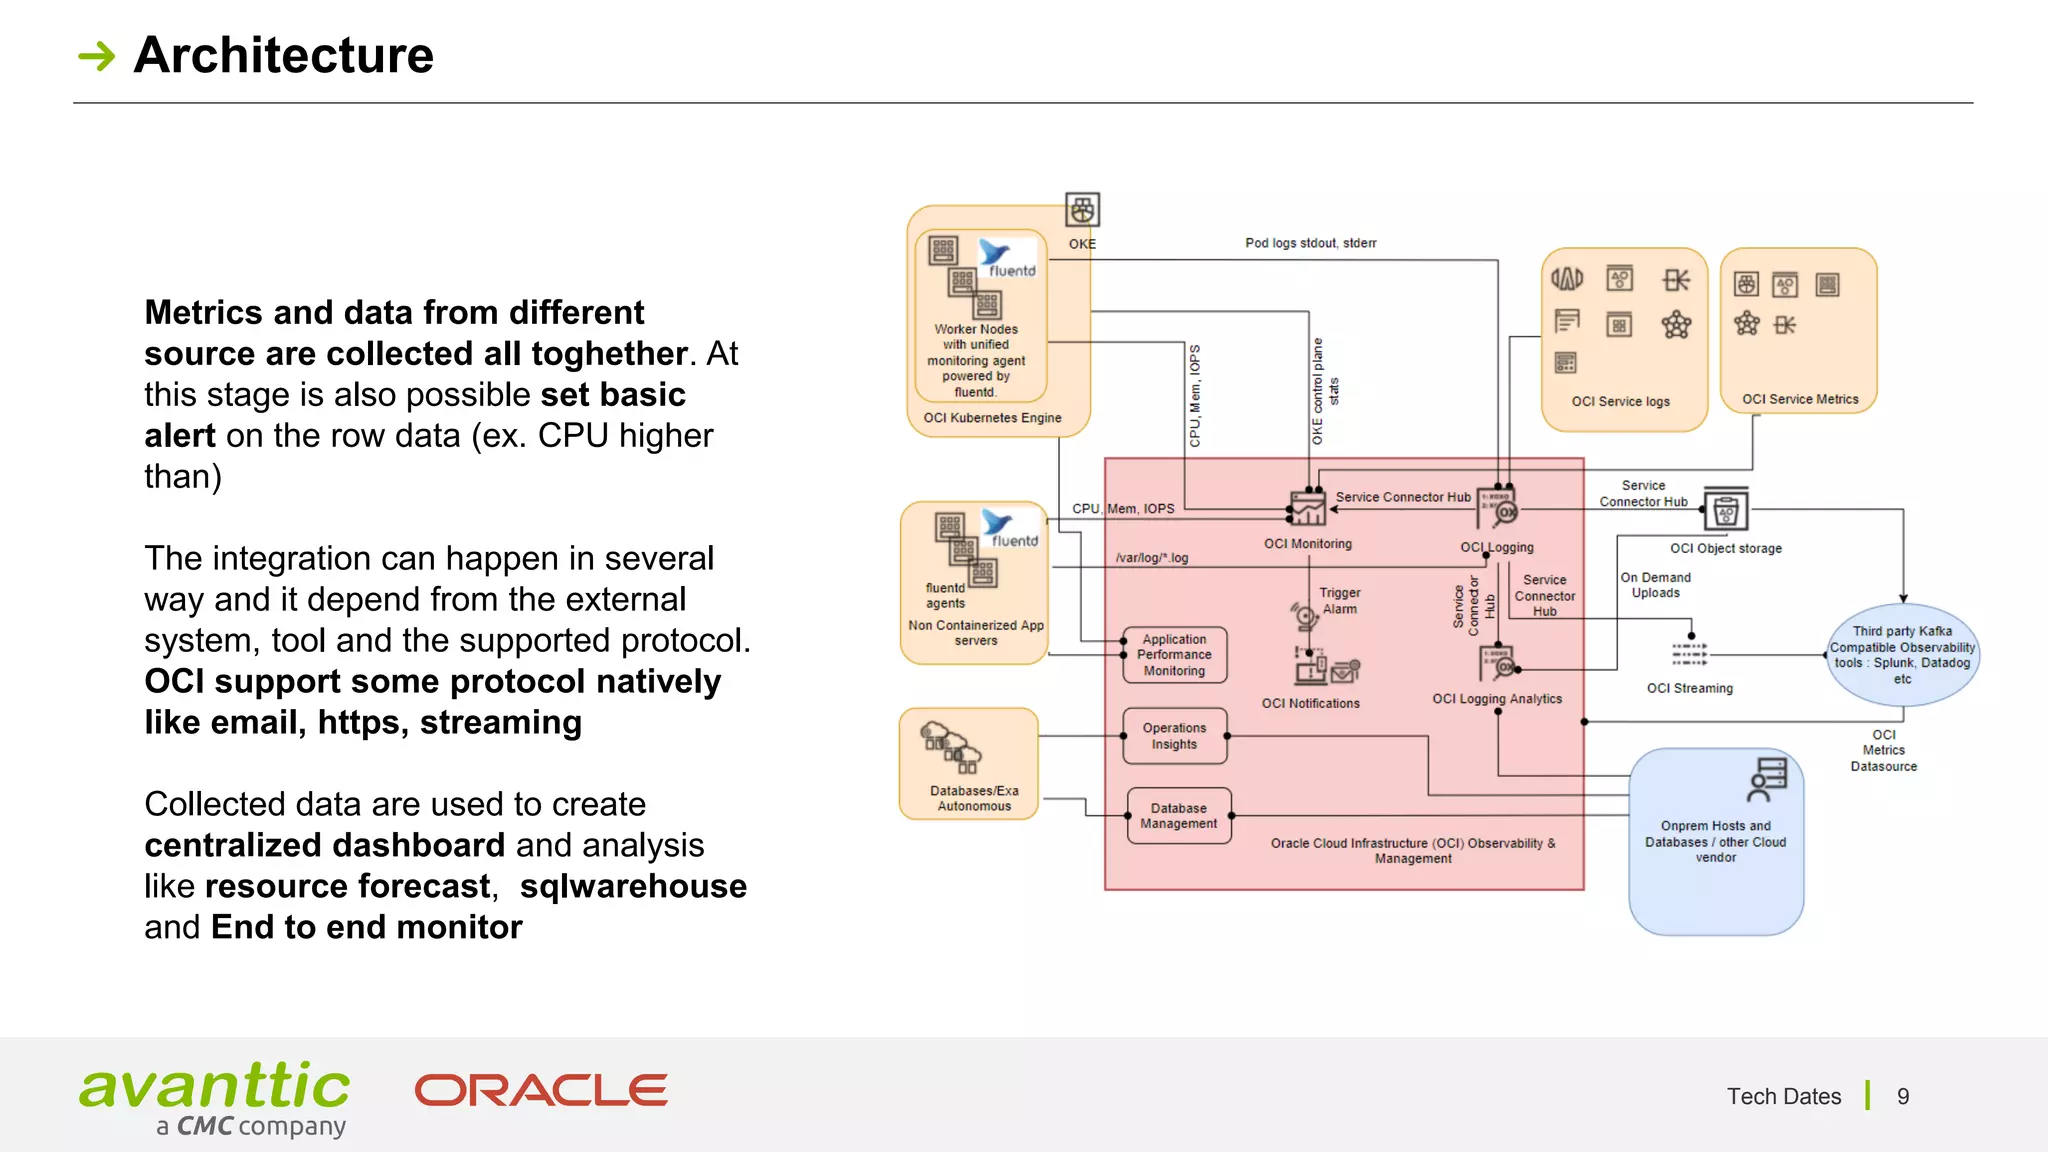
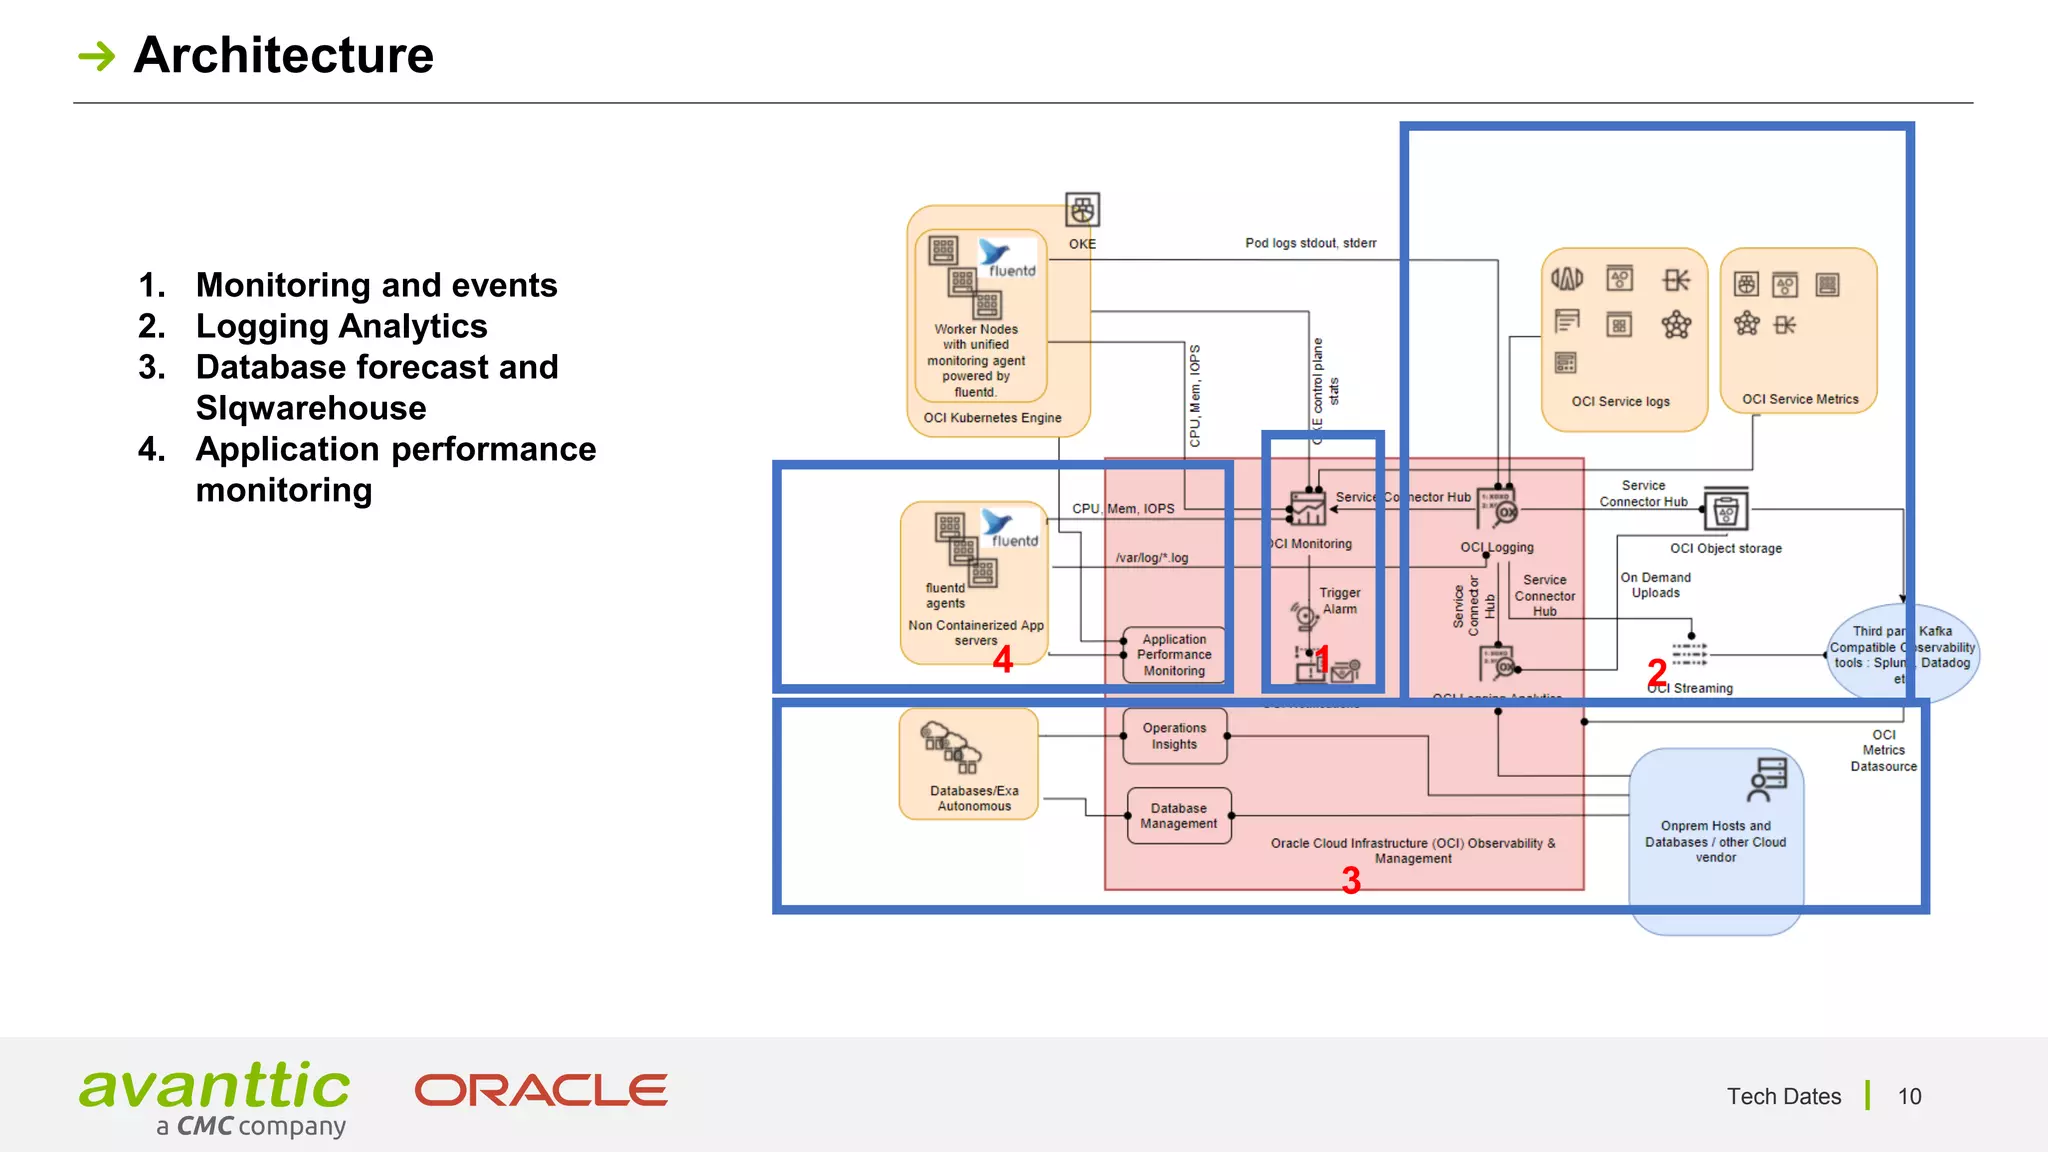
The document outlines Oracle's Cloud Observability and Management platform, emphasizing its capabilities in monitoring, logging, and analytics across cloud and on-premise environments. It details best practices for observability, integration of various data metrics, and advanced features for application performance monitoring. The platform supports comprehensive operational insights, enabling organizations to optimize their systems, enhance resource management, and improve overall performance.


![Coded Agents – with UiPath SDK + LangGraph [Virtual Hands-on Workshop]](https://cdn.slidesharecdn.com/ss_thumbnails/codedagentsdeck-251215155422-5497c599-thumbnail.jpg?width=640&height=640&fit=bounds)


