SlideShare a Scribd company logo
1 of 24
Assignment
Marginal Revenue Product
Marginal revenue product is defined as the change in total
revenue that results from the employment of an additional unit
of a resource. A producer wishes to determine how the addition
of pounds of plastic will affect its MRP and profits. See the
table below, and answer each of the questions.
Pounds of plastic (quantity of resource)
Number of assemblies (total product)
Price of assemblies ($)
0
0
-
1
15
13
2
30
11
3
40
9
4
55
7
5
58
5
a. The marginal product of the 3rd pound of plastic is
________.
b. The marginal revenue product of the 3rd pound of plastic is
______.
c. The price of plastic is $135 per pound. To maximize profit,
the producer should produce
__________________.
d. The price of plastic is $135 per pound. To maximize profit,
the producer should buy and use:
________________.
Grading Criteria Assignments
Maximum Points
Meets or exceeds established assignment criteria
40
Demonstrates an understanding of lesson concepts
20
Clearly presents well-reasoned ideas and concepts
30
Uses proper mechanics, punctuation, sentence structure, and
spelling
10
Total
100
Case Study
C&MDS, Inc.
Some time ago, at the beginning of 2010, an entrepreneur named
Richard Alestar started a small business as a sole proprietor in
Oregon - a business that manufactured sensors for cameras that
could be used in motion detection systems. The business was
very successful and he decided to incorporate in the latter part
of 2011 under the name C&MDS, Incorporated. He wanted to
name it Camera and Motion Detection Systems, but his
marketing manager convinced him it was too difficult to
remember. Alestar’s long-term plan was to obtain public
funding to support growth anticipated in about 4-6 years. In the
meantime, he hired electrical engineers and a solid management
team capable of building an organization that would enable the
company to eventually go public. He thought his proprietary
sensors and equipment could not be duplicated for a number of
years. There was only one competitor in the market niche where
he competed that had a significant market share, but they were a
follower, not a leader. Besides, he planned to grow the market
himself, based on the increased focus and attention in the public
arena on crime prevention, detection and surveillance using
cameras with his sensors. He also was developing a host of
other potential applications.
Alestar had developed a good relationship with his investment
banker Sophia Pound, and had just begun discussions with
respect to obtaining additional capital required to position the
company to go public. These discussions also involved the chief
financial officer (CFO), Mitch O. Dinero, who had brought up
the issue of the appropriate capital structure (target capital
structure) that C&MDS should consider. They both thought the
current mix in the capital structure was close to optimal, and
that only minor changes would be necessary. However, they
would defer to the investment banker before they made any final
decisions, and there were several tasks to be done before talking
to her.
The initial work involved determining the firm’s cost of capital,
and they would use the current balance sheet presented in
Figure 1 to assess the weights of each of the capital
components. Given that they were very close to the target
capital structure, the difficult task would involve determining
the appropriate cost to assign to each of the elements in the
capital structure – debt, preferred stock, and common equity.
And they thought the starting point was to gather data about the
historical cost for issuing debt and preferred stock. That
information is provided in Figure 2.
Figure 1
C&MDS Inc.
Statement of Financial Position: Balance Sheet
December 31, 2015
Assets
Current assets:
Cash
$ 500,000
Marketable securities
100,000
Accounts receivable
$ 2,450,000
Less: Allowance for bad debts
250,000
2,200,000
Inventory
5,400,000
Total current assets
$ 8,200,000
Fixed assets:
Plant and equipment, original cost
$ 31,300,000
Less: Accumulated depreciation
13,100,000
Net plant and equipment
18,200,000
Total assets
$ 26,400,000
Liabilities and Owners’ Equity
Current liabilities:
Accounts payable
$ 5,800,000
Accrued expenses
1,850,000
Total current liabilities
$ 7,650,000
Long-term financing
Bonds payable
$ 6,250,000
Preferred stock
1,120,000
Common stock
Retained earnings
{ Common equity
6,230,000
5,150,000
Total common equity
11,380,000
Total long-term financing
18,750,000
Total liabilities and owners’ equity
$ 26,400,000
Although they felt they were making real progress in
determining the cost of capital for the firm, they were not
confident about component costs that they had identified and
decided a call to Sophia was in order to make sure they were on
the right track, and they set up a conference call for the
following day. During the conference call with her, they
explained what had been accomplished and raised the issue
about historical costs for each of the elements in the capital
structure. She voiced a concern about using historical costs that
were somewhat dated. She reported that she knew of a
comparable firm in the industry (that needed to remain
unnamed), in terms of size and bond rating (Baa), that had
issued bonds less than a year ago at a coupon rate of 8.7% at
$1000 par value, and further reported that the bonds were
currently selling for $930 and had 20 years remaining to their
maturity date. This firm more recently had issued preferred
stock for $60 per share, and was paying a $4.50 dividend. She
also indicated that underwriting a new issue of preferred stock
would cost $2.25 per share (underwriting fee or flotation cost).
Figure 2Historical issue cost of debt and preferred stock
Security
Year of Issue
Amount
Yield
Bond
2012
$ 1,250,000
6.1%
Bond
2012
2,800,000
13.8%
Bond
2015
2,200,000
8.3%
Preferred stock
2011
595,000
12.0%
Preferred stock
2014
525,000
7.9%
After finishing the discussion about debt and preferred stock,
their attention naturally progressed to the question about how to
determine the cost of common equity. The CFO suggested that
one approach would be to use the dividend valuation model. In
reviewing the financial statements, he noted that earnings were
$3.00 a share (EPS) and 40% of the earnings will be paid out in
dividends (D1). Sophia also noted the dividends during the last
four years had grown from $.85 per share to the current level,
and the stock price was now (P0) $25 per share. She estimated
the flotation costs for newly issued common stock would be
$2.00 per share. Alestar and the CFO thanked her for the
information and the assistance and told her they would get back
with her after they had completed the preliminary calculations.
There were several other factors that needed to be considered,
and they relate to the following discussions:
· Whether to use the historical weights for the capital structure
components, or try to estimate or compute new market weights.
· Should they use an estimated growth rate, compute the simple
average growth rate, or use time value of money (TVM)
concepts to determine a more accurate growth rate to use in cost
of common equity calculations (dividend valuation model)?
You have been chosen to assist the CFO in the analysis.
Furthermore, several questions have been developed to help
guide you, and they are listed below. However, there may be
other issues that they have not thought of and that they want
you to identify and address.
Case Questions (show all of your work)
1. Determine the weights of each component in the capital
structure: Use the amount of retained earnings provided. The
percentage composition (weights) in the capital structure for
bonds, preferred stock, and common equity should be based on
the current capital structure long-term financing section as
shown in Figure 1 (indicated as $18.75 million). Common
equity will remain at the current weight throughout the case,
and the combined tax rate is 35%.
2. Determine the cost for each component in the capital
structure (after-tax cost of debt, cost of preferred stock, cost of
equity). Use your calculator to solve for the interest rate (I).
3. Given your results from questions 1 and 2 above, calculate
the weighted average cost of capital (WACC).
4. Now assume that new common stock will be used in the
capital structure (you will obtain new common stock with
flotation costs). Also assume all the weights remain the same;
common equity is now supplied by new common stock, rather
than by retained earnings (debt and preferred stock costs remain
the same).
Recalculate the weighted average cost using new common stock
in the capital structure. Remember to consider flotation costs.
5. The increase in the cost of capital will take place at a certain
level of financing, where the cost of financing increases (known
as the marginal cost of capital):
What is this level of financing (dollar amount)? Determine this
by dividing retained earnings by the percent of common equity
in the capital structure (as noted in Question 1).
6. You have been told that the investment banker wishes to use
the capital asset pricing model (CAPM, as shown on p. 388 in
the 15th edition of the text), to compute the cost (required
return) on common stock. Assume the risk free rate (rRF) is
4.9%, beta for the firm is 1.30, and the market risk premium
(RPM) is 6.8%.
a. What is required rate of return for common equity using this
method?
b. Secondly, how does it compare to the required rate of return
computed in Question 1 above?
Rev. Dec 2017 Ver. A ©
Example of Case Study Write-upCase Study: Gilbert
Enterprises
Submitted by: James Bunsa
For: FINC 5880
Date: 11 Apr 2014
a. Current Situation
Company
I
nformationGilbert Enterprises, the third largest publicly traded
firm in the auto parts replacement industry, had experienced a
decline in its stock price over the past five months. Its founder
and chairman, Tom Gilbert, along with the Finance VP, were
considering a stock repurchase, thinking the announcement
would send a message to investors about the current market
undervaluation of the stock.
Industry and Economic InformationResearch had indicated that
auto owners were keeping their vehicles longer (8 years on
average, up from 6.8 years twenty years earlier), and new
vehicle price increases had surpassed the rise in consumer
incomes. The trend of investing in older vehicles to keep them
on the road longer would bode well for Gilbert. In addition,
Gilbert had invested in an industry-leading JIT inventory
management system and as a result expected supernormal
growth over the next several years.
b. Major Issues
Several significant issues that Gilbert faces include:
·
Develop these issues preliminarily, and readdress/refine them
after answering the case-specific questionsDoes the growth rate
seem reasonable, given the current and expected circumstances
(economic and industry)?
· Does the current stock price fairly represent Gilbert’s value in
the market?
· What is the “real” value of Gilbert’s stock? And how should it
be determined (methods, process)?
· What other data should be considered in the valuation?
· What decision should they make – repurchase stock or do
something else?
· What are the possible investor and market reactions to an
announcement?
· Other issues ….
c. Approach
Identify the appropriate analytical techniques (dividend
valuation model) to evaluate Gilbert’s value in the market; use a
price-earnings approach to supplement the dividend model
results; and use selected ratio comparative analysis to fairly
position Gilbert against its competitors; and specifically answer
the case questions.
d. Case-specific Questions
1. Supernormal growth valuation – does the firm seem
to be under or overvalued?
Three steps to find intrinsic value, and then compare
to market.
· Find present value of supernormal dividends
Discount future supernormal dividends back to present at 10%
(required rate of return)
Current dividend
D0 =
(given)
1.20
Future dividends
D1 =
(D0 * 1.15)
1.38
X
0.9091
1.25
D2 =
(D1 * 1.15)
1.59
X
0.8264
1.31
D3 =
(D2 * 1.15)
1.83
X
0.7513
1.37
Total
3.94
Present value of dividends during the supernormal growth
period =
3.94
These are calculations to answer the questions
· Find the present value of the future stock price
Find PV of future stock price
P3 = stock price when supernormal growth ends
D4 = dividend at time 4 when constant growth is 6%
Ke = required rate of return (cost of equity = 10 percent
10%
g = 6 percent (constant growth)
6%
P3 =
D4
Ke - g
D4 = D3 (1 + g)
=
1.935
P3 =
48.363825
Must discount stock price back to current - find PV
at 10%
Est of P0
$36.34
· Find total value (stock price plus value of dividends)
Add price of stock and value of dividends to get total value
Estimate of P0 =
$36.34
If rounding earlier in the problem
Add PV of dividends =
3.94
total is as high as $40.37
Total
$40.27
Conclusion: Because the stock is selling in the market
for 35 1/4th, it appears to be undervalued.
2. Gilbert’s P/E ratio is currently is the second lowest of
all firms in the industry. However, based on the
financial information provided in Figure 1 this does not
appear to be appropriate, given that Gilbert currently has
the highest growth rate of EPS and growth is expected to
accelerate to 15% (supernormal) growth over the
next three years.
This is financial
ratio
a
nalysisIt also has the second highest return on stockholder’s
equity, and the firm leading this category has a very high debt
ratio (resulting in a relatively smaller proportion of equity over
which to spread the earnings – it is possible to generate a high
return on equity using debt, but still have relatively low
profitability, as Reliance has in this case as indicated by its
lowest return on total assets ratio in the industry).
In evaluation debt utilization as a separate issue, Gilbert once
again looks attractive with a debt to total asset ratio of 33%,
with Standard Auto being the only firm with a better (lower)
ratio.
Market Values
Market
Book
Replacement
Market
Market to
Value
Value
Value
to Book
Replacement
Gilbert Enterprises
35.25
16.40
43.50
2.15
0.81
Relaince Parts
70.50
50.25
68.75
1.40
1.03
Standard Auto
24.25
19.50
26.00
1.24
0.93
Allied Motors
46.75
50.75
27.50
0.92
1.70
Evaluation of market to book values and market to replacement
values will provide additional insight about Gilbert’s financial
position in the industry. Although pro forma market value to
book value ($40.27/$16.40 = 2.46) is high compared to others
(1.40 to .92), this is not an especially meaningful value, because
book value is based on historical cost. A more meaningful value
is market to replacement, in which Gilbert is much more
conservative ($40.27/$43.50 = .93), and is comparable to
Standard Auto ($24.25/$26.00 = .93).
Dividends are another area where Gilbert is excelling, second
only to Standard in dividend yields.
Finally, how would Gilbert’s pro forma P/E ratio compare with
the industry? One must first calculate the EPS, since it is not
provided.
P/E = Stock Price/EPS
16.8 = $35.25/EPS
EPS = $35.25/16.8 = $2.098 per share
Now, calculate the pro forma P/E ratio given the estimate of the
intrinsic stock price of $40.27 in the earlier analysis.
P/Epf = $40.27/$2.098 = 19.2, still within the appropriate
range for the industry (industry average is now 18.9).
In summary, Gilbert appears to be undervalued compared to its
competition, considering all of the findings previously reported.
3. Recommendations to Albert Roth:
Based on the answers to Questions 1 and 2, Gilbert Enterprises
appears to be undervalued, and Roth should seriously consider
recommending the firm repurchase part of its shares in the
marketplace. However, there is reason to be cautious:
·
Be creative here; you get credit for thinking outside the box
(but not too far out)Markets are efficient in their pricing of
securities (Efficient Market Hypothesis), and there may be some
information that we are not aware of that justifies Gilbert’s
lower valuation.
· Secondly, even if the stock is undervalued in the marketplace,
management must make certain that this is the best use of its
limited investment funds (examine alternative uses).
e. Other options?
Although there are no indications in the case that Gilbert has
alternatives to this repurchase plan, it should exhaust the
possibilities of purchasing another firm or firms in the industry
that might provide positive synergies, add sales in areas that
Gilbert is lacking, cover geographic areas currently
underserved, or focus on a firm that provides a good “fit” with
its state-of-the-art inventory management systems.
As an alternative, it could significantly reduce the number of
shares it in considering (up to one million shares), and use the
remainder for other investments.
f. Prediction
I believe that Albert Roth will recommend the repurchase, and
that it will be successful. After all, Roth in an investment
banker and is there to serve his client while earning profits from
additional revenue for his firm – Baker, Green and Roth.
Rev. Jan 2017
Circular Flow of Economic Activity
Using the Circular Flow of Economic Activity model, we can
determine how an economic system works to allocate scarce
resources. Households, who own factors of productive resources
like land, labor, and capital, are used by firms to produce goods
and services which households need and desire.
For the use of the factor resources, firms pay households
income, wages, rent, and interest, which households use to
purchase those goods and services.
But how do households and firms in resource markets determine
the proper allocation and price for those productive resources?
Demand for resources is derived demand. Demand is derived
according to the demand for the end product. The demand curve
(demand for a productive resource) will be downward sloping
and negatively sloped. A change in demand for the end product
will lead to a change in demand for a productive resource.
With respect to the price elasticity of demand for a productive
resource, the greater the number of substitutes and
complements, the higher the price elasticity will be for the
productive resource. Thus, the slope will be lower when the
demand for a productive resource is more price elastic.
Firms use productive resources to produce goods and services.
Output is the result of using productive resources. In
economics, we differentiate and define output according to the
following:
Total Product (TP): Total output produced from an input
resource.
Average Product (AP): Average output produced per input
resources. AP = TP / (# of units of input)
Marginal Product (MP): Change in total product when one more
unit of input resources is used. MP = (change in TP) / (change
in units of input)
Margin Revenue Product (MRP): Change in total revenue when
one more unit of input resources is used. MRP = (change in TR)
/ (change in units of input)
Value Marginal Product (VMP): Value of the marginal product
of labor the next unit of input resource brings to the firm. VMP
= MP X selling price
In product markets, we know that firms - all firms - produce
optimal output at the point where marginal revenues
equal marginal costs. But in productive resource markets, at
what point will a firm find equilibrium and optimal marginal
resourcing?
Marginal revenue product (MRP) equals marginal resource cost
(MRC), or MRP=MRC. In aggregate resource markets, demand
for labor and supply of labor converge to an equilibrium point
for price and quantity. For individual firms, the demand for
labor (MRP) will be a downward-sloping curve, indicating that
as quantity demanded for a resource rises when the price of
labor falls. The MRC will entail how much a firm pays to secure
one more unit of a productive resource.
Labor Curve
What causes a differential between the wages of one type of job
versus another?
· Between skilled and non-skilled?
· Can price floors or minimum wages be instituted to benefit
low-wage earners to lift them up and reduce poverty?
· Are there negative effects of minimum wages?
· How technology play a part in all of this?
When we analyze how productive resource markets operate, we
are more equipped to answer those questions.
· For example, individuals are different, and they have different
sets of skills and motivations.
· Jobs are different and are not all the same.
· Higher paying jobs tend to require higher productive and
skilled individuals.
· There is a separate demand for labor skilled curve and demand
for labor unskilled curve; there is a separate supply of labor
skilled curve, as well as a separate unskilled labor supply curve.
The demand for labor skilled curve and demand for labor
unskilled curve are parallel, with the demand for labor skilled
farther rightward than unskilled.
As for the supply side, the supply of labor skilled curve and
supply of labor unskilled curve are also parallel, with the
supply of labor skilled farther leftward than unskilled.
How do we read that, and what are the implications? When you
put the four curves together, what is ascertained is the gap
between the demand curves is the marginal product difference,
or the additional total product attained by adding one more unit
of skilled labor; the gap between the supply curves indicates
skilled labor is more costly and is less plentiful as unskilled.
Ultimately, what is ascertained about the price of labor is the
gap between the equilibrium points of the demand for labor
unskilled and supply of labor unskilled versus the equilibrium
points of the demand for labor skilled and supply of labor
skilled is the wage difference (or otherwise known as the "wage
gap").
Can this wage gap be closed a bit to offer better pay conditions
for a low-wage earner? What, if any, are the negative aspects of
a minimum wage?
A minimum wage, which is a price floor set by firms or
government, is the price that is the least a firm can pay for use
of a labor resource. The price is set above the equilibrium price
where the demand for labor and supply of labor meet.
The Law of demand and Law of supply come into play. At the
higher price, quantity demanded is less, while quantity supplied
is higher. Since quantity demanded is less than quantity
supplied, surpluses ensue. More productive resources are
available to be hired, while fewer buyers of productive
resources exist. Increases in unemployment can occur from this
imposed price floor.
Can technology actually lead to higher productivity and even
wider gaps between skilled and unskilled. Yes for both. The
aggregate production function curve represents how
productivity depends upon the physical capital per worker,
human capital per worker, and relative technology.
· As newer and better technology is used, productive resources
tend to achieve exponentially higher productive levels relative
to older and less advanced technology.
As workers who achieve higher levels of skill and utilize
technology to increase efficiency and productivity increase
when unskilled workers do not, the wage gap and demand for
supply of unskilled labor widens.

More Related Content

Similar to AssignmentMarginal Revenue ProductMarginal revenue product i.docx

Acct 504 final exam (3 different finals) (devry)
Acct 504 final exam (3 different finals) (devry)Acct 504 final exam (3 different finals) (devry)
Acct 504 final exam (3 different finals) (devry)slicespiece
 
237367257 question-case-study-3
237367257 question-case-study-3237367257 question-case-study-3
237367257 question-case-study-3homeworkping3
 
Fin 534 financial management – fin534 homework
Fin 534 financial management – fin534 homeworkFin 534 financial management – fin534 homework
Fin 534 financial management – fin534 homeworkHomework Help Online
 
7.12Chapter 7 Problem 12a). Complete the spreadsheet below by esti.docx
7.12Chapter 7 Problem 12a). Complete the spreadsheet below by esti.docx7.12Chapter 7 Problem 12a). Complete the spreadsheet below by esti.docx
7.12Chapter 7 Problem 12a). Complete the spreadsheet below by esti.docxalinainglis
 
Mini Case112018Chapter 2 Mini CaseSituationJenny Cochran, a grad.docx
Mini Case112018Chapter 2 Mini CaseSituationJenny Cochran, a grad.docxMini Case112018Chapter 2 Mini CaseSituationJenny Cochran, a grad.docx
Mini Case112018Chapter 2 Mini CaseSituationJenny Cochran, a grad.docxpauline234567
 

Similar to AssignmentMarginal Revenue ProductMarginal revenue product i.docx (7)

Acct 504 final exam (3 different finals) (devry)
Acct 504 final exam (3 different finals) (devry)Acct 504 final exam (3 different finals) (devry)
Acct 504 final exam (3 different finals) (devry)
 
Finance homework help
Finance homework helpFinance homework help
Finance homework help
 
237367257 question-case-study-3
237367257 question-case-study-3237367257 question-case-study-3
237367257 question-case-study-3
 
Bus 401 week 3 quiz version c
Bus 401 week 3 quiz version cBus 401 week 3 quiz version c
Bus 401 week 3 quiz version c
 
Fin 534 financial management – fin534 homework
Fin 534 financial management – fin534 homeworkFin 534 financial management – fin534 homework
Fin 534 financial management – fin534 homework
 
7.12Chapter 7 Problem 12a). Complete the spreadsheet below by esti.docx
7.12Chapter 7 Problem 12a). Complete the spreadsheet below by esti.docx7.12Chapter 7 Problem 12a). Complete the spreadsheet below by esti.docx
7.12Chapter 7 Problem 12a). Complete the spreadsheet below by esti.docx
 
Mini Case112018Chapter 2 Mini CaseSituationJenny Cochran, a grad.docx
Mini Case112018Chapter 2 Mini CaseSituationJenny Cochran, a grad.docxMini Case112018Chapter 2 Mini CaseSituationJenny Cochran, a grad.docx
Mini Case112018Chapter 2 Mini CaseSituationJenny Cochran, a grad.docx
 

More from rock73

In a two- to three-page paper (excluding the title and reference pag.docx
In a two- to three-page paper (excluding the title and reference pag.docxIn a two- to three-page paper (excluding the title and reference pag.docx
In a two- to three-page paper (excluding the title and reference pag.docxrock73
 
In a substantial paragraph respond to either one of the following qu.docx
In a substantial paragraph respond to either one of the following qu.docxIn a substantial paragraph respond to either one of the following qu.docx
In a substantial paragraph respond to either one of the following qu.docxrock73
 
In a study by Dr. Sandra Levitsky, she considers why the economic,.docx
In a study by Dr. Sandra Levitsky, she considers why the economic,.docxIn a study by Dr. Sandra Levitsky, she considers why the economic,.docx
In a study by Dr. Sandra Levitsky, she considers why the economic,.docxrock73
 
In a response of at least two paragraphs, provide an explanation o.docx
In a response of at least two paragraphs, provide an explanation o.docxIn a response of at least two paragraphs, provide an explanation o.docx
In a response of at least two paragraphs, provide an explanation o.docxrock73
 
in a minimum of 1000 words, describe why baseball is Americas past .docx
in a minimum of 1000 words, describe why baseball is Americas past .docxin a minimum of 1000 words, describe why baseball is Americas past .docx
in a minimum of 1000 words, describe why baseball is Americas past .docxrock73
 
In a minimum 200 word response, describe some ways how the public .docx
In a minimum 200 word response, describe some ways how the public .docxIn a minimum 200 word response, describe some ways how the public .docx
In a minimum 200 word response, describe some ways how the public .docxrock73
 
In a weekly coordination meeting, several senior investigators from .docx
In a weekly coordination meeting, several senior investigators from .docxIn a weekly coordination meeting, several senior investigators from .docx
In a weekly coordination meeting, several senior investigators from .docxrock73
 
In a memo, describe 1) the form and style of art as well as 2) the e.docx
In a memo, describe 1) the form and style of art as well as 2) the e.docxIn a memo, describe 1) the form and style of art as well as 2) the e.docx
In a memo, describe 1) the form and style of art as well as 2) the e.docxrock73
 
In a minimum 200 word response explain the problems that law enforce.docx
In a minimum 200 word response explain the problems that law enforce.docxIn a minimum 200 word response explain the problems that law enforce.docx
In a minimum 200 word response explain the problems that law enforce.docxrock73
 
In a minimum 200 word response explain some of the reasons why, in.docx
In a minimum 200 word response explain some of the reasons why, in.docxIn a minimum 200 word response explain some of the reasons why, in.docx
In a minimum 200 word response explain some of the reasons why, in.docxrock73
 
In a maximum of 750 words, you are required to1. Summarize the ar.docx
In a maximum of 750 words, you are required to1. Summarize the ar.docxIn a maximum of 750 words, you are required to1. Summarize the ar.docx
In a maximum of 750 words, you are required to1. Summarize the ar.docxrock73
 
in a two- to- three page paper (not including the title and referenc.docx
in a two- to- three page paper (not including the title and referenc.docxin a two- to- three page paper (not including the title and referenc.docx
in a two- to- three page paper (not including the title and referenc.docxrock73
 
In a two- to three-page paper (not including the title and reference.docx
In a two- to three-page paper (not including the title and reference.docxIn a two- to three-page paper (not including the title and reference.docx
In a two- to three-page paper (not including the title and reference.docxrock73
 
In a group, take a look at the two student essays included in this f.docx
In a group, take a look at the two student essays included in this f.docxIn a group, take a look at the two student essays included in this f.docx
In a group, take a look at the two student essays included in this f.docxrock73
 
BASEBALLRuns Scored (X)Wins (Y)70869875906547970480787957307166786.docx
BASEBALLRuns Scored (X)Wins (Y)70869875906547970480787957307166786.docxBASEBALLRuns Scored (X)Wins (Y)70869875906547970480787957307166786.docx
BASEBALLRuns Scored (X)Wins (Y)70869875906547970480787957307166786.docxrock73
 
Based on Santa Clara University Ethics DialogueEthics .docx
Based on Santa Clara University Ethics DialogueEthics .docxBased on Santa Clara University Ethics DialogueEthics .docx
Based on Santa Clara University Ethics DialogueEthics .docxrock73
 
Barbara Corcoran Learns Her Heart’s True Desires In her.docx
Barbara Corcoran Learns Her Heart’s True Desires  In her.docxBarbara Corcoran Learns Her Heart’s True Desires  In her.docx
Barbara Corcoran Learns Her Heart’s True Desires In her.docxrock73
 
Bapsi Sidhwa’s Cracking India1947 PartitionDeepa Meh.docx
Bapsi Sidhwa’s Cracking India1947 PartitionDeepa Meh.docxBapsi Sidhwa’s Cracking India1947 PartitionDeepa Meh.docx
Bapsi Sidhwa’s Cracking India1947 PartitionDeepa Meh.docxrock73
 
Barriers of therapeutic relationshipThe therapeutic relations.docx
Barriers of therapeutic relationshipThe therapeutic relations.docxBarriers of therapeutic relationshipThe therapeutic relations.docx
Barriers of therapeutic relationshipThe therapeutic relations.docxrock73
 
Barada 2Mohamad BaradaProfessor Andrew DurdinReligions of .docx
Barada 2Mohamad BaradaProfessor Andrew DurdinReligions of .docxBarada 2Mohamad BaradaProfessor Andrew DurdinReligions of .docx
Barada 2Mohamad BaradaProfessor Andrew DurdinReligions of .docxrock73
 

More from rock73 (20)

In a two- to three-page paper (excluding the title and reference pag.docx
In a two- to three-page paper (excluding the title and reference pag.docxIn a two- to three-page paper (excluding the title and reference pag.docx
In a two- to three-page paper (excluding the title and reference pag.docx
 
In a substantial paragraph respond to either one of the following qu.docx
In a substantial paragraph respond to either one of the following qu.docxIn a substantial paragraph respond to either one of the following qu.docx
In a substantial paragraph respond to either one of the following qu.docx
 
In a study by Dr. Sandra Levitsky, she considers why the economic,.docx
In a study by Dr. Sandra Levitsky, she considers why the economic,.docxIn a study by Dr. Sandra Levitsky, she considers why the economic,.docx
In a study by Dr. Sandra Levitsky, she considers why the economic,.docx
 
In a response of at least two paragraphs, provide an explanation o.docx
In a response of at least two paragraphs, provide an explanation o.docxIn a response of at least two paragraphs, provide an explanation o.docx
In a response of at least two paragraphs, provide an explanation o.docx
 
in a minimum of 1000 words, describe why baseball is Americas past .docx
in a minimum of 1000 words, describe why baseball is Americas past .docxin a minimum of 1000 words, describe why baseball is Americas past .docx
in a minimum of 1000 words, describe why baseball is Americas past .docx
 
In a minimum 200 word response, describe some ways how the public .docx
In a minimum 200 word response, describe some ways how the public .docxIn a minimum 200 word response, describe some ways how the public .docx
In a minimum 200 word response, describe some ways how the public .docx
 
In a weekly coordination meeting, several senior investigators from .docx
In a weekly coordination meeting, several senior investigators from .docxIn a weekly coordination meeting, several senior investigators from .docx
In a weekly coordination meeting, several senior investigators from .docx
 
In a memo, describe 1) the form and style of art as well as 2) the e.docx
In a memo, describe 1) the form and style of art as well as 2) the e.docxIn a memo, describe 1) the form and style of art as well as 2) the e.docx
In a memo, describe 1) the form and style of art as well as 2) the e.docx
 
In a minimum 200 word response explain the problems that law enforce.docx
In a minimum 200 word response explain the problems that law enforce.docxIn a minimum 200 word response explain the problems that law enforce.docx
In a minimum 200 word response explain the problems that law enforce.docx
 
In a minimum 200 word response explain some of the reasons why, in.docx
In a minimum 200 word response explain some of the reasons why, in.docxIn a minimum 200 word response explain some of the reasons why, in.docx
In a minimum 200 word response explain some of the reasons why, in.docx
 
In a maximum of 750 words, you are required to1. Summarize the ar.docx
In a maximum of 750 words, you are required to1. Summarize the ar.docxIn a maximum of 750 words, you are required to1. Summarize the ar.docx
In a maximum of 750 words, you are required to1. Summarize the ar.docx
 
in a two- to- three page paper (not including the title and referenc.docx
in a two- to- three page paper (not including the title and referenc.docxin a two- to- three page paper (not including the title and referenc.docx
in a two- to- three page paper (not including the title and referenc.docx
 
In a two- to three-page paper (not including the title and reference.docx
In a two- to three-page paper (not including the title and reference.docxIn a two- to three-page paper (not including the title and reference.docx
In a two- to three-page paper (not including the title and reference.docx
 
In a group, take a look at the two student essays included in this f.docx
In a group, take a look at the two student essays included in this f.docxIn a group, take a look at the two student essays included in this f.docx
In a group, take a look at the two student essays included in this f.docx
 
BASEBALLRuns Scored (X)Wins (Y)70869875906547970480787957307166786.docx
BASEBALLRuns Scored (X)Wins (Y)70869875906547970480787957307166786.docxBASEBALLRuns Scored (X)Wins (Y)70869875906547970480787957307166786.docx
BASEBALLRuns Scored (X)Wins (Y)70869875906547970480787957307166786.docx
 
Based on Santa Clara University Ethics DialogueEthics .docx
Based on Santa Clara University Ethics DialogueEthics .docxBased on Santa Clara University Ethics DialogueEthics .docx
Based on Santa Clara University Ethics DialogueEthics .docx
 
Barbara Corcoran Learns Her Heart’s True Desires In her.docx
Barbara Corcoran Learns Her Heart’s True Desires  In her.docxBarbara Corcoran Learns Her Heart’s True Desires  In her.docx
Barbara Corcoran Learns Her Heart’s True Desires In her.docx
 
Bapsi Sidhwa’s Cracking India1947 PartitionDeepa Meh.docx
Bapsi Sidhwa’s Cracking India1947 PartitionDeepa Meh.docxBapsi Sidhwa’s Cracking India1947 PartitionDeepa Meh.docx
Bapsi Sidhwa’s Cracking India1947 PartitionDeepa Meh.docx
 
Barriers of therapeutic relationshipThe therapeutic relations.docx
Barriers of therapeutic relationshipThe therapeutic relations.docxBarriers of therapeutic relationshipThe therapeutic relations.docx
Barriers of therapeutic relationshipThe therapeutic relations.docx
 
Barada 2Mohamad BaradaProfessor Andrew DurdinReligions of .docx
Barada 2Mohamad BaradaProfessor Andrew DurdinReligions of .docxBarada 2Mohamad BaradaProfessor Andrew DurdinReligions of .docx
Barada 2Mohamad BaradaProfessor Andrew DurdinReligions of .docx
 

Recently uploaded

BASLIQ CURRENT LOOKBOOK LOOKBOOK(1) (1).pdf
BASLIQ CURRENT LOOKBOOK  LOOKBOOK(1) (1).pdfBASLIQ CURRENT LOOKBOOK  LOOKBOOK(1) (1).pdf
BASLIQ CURRENT LOOKBOOK LOOKBOOK(1) (1).pdfSoniaTolstoy
 
Separation of Lanthanides/ Lanthanides and Actinides
Separation of Lanthanides/ Lanthanides and ActinidesSeparation of Lanthanides/ Lanthanides and Actinides
Separation of Lanthanides/ Lanthanides and ActinidesFatimaKhan178732
 
Kisan Call Centre - To harness potential of ICT in Agriculture by answer farm...
Kisan Call Centre - To harness potential of ICT in Agriculture by answer farm...Kisan Call Centre - To harness potential of ICT in Agriculture by answer farm...
Kisan Call Centre - To harness potential of ICT in Agriculture by answer farm...Krashi Coaching
 
Paris 2024 Olympic Geographies - an activity
Paris 2024 Olympic Geographies - an activityParis 2024 Olympic Geographies - an activity
Paris 2024 Olympic Geographies - an activityGeoBlogs
 
Software Engineering Methodologies (overview)
Software Engineering Methodologies (overview)Software Engineering Methodologies (overview)
Software Engineering Methodologies (overview)eniolaolutunde
 
Q4-W6-Restating Informational Text Grade 3
Q4-W6-Restating Informational Text Grade 3Q4-W6-Restating Informational Text Grade 3
Q4-W6-Restating Informational Text Grade 3JemimahLaneBuaron
 
Student login on Anyboli platform.helpin
Student login on Anyboli platform.helpinStudent login on Anyboli platform.helpin
Student login on Anyboli platform.helpinRaunakKeshri1
 
Beyond the EU: DORA and NIS 2 Directive's Global Impact
Beyond the EU: DORA and NIS 2 Directive's Global ImpactBeyond the EU: DORA and NIS 2 Directive's Global Impact
Beyond the EU: DORA and NIS 2 Directive's Global ImpactPECB
 
Arihant handbook biology for class 11 .pdf
Arihant handbook biology for class 11 .pdfArihant handbook biology for class 11 .pdf
Arihant handbook biology for class 11 .pdfchloefrazer622
 
Sanyam Choudhary Chemistry practical.pdf
Sanyam Choudhary Chemistry practical.pdfSanyam Choudhary Chemistry practical.pdf
Sanyam Choudhary Chemistry practical.pdfsanyamsingh5019
 
“Oh GOSH! Reflecting on Hackteria's Collaborative Practices in a Global Do-It...
“Oh GOSH! Reflecting on Hackteria's Collaborative Practices in a Global Do-It...“Oh GOSH! Reflecting on Hackteria's Collaborative Practices in a Global Do-It...
“Oh GOSH! Reflecting on Hackteria's Collaborative Practices in a Global Do-It...Marc Dusseiller Dusjagr
 
18-04-UA_REPORT_MEDIALITERAСY_INDEX-DM_23-1-final-eng.pdf
18-04-UA_REPORT_MEDIALITERAСY_INDEX-DM_23-1-final-eng.pdf18-04-UA_REPORT_MEDIALITERAСY_INDEX-DM_23-1-final-eng.pdf
18-04-UA_REPORT_MEDIALITERAСY_INDEX-DM_23-1-final-eng.pdfssuser54595a
 
Mastering the Unannounced Regulatory Inspection
Mastering the Unannounced Regulatory InspectionMastering the Unannounced Regulatory Inspection
Mastering the Unannounced Regulatory InspectionSafetyChain Software
 
Nutritional Needs Presentation - HLTH 104
Nutritional Needs Presentation - HLTH 104Nutritional Needs Presentation - HLTH 104
Nutritional Needs Presentation - HLTH 104misteraugie
 
The basics of sentences session 2pptx copy.pptx
The basics of sentences session 2pptx copy.pptxThe basics of sentences session 2pptx copy.pptx
The basics of sentences session 2pptx copy.pptxheathfieldcps1
 
Measures of Central Tendency: Mean, Median and Mode
Measures of Central Tendency: Mean, Median and ModeMeasures of Central Tendency: Mean, Median and Mode
Measures of Central Tendency: Mean, Median and ModeThiyagu K
 

Recently uploaded (20)

BASLIQ CURRENT LOOKBOOK LOOKBOOK(1) (1).pdf
BASLIQ CURRENT LOOKBOOK  LOOKBOOK(1) (1).pdfBASLIQ CURRENT LOOKBOOK  LOOKBOOK(1) (1).pdf
BASLIQ CURRENT LOOKBOOK LOOKBOOK(1) (1).pdf
 
Separation of Lanthanides/ Lanthanides and Actinides
Separation of Lanthanides/ Lanthanides and ActinidesSeparation of Lanthanides/ Lanthanides and Actinides
Separation of Lanthanides/ Lanthanides and Actinides
 
Staff of Color (SOC) Retention Efforts DDSD
Staff of Color (SOC) Retention Efforts DDSDStaff of Color (SOC) Retention Efforts DDSD
Staff of Color (SOC) Retention Efforts DDSD
 
Mattingly "AI & Prompt Design: The Basics of Prompt Design"
Mattingly "AI & Prompt Design: The Basics of Prompt Design"Mattingly "AI & Prompt Design: The Basics of Prompt Design"
Mattingly "AI & Prompt Design: The Basics of Prompt Design"
 
Kisan Call Centre - To harness potential of ICT in Agriculture by answer farm...
Kisan Call Centre - To harness potential of ICT in Agriculture by answer farm...Kisan Call Centre - To harness potential of ICT in Agriculture by answer farm...
Kisan Call Centre - To harness potential of ICT in Agriculture by answer farm...
 
Paris 2024 Olympic Geographies - an activity
Paris 2024 Olympic Geographies - an activityParis 2024 Olympic Geographies - an activity
Paris 2024 Olympic Geographies - an activity
 
Software Engineering Methodologies (overview)
Software Engineering Methodologies (overview)Software Engineering Methodologies (overview)
Software Engineering Methodologies (overview)
 
Q4-W6-Restating Informational Text Grade 3
Q4-W6-Restating Informational Text Grade 3Q4-W6-Restating Informational Text Grade 3
Q4-W6-Restating Informational Text Grade 3
 
Student login on Anyboli platform.helpin
Student login on Anyboli platform.helpinStudent login on Anyboli platform.helpin
Student login on Anyboli platform.helpin
 
Beyond the EU: DORA and NIS 2 Directive's Global Impact
Beyond the EU: DORA and NIS 2 Directive's Global ImpactBeyond the EU: DORA and NIS 2 Directive's Global Impact
Beyond the EU: DORA and NIS 2 Directive's Global Impact
 
Código Creativo y Arte de Software | Unidad 1
Código Creativo y Arte de Software | Unidad 1Código Creativo y Arte de Software | Unidad 1
Código Creativo y Arte de Software | Unidad 1
 
Arihant handbook biology for class 11 .pdf
Arihant handbook biology for class 11 .pdfArihant handbook biology for class 11 .pdf
Arihant handbook biology for class 11 .pdf
 
Sanyam Choudhary Chemistry practical.pdf
Sanyam Choudhary Chemistry practical.pdfSanyam Choudhary Chemistry practical.pdf
Sanyam Choudhary Chemistry practical.pdf
 
“Oh GOSH! Reflecting on Hackteria's Collaborative Practices in a Global Do-It...
“Oh GOSH! Reflecting on Hackteria's Collaborative Practices in a Global Do-It...“Oh GOSH! Reflecting on Hackteria's Collaborative Practices in a Global Do-It...
“Oh GOSH! Reflecting on Hackteria's Collaborative Practices in a Global Do-It...
 
18-04-UA_REPORT_MEDIALITERAСY_INDEX-DM_23-1-final-eng.pdf
18-04-UA_REPORT_MEDIALITERAСY_INDEX-DM_23-1-final-eng.pdf18-04-UA_REPORT_MEDIALITERAСY_INDEX-DM_23-1-final-eng.pdf
18-04-UA_REPORT_MEDIALITERAСY_INDEX-DM_23-1-final-eng.pdf
 
Mastering the Unannounced Regulatory Inspection
Mastering the Unannounced Regulatory InspectionMastering the Unannounced Regulatory Inspection
Mastering the Unannounced Regulatory Inspection
 
Nutritional Needs Presentation - HLTH 104
Nutritional Needs Presentation - HLTH 104Nutritional Needs Presentation - HLTH 104
Nutritional Needs Presentation - HLTH 104
 
Mattingly "AI & Prompt Design: Structured Data, Assistants, & RAG"
Mattingly "AI & Prompt Design: Structured Data, Assistants, & RAG"Mattingly "AI & Prompt Design: Structured Data, Assistants, & RAG"
Mattingly "AI & Prompt Design: Structured Data, Assistants, & RAG"
 
The basics of sentences session 2pptx copy.pptx
The basics of sentences session 2pptx copy.pptxThe basics of sentences session 2pptx copy.pptx
The basics of sentences session 2pptx copy.pptx
 
Measures of Central Tendency: Mean, Median and Mode
Measures of Central Tendency: Mean, Median and ModeMeasures of Central Tendency: Mean, Median and Mode
Measures of Central Tendency: Mean, Median and Mode
 

AssignmentMarginal Revenue ProductMarginal revenue product i.docx

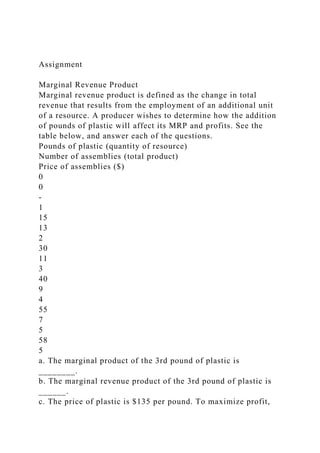
  • 1. Assignment Marginal Revenue Product Marginal revenue product is defined as the change in total revenue that results from the employment of an additional unit of a resource. A producer wishes to determine how the addition of pounds of plastic will affect its MRP and profits. See the table below, and answer each of the questions. Pounds of plastic (quantity of resource) Number of assemblies (total product) Price of assemblies ($) 0 0 - 1 15 13 2 30 11 3 40 9 4 55 7 5 58 5 a. The marginal product of the 3rd pound of plastic is ________. b. The marginal revenue product of the 3rd pound of plastic is ______. c. The price of plastic is $135 per pound. To maximize profit,
  • 2. the producer should produce __________________. d. The price of plastic is $135 per pound. To maximize profit, the producer should buy and use: ________________. Grading Criteria Assignments Maximum Points Meets or exceeds established assignment criteria 40 Demonstrates an understanding of lesson concepts 20 Clearly presents well-reasoned ideas and concepts 30 Uses proper mechanics, punctuation, sentence structure, and spelling 10 Total 100 Case Study C&MDS, Inc. Some time ago, at the beginning of 2010, an entrepreneur named Richard Alestar started a small business as a sole proprietor in Oregon - a business that manufactured sensors for cameras that could be used in motion detection systems. The business was very successful and he decided to incorporate in the latter part of 2011 under the name C&MDS, Incorporated. He wanted to name it Camera and Motion Detection Systems, but his marketing manager convinced him it was too difficult to remember. Alestar’s long-term plan was to obtain public funding to support growth anticipated in about 4-6 years. In the meantime, he hired electrical engineers and a solid management
  • 3. team capable of building an organization that would enable the company to eventually go public. He thought his proprietary sensors and equipment could not be duplicated for a number of years. There was only one competitor in the market niche where he competed that had a significant market share, but they were a follower, not a leader. Besides, he planned to grow the market himself, based on the increased focus and attention in the public arena on crime prevention, detection and surveillance using cameras with his sensors. He also was developing a host of other potential applications. Alestar had developed a good relationship with his investment banker Sophia Pound, and had just begun discussions with respect to obtaining additional capital required to position the company to go public. These discussions also involved the chief financial officer (CFO), Mitch O. Dinero, who had brought up the issue of the appropriate capital structure (target capital structure) that C&MDS should consider. They both thought the current mix in the capital structure was close to optimal, and that only minor changes would be necessary. However, they would defer to the investment banker before they made any final decisions, and there were several tasks to be done before talking to her. The initial work involved determining the firm’s cost of capital, and they would use the current balance sheet presented in Figure 1 to assess the weights of each of the capital components. Given that they were very close to the target capital structure, the difficult task would involve determining the appropriate cost to assign to each of the elements in the capital structure – debt, preferred stock, and common equity. And they thought the starting point was to gather data about the historical cost for issuing debt and preferred stock. That information is provided in Figure 2. Figure 1
  • 4. C&MDS Inc. Statement of Financial Position: Balance Sheet December 31, 2015 Assets Current assets: Cash $ 500,000 Marketable securities 100,000 Accounts receivable $ 2,450,000 Less: Allowance for bad debts 250,000 2,200,000 Inventory 5,400,000 Total current assets $ 8,200,000 Fixed assets: Plant and equipment, original cost $ 31,300,000 Less: Accumulated depreciation 13,100,000
  • 5. Net plant and equipment 18,200,000 Total assets $ 26,400,000 Liabilities and Owners’ Equity Current liabilities: Accounts payable $ 5,800,000 Accrued expenses 1,850,000 Total current liabilities $ 7,650,000 Long-term financing Bonds payable $ 6,250,000 Preferred stock 1,120,000 Common stock Retained earnings { Common equity 6,230,000
  • 6. 5,150,000 Total common equity 11,380,000 Total long-term financing 18,750,000 Total liabilities and owners’ equity $ 26,400,000 Although they felt they were making real progress in determining the cost of capital for the firm, they were not confident about component costs that they had identified and decided a call to Sophia was in order to make sure they were on the right track, and they set up a conference call for the following day. During the conference call with her, they explained what had been accomplished and raised the issue about historical costs for each of the elements in the capital structure. She voiced a concern about using historical costs that were somewhat dated. She reported that she knew of a comparable firm in the industry (that needed to remain unnamed), in terms of size and bond rating (Baa), that had issued bonds less than a year ago at a coupon rate of 8.7% at $1000 par value, and further reported that the bonds were currently selling for $930 and had 20 years remaining to their maturity date. This firm more recently had issued preferred stock for $60 per share, and was paying a $4.50 dividend. She also indicated that underwriting a new issue of preferred stock would cost $2.25 per share (underwriting fee or flotation cost). Figure 2Historical issue cost of debt and preferred stock Security
  • 7. Year of Issue Amount Yield Bond 2012 $ 1,250,000 6.1% Bond 2012 2,800,000 13.8% Bond 2015 2,200,000 8.3% Preferred stock 2011 595,000 12.0% Preferred stock 2014 525,000 7.9% After finishing the discussion about debt and preferred stock, their attention naturally progressed to the question about how to determine the cost of common equity. The CFO suggested that one approach would be to use the dividend valuation model. In reviewing the financial statements, he noted that earnings were $3.00 a share (EPS) and 40% of the earnings will be paid out in dividends (D1). Sophia also noted the dividends during the last four years had grown from $.85 per share to the current level, and the stock price was now (P0) $25 per share. She estimated the flotation costs for newly issued common stock would be $2.00 per share. Alestar and the CFO thanked her for the information and the assistance and told her they would get back
  • 8. with her after they had completed the preliminary calculations. There were several other factors that needed to be considered, and they relate to the following discussions: · Whether to use the historical weights for the capital structure components, or try to estimate or compute new market weights. · Should they use an estimated growth rate, compute the simple average growth rate, or use time value of money (TVM) concepts to determine a more accurate growth rate to use in cost of common equity calculations (dividend valuation model)? You have been chosen to assist the CFO in the analysis. Furthermore, several questions have been developed to help guide you, and they are listed below. However, there may be other issues that they have not thought of and that they want you to identify and address. Case Questions (show all of your work) 1. Determine the weights of each component in the capital structure: Use the amount of retained earnings provided. The percentage composition (weights) in the capital structure for bonds, preferred stock, and common equity should be based on the current capital structure long-term financing section as shown in Figure 1 (indicated as $18.75 million). Common equity will remain at the current weight throughout the case, and the combined tax rate is 35%. 2. Determine the cost for each component in the capital structure (after-tax cost of debt, cost of preferred stock, cost of equity). Use your calculator to solve for the interest rate (I). 3. Given your results from questions 1 and 2 above, calculate the weighted average cost of capital (WACC).
  • 9. 4. Now assume that new common stock will be used in the capital structure (you will obtain new common stock with flotation costs). Also assume all the weights remain the same; common equity is now supplied by new common stock, rather than by retained earnings (debt and preferred stock costs remain the same). Recalculate the weighted average cost using new common stock in the capital structure. Remember to consider flotation costs. 5. The increase in the cost of capital will take place at a certain level of financing, where the cost of financing increases (known as the marginal cost of capital): What is this level of financing (dollar amount)? Determine this by dividing retained earnings by the percent of common equity in the capital structure (as noted in Question 1). 6. You have been told that the investment banker wishes to use the capital asset pricing model (CAPM, as shown on p. 388 in the 15th edition of the text), to compute the cost (required return) on common stock. Assume the risk free rate (rRF) is 4.9%, beta for the firm is 1.30, and the market risk premium (RPM) is 6.8%. a. What is required rate of return for common equity using this method? b. Secondly, how does it compare to the required rate of return computed in Question 1 above? Rev. Dec 2017 Ver. A © Example of Case Study Write-upCase Study: Gilbert Enterprises
  • 10. Submitted by: James Bunsa For: FINC 5880 Date: 11 Apr 2014 a. Current Situation Company I nformationGilbert Enterprises, the third largest publicly traded firm in the auto parts replacement industry, had experienced a decline in its stock price over the past five months. Its founder and chairman, Tom Gilbert, along with the Finance VP, were considering a stock repurchase, thinking the announcement would send a message to investors about the current market undervaluation of the stock. Industry and Economic InformationResearch had indicated that auto owners were keeping their vehicles longer (8 years on average, up from 6.8 years twenty years earlier), and new vehicle price increases had surpassed the rise in consumer incomes. The trend of investing in older vehicles to keep them on the road longer would bode well for Gilbert. In addition, Gilbert had invested in an industry-leading JIT inventory management system and as a result expected supernormal growth over the next several years. b. Major Issues Several significant issues that Gilbert faces include: · Develop these issues preliminarily, and readdress/refine them after answering the case-specific questionsDoes the growth rate
  • 11. seem reasonable, given the current and expected circumstances (economic and industry)? · Does the current stock price fairly represent Gilbert’s value in the market? · What is the “real” value of Gilbert’s stock? And how should it be determined (methods, process)? · What other data should be considered in the valuation? · What decision should they make – repurchase stock or do something else? · What are the possible investor and market reactions to an announcement? · Other issues …. c. Approach Identify the appropriate analytical techniques (dividend valuation model) to evaluate Gilbert’s value in the market; use a price-earnings approach to supplement the dividend model results; and use selected ratio comparative analysis to fairly position Gilbert against its competitors; and specifically answer the case questions. d. Case-specific Questions 1. Supernormal growth valuation – does the firm seem to be under or overvalued? Three steps to find intrinsic value, and then compare to market. · Find present value of supernormal dividends Discount future supernormal dividends back to present at 10% (required rate of return) Current dividend D0 =
  • 12. (given) 1.20 Future dividends D1 = (D0 * 1.15) 1.38 X 0.9091 1.25 D2 = (D1 * 1.15) 1.59 X 0.8264 1.31 D3 = (D2 * 1.15) 1.83 X 0.7513 1.37
  • 13. Total 3.94 Present value of dividends during the supernormal growth period = 3.94 These are calculations to answer the questions · Find the present value of the future stock price Find PV of future stock price P3 = stock price when supernormal growth ends D4 = dividend at time 4 when constant growth is 6%
  • 14. Ke = required rate of return (cost of equity = 10 percent 10% g = 6 percent (constant growth) 6% P3 = D4 Ke - g
  • 15. D4 = D3 (1 + g) = 1.935 P3 = 48.363825 Must discount stock price back to current - find PV at 10% Est of P0 $36.34
  • 16. · Find total value (stock price plus value of dividends) Add price of stock and value of dividends to get total value Estimate of P0 = $36.34 If rounding earlier in the problem Add PV of dividends = 3.94 total is as high as $40.37 Total $40.27
  • 17. Conclusion: Because the stock is selling in the market for 35 1/4th, it appears to be undervalued. 2. Gilbert’s P/E ratio is currently is the second lowest of all firms in the industry. However, based on the financial information provided in Figure 1 this does not appear to be appropriate, given that Gilbert currently has the highest growth rate of EPS and growth is expected to accelerate to 15% (supernormal) growth over the next three years. This is financial ratio a nalysisIt also has the second highest return on stockholder’s equity, and the firm leading this category has a very high debt ratio (resulting in a relatively smaller proportion of equity over which to spread the earnings – it is possible to generate a high return on equity using debt, but still have relatively low profitability, as Reliance has in this case as indicated by its lowest return on total assets ratio in the industry). In evaluation debt utilization as a separate issue, Gilbert once
  • 18. again looks attractive with a debt to total asset ratio of 33%, with Standard Auto being the only firm with a better (lower) ratio. Market Values Market Book Replacement Market Market to Value Value Value to Book Replacement Gilbert Enterprises 35.25 16.40 43.50 2.15 0.81 Relaince Parts 70.50 50.25 68.75 1.40 1.03 Standard Auto
  • 19. 24.25 19.50 26.00 1.24 0.93 Allied Motors 46.75 50.75 27.50 0.92 1.70 Evaluation of market to book values and market to replacement values will provide additional insight about Gilbert’s financial position in the industry. Although pro forma market value to book value ($40.27/$16.40 = 2.46) is high compared to others (1.40 to .92), this is not an especially meaningful value, because book value is based on historical cost. A more meaningful value is market to replacement, in which Gilbert is much more conservative ($40.27/$43.50 = .93), and is comparable to Standard Auto ($24.25/$26.00 = .93). Dividends are another area where Gilbert is excelling, second only to Standard in dividend yields. Finally, how would Gilbert’s pro forma P/E ratio compare with the industry? One must first calculate the EPS, since it is not provided. P/E = Stock Price/EPS 16.8 = $35.25/EPS EPS = $35.25/16.8 = $2.098 per share
  • 20. Now, calculate the pro forma P/E ratio given the estimate of the intrinsic stock price of $40.27 in the earlier analysis. P/Epf = $40.27/$2.098 = 19.2, still within the appropriate range for the industry (industry average is now 18.9). In summary, Gilbert appears to be undervalued compared to its competition, considering all of the findings previously reported. 3. Recommendations to Albert Roth: Based on the answers to Questions 1 and 2, Gilbert Enterprises appears to be undervalued, and Roth should seriously consider recommending the firm repurchase part of its shares in the marketplace. However, there is reason to be cautious: · Be creative here; you get credit for thinking outside the box (but not too far out)Markets are efficient in their pricing of securities (Efficient Market Hypothesis), and there may be some information that we are not aware of that justifies Gilbert’s lower valuation. · Secondly, even if the stock is undervalued in the marketplace, management must make certain that this is the best use of its limited investment funds (examine alternative uses). e. Other options? Although there are no indications in the case that Gilbert has alternatives to this repurchase plan, it should exhaust the possibilities of purchasing another firm or firms in the industry that might provide positive synergies, add sales in areas that Gilbert is lacking, cover geographic areas currently underserved, or focus on a firm that provides a good “fit” with
  • 21. its state-of-the-art inventory management systems. As an alternative, it could significantly reduce the number of shares it in considering (up to one million shares), and use the remainder for other investments. f. Prediction I believe that Albert Roth will recommend the repurchase, and that it will be successful. After all, Roth in an investment banker and is there to serve his client while earning profits from additional revenue for his firm – Baker, Green and Roth. Rev. Jan 2017 Circular Flow of Economic Activity Using the Circular Flow of Economic Activity model, we can determine how an economic system works to allocate scarce resources. Households, who own factors of productive resources like land, labor, and capital, are used by firms to produce goods and services which households need and desire. For the use of the factor resources, firms pay households income, wages, rent, and interest, which households use to purchase those goods and services. But how do households and firms in resource markets determine the proper allocation and price for those productive resources? Demand for resources is derived demand. Demand is derived according to the demand for the end product. The demand curve (demand for a productive resource) will be downward sloping and negatively sloped. A change in demand for the end product will lead to a change in demand for a productive resource. With respect to the price elasticity of demand for a productive resource, the greater the number of substitutes and complements, the higher the price elasticity will be for the productive resource. Thus, the slope will be lower when the demand for a productive resource is more price elastic. Firms use productive resources to produce goods and services. Output is the result of using productive resources. In
  • 22. economics, we differentiate and define output according to the following: Total Product (TP): Total output produced from an input resource. Average Product (AP): Average output produced per input resources. AP = TP / (# of units of input) Marginal Product (MP): Change in total product when one more unit of input resources is used. MP = (change in TP) / (change in units of input) Margin Revenue Product (MRP): Change in total revenue when one more unit of input resources is used. MRP = (change in TR) / (change in units of input) Value Marginal Product (VMP): Value of the marginal product of labor the next unit of input resource brings to the firm. VMP = MP X selling price In product markets, we know that firms - all firms - produce optimal output at the point where marginal revenues equal marginal costs. But in productive resource markets, at what point will a firm find equilibrium and optimal marginal resourcing? Marginal revenue product (MRP) equals marginal resource cost (MRC), or MRP=MRC. In aggregate resource markets, demand for labor and supply of labor converge to an equilibrium point for price and quantity. For individual firms, the demand for labor (MRP) will be a downward-sloping curve, indicating that as quantity demanded for a resource rises when the price of labor falls. The MRC will entail how much a firm pays to secure one more unit of a productive resource. Labor Curve What causes a differential between the wages of one type of job versus another? · Between skilled and non-skilled? · Can price floors or minimum wages be instituted to benefit low-wage earners to lift them up and reduce poverty? · Are there negative effects of minimum wages? · How technology play a part in all of this?
  • 23. When we analyze how productive resource markets operate, we are more equipped to answer those questions. · For example, individuals are different, and they have different sets of skills and motivations. · Jobs are different and are not all the same. · Higher paying jobs tend to require higher productive and skilled individuals. · There is a separate demand for labor skilled curve and demand for labor unskilled curve; there is a separate supply of labor skilled curve, as well as a separate unskilled labor supply curve. The demand for labor skilled curve and demand for labor unskilled curve are parallel, with the demand for labor skilled farther rightward than unskilled. As for the supply side, the supply of labor skilled curve and supply of labor unskilled curve are also parallel, with the supply of labor skilled farther leftward than unskilled. How do we read that, and what are the implications? When you put the four curves together, what is ascertained is the gap between the demand curves is the marginal product difference, or the additional total product attained by adding one more unit of skilled labor; the gap between the supply curves indicates skilled labor is more costly and is less plentiful as unskilled. Ultimately, what is ascertained about the price of labor is the gap between the equilibrium points of the demand for labor unskilled and supply of labor unskilled versus the equilibrium points of the demand for labor skilled and supply of labor skilled is the wage difference (or otherwise known as the "wage gap"). Can this wage gap be closed a bit to offer better pay conditions for a low-wage earner? What, if any, are the negative aspects of a minimum wage? A minimum wage, which is a price floor set by firms or government, is the price that is the least a firm can pay for use of a labor resource. The price is set above the equilibrium price where the demand for labor and supply of labor meet. The Law of demand and Law of supply come into play. At the
  • 24. higher price, quantity demanded is less, while quantity supplied is higher. Since quantity demanded is less than quantity supplied, surpluses ensue. More productive resources are available to be hired, while fewer buyers of productive resources exist. Increases in unemployment can occur from this imposed price floor. Can technology actually lead to higher productivity and even wider gaps between skilled and unskilled. Yes for both. The aggregate production function curve represents how productivity depends upon the physical capital per worker, human capital per worker, and relative technology. · As newer and better technology is used, productive resources tend to achieve exponentially higher productive levels relative to older and less advanced technology. As workers who achieve higher levels of skill and utilize technology to increase efficiency and productivity increase when unskilled workers do not, the wage gap and demand for supply of unskilled labor widens.