Assignment 1: LASA 2— Corporate Compliance
You are a corporate compliance officer for a hospital. You are also a feature writer for The Medical Reporter, an online health magazine. The editor asks you to write an 8-10 page feature story about the steps you should take when fraud and abuse cases are reported to a facility. This is very timely as you recently received a call on your “hotline” regarding a potential fraud and abuse issue. The caller indicated that Dr. Greedy was billing for services that had not been provided. You are in danger of losing reimbursement for Medicare and Medicaid programs if this behavior is not stopped. Your feature should address the ethical and moral components that healthcare providers and healthcare facilities face with fraud and abuse issues. Your research should include the following aspects:
I. How to conduct an investigation. It should include the following elements:
a. Reviewing the initial complaint: What are the items you should look for in a compliant to determine validity?
b. Notifying the appropriate upper management of the complaint unless they are implicated in the complaint: What are the steps to take to determine who is involved?
c. Obtaining additional information as necessary and developing a plan for the investigation: What other items are important to the investigation?
d. Conducting interviews with staff, residents and/or management: Delineate the types of questions to ask in the interview.
e. Determining if the allegations are substantiated or unsubstantiated: Identify criteria to determine if substantiated or unsubstantiated.
II. How to develop a correction action plan. The plan may suggest:
2. A recommendation for a subsequent audit or follow-up to the complaint and determination of when this is necessary.
2. A recommendation to refund any overpayments to federal government, insurance company or individual payer and when that may be the best course of action.
By Saturday, August 24, 2013, deliver your assignment to the M5: Assignment 1 Dropbox.
Use the following file naming convention: LastnameFirstInitial_M5_A1.doc.
Assignment 1 Grading Criteria
Maximum Points
Discussed the process for reviewing the initial healthcare fraud and abuse complaint and the items to look for to determine validity.
36
Explained the steps to take to determine who is involved in the complaint.
32
Discussed how to obtain additional information to develop a plan for the investigation and the items, which would be important to the investigation.
32
Explained how to conduct interviews with staff, residents and/or management and the types of questions to ask in the interview.
32
Identified the criteria to determine if the allegations are substantiated or unsubstantiated.
32
Explained how to determine when a recommendation for a subsequent audit or follow-up to the complaint is necessary.
36
Discussed the best course of action when a recommendation to refund any overpayments to federal government, i ...
Assignment 1 LASA 2— Corporate ComplianceYou are a corporate .docx
1. Assignment 1: LASA 2— Corporate Compliance
You are a corporate compliance officer for a hospital. You are
also a feature writer for The Medical Reporter, an online health
magazine. The editor asks you to write an 8-10 page feature
story about the steps you should take when fraud and abuse
cases are reported to a facility. This is very timely as you
recently received a call on your “hotline” regarding a potential
fraud and abuse issue. The caller indicated that Dr. Greedy was
billing for services that had not been provided. You are in
danger of losing reimbursement for Medicare and Medicaid
programs if this behavior is not stopped. Your feature should
address the ethical and moral components that healthcare
providers and healthcare facilities face with fraud and abuse
issues. Your research should include the following aspects:
I. How to conduct an investigation. It should include the
following elements:
a. Reviewing the initial complaint: What are the items you
should look for in a compliant to determine validity?
b. Notifying the appropriate upper management of the complaint
unless they are implicated in the complaint: What are the steps
to take to determine who is involved?
c. Obtaining additional information as necessary and developing
a plan for the investigation: What other items are important to
the investigation?
d. Conducting interviews with staff, residents and/or
management: Delineate the types of questions to ask in the
interview.
e. Determining if the allegations are substantiated or
unsubstantiated: Identify criteria to determine if substantiated
or unsubstantiated.
2. II. How to develop a correction action plan. The plan may
suggest:
2. A recommendation for a subsequent audit or follow-up to the
complaint and determination of when this is necessary.
2. A recommendation to refund any overpayments to federal
government, insurance company or individual payer and when
that may be the best course of action.
By Saturday, August 24, 2013, deliver your assignment to the
M5: Assignment 1 Dropbox.
Use the following file naming convention:
LastnameFirstInitial_M5_A1.doc.
Assignment 1 Grading Criteria
Maximum Points
Discussed the process for reviewing the initial healthcare fraud
and abuse complaint and the items to look for to determine
validity.
36
Explained the steps to take to determine who is involved in the
complaint.
32
Discussed how to obtain additional information to develop a
plan for the investigation and the items, which would be
important to the investigation.
32
Explained how to conduct interviews with staff, residents and/or
management and the types of questions to ask in the interview.
32
Identified the criteria to determine if the allegations are
substantiated or unsubstantiated.
32
3. Explained how to determine when a recommendation for a
subsequent audit or follow-up to the complaint is necessary.
36
Discussed the best course of action when a recommendation to
refund any overpayments to federal government, insurance
company or individual payer is warranted.
36
Written Components:
Style (8 points): Tone, audience, and word choice
Organization (16 points): Introduction, transitions, and
conclusion
Usage and Mechanics (16 points): Grammar, spelling, and
sentence structure
APA Elements (24 points): In text citations and references,
paraphrasing, and appropriate use of quotations and other
elements of style
64
Total:
300
The DJIA and Its Relationship to Stock Price
1. What is the name and NYSE symbol of the selected
company?
McDonalds Corporation - MCD
2. What is its primary business?
McDonalds Corporation uses marketing, financing and
operations, the three functions of management mechanism to
work its $ 23.8 billion a year quick service restaurant business
(QSR), in 100 countries employing 480,000 employees.
McDonalds use basic principles of its management structure to
continuously improve its business of QSR by planning,
4. organizing, staffing, leading and controlling. McDonalds is a
food production process, base company who specialized in their
customer service and the speed of service to attract customers.
McDonalds is a Dow Jones 30 Corporation listed at NYSE under
the symbol of MCD. When you feed 50 million customers at
30,000 restaurants around the world every day, you would think
just getting the basics right would be enough. McDonalds
Corporation knows that running its core business correctly is
absolutely necessary for success, but is insufficient to keep it
growing. For that, the Golden Arches is simultaneously
attending to operating flawlessly while working hard to
innovate to grow its future. (Gabmen & Russell, 2006, p. 21)
McDonalds Corporation Frequency Distribution Table
3. What categories and types of data are you collecting?
The data on stock prices is discrete data.
4. Where will you find the data needed for this S. L .P.
I have been reading daily papers and recording closing price for
the day. I have also used official websites for McDonalds
Corporation (http://phx.corporate-
ir.net/phoenix.zhtml?c=97876&p=irolstockLookup&t=HistQuot
e&control_firstdatereturned) and Dow Jones Industrial Average
(http://money.cnn.com/data/markets/dow/?page=2)
.
5. Would a frequency distribution table be appropriate for
displaying your
stock's daily closing price?
Frequency distribution table is a good way of presenting what
is happening within a certain companies stock prices. It gives a
single outlook of what is happening. Days that there has been a
rise in share price can be seen at a glance
5. References
Dow Jones Industrial Average (2010).Retrieved on 24th August
2010 from http://money.cnn.com/data/markets/dow/?page=2
McDonalds Corporation (2010). Retrieved on 24th August 2010
from
http://phx.corporateir.net/phoenix.zhtml?c=97876&p=irolstockL
ookup&t=HistQuote&control_firstdatereturned
Gabmen, J., & Russell, S. (2006). Think Big, Start Small, Scale
Fast: Growing Customer
The following is the table for closing tables for McDonald and
Dow Jones Industrial Average.
Date
McDonalds Closing stock
Dow Jones Industrial
Average.
7/30/2010
66.71
10465.94
7/29/2010
66.14
10467.16
7/28/2010
66.11
10497.88
7/27/2010
67.31
10537.69
7/26/2010
69.02
10525.43
7/23/2010
69.22
7. 10018.28
7/6/2010
69.77
9743.62
7/2/2010
69.38
9686.48
7/1/2010
69.73
9732.53
(Dow Jones Industrial Average, 2010) and (McDonalds
Corporation, 2010).
Mean
Mean this is used to calculate the average of the data. The mean
will assist in giving a clue of the expected results. The extremes
can be done away with, and this is the first step of improving
the accuracy of the data.
The mean for the data is
McDonald daily closing price average for the month of July=
1458.37/21 =69.44619048
Dow Jones Industrial Average Mean for the month of July is =
214667.09/21 = 10222.24238
Mode and the Median
Mode and the median; they are the most frequent value of the
statistics, when this is compared with the mean, analysis of the
most probable can be determined this assist to guide the flow of
the statistics.
Mode shows the number that is most frequent and sometimes it
happens that there is more than one mode when the maximum
numbers appearing are more than one. On the other hand, there
8. may be data that does not have a mode when the number of a
data appearing is equal, for example a set of two data’s all over
the statistics.
Median is calculated by arranging the statistics in a
descending/acceding order and the number appearing in the
middle is the median. There are times that there are two
numbers at the centre, the median is the average of the two
numbers.
McDonald mode = 69.94
Dow Jones Industrial Average mode = no mode
Median of McDonald is 69.91
Dow Jones Industrial Average median is 10229.96
What is the probability that your McDonald stock price will
increase if the DJIA increases?
This is the conditional probability that happens if one variable
changes in our case the variables are McDonald stock price
andDow Jones Industrial Average. To calculate this I will take
Dow Jones Industrial Average as the independent variable and
McDonald stock price as the dependent variable, to calculate
this I will use the data above and compare these two variables;
No of times that there is a rise in McDonald stock price when
there is a rise in Dow Jones Industrial Average = 4
The probable increases ones (total number of increase in Dow
Jones Industrial Average) = 7
Probability that your McDonald stock price will increase if the
DJIA increases
9. = 4/7
Reference List
Dow Jones Industrial Average (2010). Retrieved on 1st
September 2010 from
http://money.cnn.com/data/markets/dow/?page=2
McDonalds Corporation (2010). Retrieved on 1st September
2010 from
http://phx.corporateir.net/phoenix.zhtml?c=97876&p=irolstockL
ookup&t=HistQuote&control_firstdatereturned
Smithson, M. (2003). Confidence intervals. Quantitative
Applications in the Social Sciences Series, No. 140. Belmont,
CA: SAGE Publications
The DJIA and Its Relationship to Stock Price
DJIA
It is one of the stock indexes that were presented by Charles
Dow, editor Wall street journal and cofounder of Dow Jones &
Company. When calculating the index, a divisor called Dow
divisor is used to divide all the prices of 30 stocks listed in the
U.S. market. In cases of market adjustments and changes in
stock prices, for example in cases of stock splits, stock spinoffs,
10. the divisor is adjusted to ensure that the figure remains
effective.
The formulae are where P= price and d is Dow divisor
Currently the figure is less than one after adjustments (Sullivan
& Sheffrin, 2003).
This is the formula that is used when there is a change in the
stock market. The current value of divisor is .132319125. For
every change in $1 in average it results to a 7.56 points change
movement effect. It has been in use for the last 140 years (Dow
Jones 2008-02-11).
Null hypotheses
There is no relationship between the DJIA and the stock
movement of McDonald Company.
Alternative hypotheses
A change in the DJIA results to a change in the stock price of
McDonald.
The change is inversely related.
Data collected is:
Date
McDonalds Closing stock
Dow Jones Industrial
Average.
7/30/2010
66.71
10465.94
7/29/2010
14. Also find excel sheet with the same.
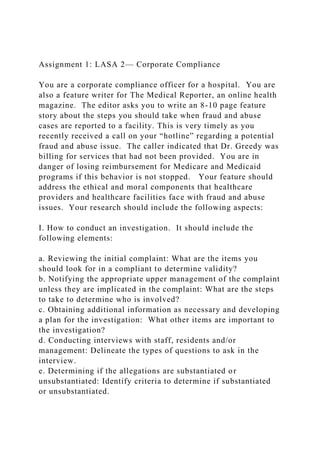
Pearson's r correlation
The figure is calculated in the spread sheet and the figure is -
0.46388.
Meaning of Pearson’s r
It is the covariance of two sets of data; dependent and
independent variable then divided by their standard deviation. It
ranges from -1 and +1. The following formula is used to
calculate the figure where X is the dependent variable and Y
the independent variable. It can though be calculated using
spread sheets (Creswell, 2003).
When the figure is one it means that the data is perfectly
correlated and a change in X results to a change in Y. They lie
on the same straight line. Their change is proportional in that if
X changes with 2 then Y changes with 4. All other changes of Y
will be double changes of X.
When the value is -1, then it means that they lie on the same
line but they are correlated differently where if x increases,
then y decreases.
On the other hand, if the correlation is a Zero (0). Then it means
that there is no correlation between independent and dependent
variable (Stigler, 1989).
Depending on how negative or how positive the figure is, the
relationship of data can be calculated. In our case the r= -
0.46388, meaning for every decrease in X (McDonald price),
15. then there is a decrease in the DJIA, however it is not with the
same proportion that is why it does not lie on the same line.
The following diagram shows a plotted Pearson correlation
diagram;
Diagram from Stigler, 1989.
Reference List
Creswell, J. (2003). Research Design: Qualitative, Quantitative,
and Mixed Methods Approaches. Thousand Oaks, California:
Sage Publications.
Dow Jones (2008-02-11). "Dow Jones to change the
composition of the Dow Jones Industrial Average". Press
release. Retrieved 2010 September 15.
Stigler, M. (1989). "Francis Galton's Account of the Invention
of Correlation". Statistical Science4 (2): 73–79.
Sullivan, A. and Sheffrin, M. (2003). Economics: Principles in
action. Upper Saddle River, New Jersey 07458: Pearson
Prentice Hall. pp. 290.
STS401 - Business Statistics
Start by viewing this presentation on multiple regression. The
citation is:
TUI University (n.d.) Multiple regression analysis.
(Powerpoint presentation with voiceover.) Retrieved from
http://cdad.tuiu.edu/Presentation.aspx?course=493&term=76&pr
esentation=523 on Nov 11, 2008.
Now review this information on multiple regression in
16. HyperStat Online by clicking HERE. The citation is:
Lane, D. (n.d.). HyperStat: Introduction to multiple
regression. Retrieved from
http://davidmlane.com/hyperstat/B123219.html on Nov 11,
2008.
Read the General Purpose section of the below article. You can
review the entire article, but read the General Purpose section
for a good discussion of the use and purpose of multiple
regression analysis.
StatSoft, Electronic Text Book (1998). Accessed on November
28, 2007 at:
http://sunsite.univie.ac.at/textbooks/statistics/stmulreg.html#ge
neral
You should also click HERE to review this information
concerning measuring the importance of variables in multiple
regression. The citation is:
Lane, D. (n.d.). HyperStat: Measuring the importance of
variables in multiple regression. Retrieved from
http://davidmlane.com/hyperstat/B140308.html on Nov 11,
2008.
Waner, S. (2007). Regression calculator. Retrieved on March
1, 2008, from
http://people.hofstra.edu/Stefan_Waner/newgraph/regressionfra
mes.html
Optional
Lane D. (n.d.) HyperStat Online Statistics Textbook, Retrieved
September 9, 2007, from
http://davidmlane.com/hyperstat/index.htm
StatSoft (n.d.) Multiple Regression, Retrieved September 9,
2007, from