
Recommended
More Related Content
Similar to 9Assessing Market Opportunities and Targeting Market Seg.docx
Similar to 9Assessing Market Opportunities and Targeting Market Seg.docx (20)
More from fredharris32
More from fredharris32 (20)
Recently uploaded
Recently uploaded (20)
9Assessing Market Opportunities and Targeting Market Seg.docx
- 1. 9 Assessing Market Opportunities and Targeting Market Segments Fuse/Thinkstock The aim of marketing is to know and understand the customer so well the product or service fits him and sells itself. —Peter Drucker Learning Objectives After reading this chapter, you should be able to do the following: • Delineate the importance of performing a market opportunity analysis, and explain the process of assess- ing market opportunities. • Identify the four activities involved in completing a market demand analysis, and discuss commonly used bases for market segmentation. • Explain the use of three methods for measuring market potential. • Discuss the substeps of the market segmentation and target marketing phases and the steps involved in the market segmentation process.
- 2. Section 9.1Market Opportunity Analysis Introduction This chapter focuses on the details of identifying market opportunities, evaluating these opportunities, and then deciding whether to pursue an opportunity. The careful analysis of a marketing opportunity not only helps the organization grow by pursuing feasible opportuni- ties, it also helps the organization avoid the costly mistake of pursuing an opportunity that is not really viable, or one for which the internal resources are insufficient for its sustainment over the long run. 9.1 Market Opportunity Analysis Market opportunity analysis is the process of defining the exact nature of the opportunities available in an organization’s operating environment in terms of external, financial, and internal considerations. Figure 9.1 presents an overview of this process in terms of the steps involved in the analysis. As this diagram depicts, opportunity analysis is a comprehensive analysis of all aspects of an alternative before decisions are made to pursue it. The results of such an analysis put the decision-maker in a position of having a strong database from which to choose among the various alternatives present in the environment in line with financial and internal considerations that are specified by management.
- 3. The analysis begins with a detailed study of the environment in which the proposed business would operate. This includes not only the political, legal, economic, social, cultural, and tech- nological environments, but also market size, growth trends, and consumers’ attitudes and behavior. It also involves a study of current and potential competitors who may be going after the same customers the organization proposes to attract. These factors are external to the organization or person contemplating the new venture; therefore, a thorough analysis of these factors requires a great deal of diligence. The analysis usually involves a substantial commit- ment of time and money to collect the necessary information. The tools used in the opportu- nity assessment process are illustrated in Figure 9.1. If the environmental analysis indicates that these factors are favorable to the potential business, then a further analysis of the financial implications of the opportunity should be undertaken. The financial analysis is the key to determining the potential feasibility of the opportunity and the expected impact on revenues and costs. The results of this analysis provide the informa- tion needed to ensure that resources will be allocated to the most attractive opportunities. The final area of analysis involves a study of internal factors that affect the decision to pursue a given opportunity. The organization’s purpose, objectives, and resources must be analyzed in relation to the proposed opportunity. An opportunity—even, potentially, a profitable one—
- 4. may not fit with the purpose, the objectives, or the resources of the organization. Such opportuni- ties are forgone for others that do fit. As Figure 9.1 emphasizes, a thorough study of the opportunity is completed before a deci- sion is made to pursue it. Rushing into a decision without the type of analysis described in Section 9.2Market Demand Analysis this textbook greatly increases the chances of failure. Although failures cannot be completely eliminated because of unforeseen circumstances, the chance of success can be greatly enhanced by thoroughly assessing the opportunities before making commitments. Figure 9.1: The opportunity assessment process Assessment of the external, financial, and internal considerations helps an organization pinpoint the exact nature of opportunities within its operating environment. f09.01_MHA 626.ai Financial considerations External considerations Internal considerations
- 5. Resources Profitability analysis Cost analysis Competitive analysis Consumer/Market analysis Opportunity ranking Purpose Investment analysis Revenue analysis Social/Cultural/ Technological environment Political/Legal/ Economic environment Objectives 9.2 Market Demand Analysis After a thorough study, using the PESTLE framework, of
- 6. external factors influencing the operating environment (as described in Chapter 4), the management of an HCO would next turn their focus to the analysis of the market demand for a healthcare service. An analysis of market demand involves (a) identifying a market, (b) identifying market factors, (c) esti- mating market potential, and (d) estimating the revenues anticipated from a given venture. This chapter briefly examines these four activities involved in completing a market demand analysis. Section 9.2Market Demand Analysis Identifying a Market A fundamental concept that underlies the type of analysis described in this chapter is this: What is sometimes referred to as a market for a product or service is actually a composite of smaller markets, each with identifiable characteristics. One way to identify a market is through market segmentation, which was discussed in Chapter 7. Segmentation is a strat- egy that aggregates consumer (or patient) groups with similar characteristics and common interests. The dental market, for example, refers to a broad market sector that is composed of smaller submarkets, or market segments. This market can be segmented in several ways to identify the various submarkets: The type of patients served (children or adults), the ser- vices sought (general dentistry, oral surgery, or cosmetic), etc. This process of breaking up a
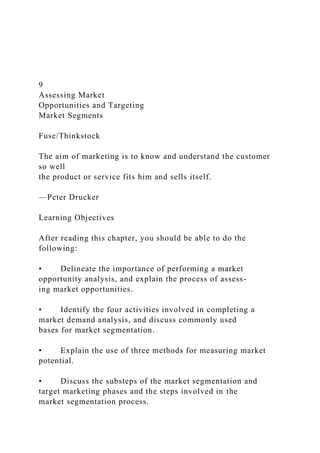
- 7. market into its constituent parts is called market segmentation. The basic premise is that the patients in one market are different from the patients in another market, and, therefore, each represents a separate entity. An example of market segmentation in the medical equipment and supply industry is illus- trated in Figure 9.2. Medical equipment manufacturers and supply companies segment their market between healthcare facilities and retail outlets, such as drugstores. Treatment equip- ment that requires use by trained professionals is marketed to healthcare facilities, while commonly used equipment (diabetic testing devices, crutches, inhalers, and so forth) is mar- keted to retail outlets. Note that the manufacturers can further segment the healthcare facil- ity market into hospitals, nursing homes, clinics, and home health agencies. As Figure 9.2 illustrates, the same segmentation strategy is used by drug companies. Markets are broadly divided between prescription drugs and over-the-counter (OTC) drugs. Figure 9.2: Four segments of healthcare and two major markets Organizations in the medical equipment and supply industry segment markets into two major categories: healthcare facilities and retail outlets. f09.02_MHA 626.ai Over-the-counter drugs
- 8. Patients who need care visit hospitals, nursing homes and other facilities. Individuals who do not require a doctor’s prescription to buy drugs and medical supplies. Medical equipment and supply companies Healthcare facilities Bandages, first aid, etc. Advanced treatments and prescription drugs Treatment
- 9. equipment Major drug developers Biotechnology and special treatment developers Source: Wikinvest http://www.wikinvest.com/industry/Pharma_%26_Healthcare http://www.wikinvest.com/industry/Pharma_%26_Healthcare Section 9.2Market Demand Analysis Markets are too complex and diverse to consider all patients within the market as homoge- neous. If a new service is to appeal to older adult women, for example, then that segment or part of the total market in the age group 55 and up is the market of interest. Its size and char- acteristics must be identified and studied; the other segments are not considered. Bases for Market Segmentation Commonly used bases for segmentation include (a) geographic and demographic, (b) prod- uct usage and benefits sought, and (c) lifestyle and psychographic. Brief discussions of these bases for segmentation follow. Geographic and Demographic Segmentation One approach to segmentation involves using geographic and demographic variables to seg- ment markets. Geographic segmentation involves the use of
- 10. census tracts, cities, trade areas, counties, states, regions, and countries as the basis of segmentation. For many services, this is a logical framework. Demographic segmentation involves using variables such as gender, age, income, educational level, and so forth as the basis for segmenting a market. These vari- ables are appropriate for many healthcare services. For example, the number of women of childbearing age determines the size of the obstetrics market. Product Usage and Benefits Sought Segmentation Another approach to market segmentation, product usage segmentation, concentrates on the product usage patterns of consumers as the basis for segmentation. Patients are classi- fied as users or nonusers, and users are further classified as frequent and infrequent users. In many service categories, a small percentage of patients may account for a large portion of users. Dermatological services are an example of a medical service with varying usage rates. Thus, usage rates become important as a basis for segmentation for some products. Benefits sought segmentation is another way to segment markets and is based on the ben- efits the patients or consumers expect to receive upon purchase or use of a product. In one study, the toothpaste market was segmented on such variables as flavor and product appear- ance, brightness of teeth, decay prevention, and price. Each of these variables represents the principal benefits sought by the purchaser. Each of these benefits sought segments, in turn, is composed of consumers with different demographics,
- 11. personalities, lifestyles, and so forth. Thus, each represents a distinct market segment. Lifestyle and Psychographic Segmentation Another segmentation approach to selecting target markets involves lifestyle and psycho- graphics. Although the concepts of lifestyle and psychographics are often used interchange- ably, they are not equivalent, but they are complementary. The term lifestyle is not new, but its application to marketing has been rather recent. From our perspective, lifestyle can be viewed as a unique pattern of living, which influences and is Section 9.2Market Demand Analysis a reflection of a person’s consumption behavior. Therefore, a lifestyle marketing perspective is one that recognizes that people can be sorted into groups based on what they like to do. Thus, marketers attempt to identify patterns of consumption for people who share a similar lifestyle (Solomon, 2013). For example, HCOs that advertise sports medicine programs are often targeting active adults who may develop runner’s knee or tennis elbow. How does the concept of psychographics relate to lifestyle? Psychographics is the “use of psy- chological, sociological, and anthropological factors to construct market segments” (Solomon, 2013, p. 586). Thus, psychographics pertains to why consumers do what they do. One of the
- 12. more precise statements about its nature is the following: Psychographics is the systematic use of relevant activity, interest, and opinion constructs to quantitatively explore and explain the communicating, purchasing, and consuming behaviors of persons for brands, products, and clusters of products. Psychographics can be used in healthcare marketing in the following important ways (Solo- mon, 2013): • To define the target market: For example, the Low T Center was developed to help men, primarily in the 40–60 age group, who experience erectile dysfunction or weight gain due to low testosterone levels (Low T Center, 2013). • To create a new view of the market: For example, rather than portraying people over age 65 as being retired and sedentary, psychographic research can identify the increasing number of seniors who are psychically active and continuing to work. • To position a product or service: For example, people with an active lifestyle often want treatment that is fast, convenient, and involves a minimum of reha- bilitation. This has led many HCOs to advertise same-day surgery in surgical ambulatory centers. • To market social issues: For example, it is well known that obesity is a problem
- 13. in the developed world, particularly in the United States. Psychographic analy- sis can help government officials and healthcare providers target information to populations whose lifestyles lead to obesity (Centers for Disease Control and Prevention, 2013). • To better communicate with patients and potential patients: Research indicates that consumers who possess the psychographic characteristics of health conscious- ness, consumerism, and environmental consciousness are more likely to seek health information than other healthcare consumers (Dutta-Bergman, 2003). Thus, it is important for an HCO to make its health information easy to locate and useful to consumers. The Technique of Lifestyle Segmentation Lifestyle segmentation research measures (a) how people spend their time engaging in activities; (b) what is of most interest or importance to them in their immediate surround- ings; and (c) their opinions and views about themselves and the world around them. Together, these three areas are generally referred to as activities, interests, and opinions (AIOs). In a typical, large-scale lifestyle research project, questionnaires are mailed to members of a nationwide consumer panel. (There are other methods available to conduct this type of research, such as an online panel; research results will be affected by the representativeness
- 14. Section 9.2Market Demand Analysis of the panel.) The questionnaires solicit traditional demographic information, average usage rates for as many as 100 different products, media habits, and respondents’ AIOs. Approxi- mately 300 AIO statements may be included, to which respondents indicate, for example, the extent of their agreement, in response to a statement, on a six- point Likert scale, which ranges from Strongly Agree to Strongly Disagree. The following are typical of the AIO statements employed: • I have more self-confidence than most of my friends. • Our family is too heavily in debt today. • I am a homebody. • I like to be considered a leader. • I would be willing to pay more for a product with all natural ingredients. • I am an impulse buyer. • My family is the most important thing to me. Armed with these three sets of consumer data (AIOs, demographics, and product usage) from the completed questionnaires, the marketer constructs user profiles. The analysis involves relating levels of agreement on all AIO items with the levels of usage of a product and with demographic characteristics. Typically, a pattern emerges in which AIO statements cluster together; that is, the respondents are grouped together from a similar lifestyle perspective.
- 15. Lifestyle, or AIO, segmentation analysis has been greatly enhanced by the availability of data from marketing consulting firms such as Yankelovich, Inc. The Measurement of Consumer Motivations and Resources Psychographic research is available from VALS™ (this is not an acronym), a consumer seg- mentation based on psychological characteristics and several key demographics that corre- late with consumer behavior. Developed by SRI International and currently owned by Stra- tegic Business Insights, VALS is a validated segmentation that can be replicated with a high degree of reliability, using different population samples, and the results are trendable. Unlike lifestyle segmentations that use cluster or regression analysis models to determine consumer groups, VALS uses a 39-question survey and proprietary algorithm. To take the US VALS sur- vey, go to http://www.strategicbusinessinsights.com/vals/presurvey.shtml. To receive an accurate VALS type, your first language must be American English. If you are not a citizen of the United States or Canada, your residency there should be for sufficient time to know the culture of either country and its idioms. You must meet these conditions for your VALS type to be valid. As shown in Figure 9.3, VALS measures two key concepts: motivations and resources. Adults are classified into one of eight consumer groups, which are described succinctly following the figure. The resource dimension includes a variety of material, emotional, and psychological
- 16. resources such as income, education, self-confidence, health, eagerness to buy, and energy level. Motivations identify consumer groups by their underlying driver: ideals, achievement, and self-expression. For example, although each group has exposure to the same products and media, responses differ because each group’s motivations (self- perception) and resources— the ability to realize their self-perception in the marketplace— differ. Lifestyle, media, and consumer-behavior data are collected annually through GfK MRI’s Survey of the American Consumer® and proprietary surveys in which the VALS survey is embedded. As a result, VALS is often used to develop robust target-group profiles and to provide consumer insight: http://www.strategicbusinessinsights.com/vals/presurvey.shtml Section 9.2Market Demand Analysis • Innovators are: Self-confident; receptive to new products, technologies, and delivery channels; globally aware; abstract thinkers; active and involved; 10% of U.S. adults. • Thinkers are: People who value knowledge, look for function over form, think glob- ally but act locally, want to stay healthy because it is responsible to do so, 11% of U.S. adults. • Achievers are: Status-conscious, middle-class, focused on family and career, not will- ing to sacrifice, skeptical, reward-seeking, 14% of U.S. adults.
- 17. • Experiencers are: Self-absorbed, inexperienced, very optimistic, stimulation-seeking, not interested in details, irreverent, social-media socialites, cynical, 13% of U.S. adults. • Believers are: Conservative, traditional, family-focused, slow to change, unsure, responsible, literal, 16.5% of U.S. adults. • Strivers are: Disenfranchised; lack the skills, education, and tenacity to change their lot in life; want to belong to more affluent groups; are largely uninformed; 11.5% of U.S. adults. • Makers are: Self-reliant and independent, distrustful of government and large institutions, practical, helpful, close to nature, unimpressed by luxuries, 12% of U.S. adults. • Survivors are: Mature; often in ill health; appreciative of small, thoughtful gestures; dependent on social safety-net programs; trustful of most authority figures; 12% of U.S. adults. Figure 9.3: Psychographic segments Psychographic segments help marketers better understand and predict consumer behaviors. f09.03_MHA 626.ai
- 18. Ideals THINKERS BELIEVERS Primary motivation High resources High innovation Low resources Low innovation US VALS Framework Achievement ACHIEVERS INNOVATORS STRIVERS SURVIVORS Self-Expression EXPERIENCERS MAKERS Source: www.strategicbusinessinsights.com/vals © 2014 by Strategic Business Insights. Al rights reserved. www.strategicbusinessinsights.com/vals
- 19. Section 9.3Market Potential The Application of Lifestyle Segmentation Lifestyle may be used as a basis for segmentation in several ways. In one approach, the mar- keter seeks to classify the consumer population into groups based on general lifestyle char- acteristics; in this manner, the consumers within a specific group will have a similar lifestyle. Using the research approach described in a preceding subsection, a representative sample of consumers responds to a questionnaire containing AIOs, product usage, media consumption, and demographic items. Through statistical routines (clustering and others), the marketer attempts to discern whether those consumers, based on their responses, can be formed into distinct groups. Each group represents a different pattern of needs for, and consumption of, products and services. Once these groups are identified, the marketer is able to direct his or her product to appeal to one or several lifestyle segments. 9.3 Market Potential Once a market has been divided into various segments, and characteristics of consumers and market factors in each market have been analyzed, the next step is to estimate the size of the market. The term market potential refers to the expected revenue of a product or service for an entire market. More simply, if everybody that could buy would buy, how many units or dollars’ worth of revenue would be produced? The answer to that question is the market potential. A
- 20. market segment that does not have enough consumers spending enough dollars does not jus- tify effort unless a firm is seeking to accomplish some nonrevenue-related objective. An orga- nization is not just seeking consumer markets, but markets that can be served profitably by that organization in attempting to meet their needs. Market potential is a quantitative measure of a market’s capacity to consume a product in a given time period, which is a prerequisite to assessing profitability. Market potential can be measured in either absolute or relative terms. An absolute measure is one that can be expressed in units or dollars, and a relative measure relates one part of a mar- ket to another and is expressed as a percentage. Techniques for estimating market potential are discussed in the following subsections. Revenue Index Measure of Relative Potential The revenue index method provides a relative measure of potential for products that have reached the maturity stage. This technique is useful in answering questions about the relative potential of various geographical market areas. Its use requires familiarity with the product in terms of revenues and penetration of distribution in various areas, and it also requires a revenue history. This technique is illustrated in the artificial product data listed in Table 9.1. Notice that the resulting figures are percentages of total industry revenue by region. This table, in effect, illustrates that industry revenue will occur next year in the same
- 21. proportion as last year’s, in each region. The potential in the northwest region is expected to be 23.2% of the total— whatever that total turns out to be next year. This measure of potential allows one region to be compared to another. Section 9.3Market Potential Table 9.1: Revenue index method Region Industry Revenue Revenue Index Potential Northeast $8,500,009 28.8% 28.8% Southeast 6,753,090 22.8 22.8 Northwest 6,870,421 23.2 23.2 Southwest 7,430,218 25.2 25.2 29,553,738 100.0% 100.0% Market Factor Method Normally, a relative measure of potential is not adequate, and an absolute measure of poten- tial is needed to provide estimates of potential in units or dollars. One technique for accom- plishing this is the market factor method. This method involves identifying the factors that influ- ence the revenue of a good or service and relating the factors to revenue in some way. Table 9.2 shows an example of this method, using population as the market factor. Population is
- 22. related to revenue in this example through the revenue rate or dollars of revenue per 1,000 people. Notice that absolute and relative potential could be calculated by region by using the pro- jected regional population as the factor and the regional revenue rate as the market factor in each region. Table 9.2: The market factor method Region Revenue ($) Population (000) Revenue Rate/ 1,000 Northeast $ 8,500,009 68,570 $123.96 Southeast 6,753,090 38,720 174.40 Northwest 6,870,421 32,810 209.40 Southwest 7,430,218 66,730 111.34 $29,553,738 206,830 $154.78 (avg.) Note: Population projection (next year) = 210,847; revenue rate (average) = $152.78/1,000; potential ($154.78 × 210,847) = $. Given a market segment, the number of people in that segment, and an expenditure rate, the potential of that segment can be calculated. Using this technique produces an estimate of the
- 23. absolute potential of a given market. This technique would be appropriate when an estab- lished market is being evaluated. Regression Analysis Method Another technique for estimating market potential involves the use of a statistical technique known as regression analysis. This technique still makes use of market factors, but the market factors are related to revenue in a more mathematically complex manner. Space does not permit a Section 9.3Market Potential complete explanation of this technique. The purpose here is to show how it could be used in estimating potential. One result of regression analysis is an equation that relates the market factor to revenue. If more than one market factor is used, then multiple regression analyses are needed. After a regression analysis has been completed, a financial analysis should be undertaken. The financial analysis usually covers at least four different areas: (a) revenue analysis, (b) cost analysis, (c) cash flow analysis, and (d) analysis of return on investment. As described in Chapter 8, one of the most beneficial ways to combine these four types of analyses is to use the concept of a pro forma income statement as the basic document to be generated by the financial analysis. A pro forma income
- 24. statement is a projected income statement for a specific, future time period, using estimates of the revenues and costs associ- ated with that time period. It provides an estimate of future cash flows to be produced by a given market segment that can be discounted to determine the present value of these cash flows. This, in turn, is used in calculating the rate of return anticipated as achievable from a given segment. A pro forma income statement for a proposed opportunity is shown in Table 9.3. The approach used for this venture was to develop three alternate pro forma statements, each based on a different assumption about revenues generated by the new venture. This approach permits identifying the optimistic, pessimistic, and most likely scenarios of a given situation. It is also in line with a more realistic approach to demand forecasting, which produces a range of rev- enue volume for new products. When products or services have already been on the market for several years, industry revenue history is available to use in projecting revenue. Table 9.3: Pro forma income statement for a satellite clinic Low (Pessimistic) Medium (Most likely) High (Optimistic)
- 25. Revenue Cost of revenue Gross margin $3,500,000 2,500,000 $1,000,000 $4,500,000 3,400,000 $1,100,000 $5,500,000 4,300,000 $1,200,000 Expenses Direct selling Advertising Transportation and storage Depreciation Credit and collections Financial and clerical Administrative 457,000 157,000 28,000 15,000 12,000 29,000
- 26. 55,000 480,000 168,000 38,000 15,000 14,000 38,000 55,000 512,000 180,000 48,000 15,000 16,000 47,000 55,000 Total expenses $753,000 $808,000 $873,000 Profit before taxes $247,000 $292,000 $327,000 Net profit after taxes (NPAT) $128,440 $151,840 $170,040 Cash flow (NPAT + Depreciation) $143,440 $166,840 $185,040 Section 9.3Market Potential Revenues and costs can change radically over the course of a product’s longevity. For example, high investments in promotion and building a distribution network produce losses in early
- 27. years; on the other hand, reduced variable costs achieved by increasing production efficiency and technological improvement may produce high profit levels in later years. Consequently, any realistic financial analysis must take into consideration an adequate time frame and asso- ciated changes in cost structures. Because the financial analysis of a given opportunity is usually long-run in nature, either the pro forma income statement must be estimated for each year, for some assumed length of time, or an “average” year can be used that represents three to five years into the future. Then, the discounted cash flow from this average year is used as an average for the venture’s anticipated life to calculate the return on investment or break- even point of the project. The return on investment can be calculated for each alternative and then compared with a prede- termined rate to evaluate the financial impact of each alternative. Developing a pro forma income statement requires a forecast of both expected revenues and operating expenses. The procedures for developing each of these estimates are discussed later in this chapter. Thus, the revenue analysis produces an estimate of revenues, the … Business Intelligence for Small and Middle-Sized Entreprises Oksana Grabova
- 28. ∗ University of Lyon (ERIC Lyon2) 5 av P. Mendes-France 69676 Bron Cedex, France [email protected] lyon2.fr Jerome Darmont University of Lyon (ERIC Lyon2) 5 av P. Mendes-France 69676 Bron Cedex, France [email protected] lyon2.fr Jean-Hugues Chauchat University of Lyon (ERIC Lyon2) 5 av P. Mendes-France 69676 Bron Cedex, France jean- [email protected] lyon2.fr Iryna Zolotaryova Kharkiv National University of
- 29. Economics 9-a, pr. Lenina 61001 Kharkov, Ukraine [email protected] ABSTRACT Data warehouses are the core of decision support sys- tems, which nowadays are used by all kind of enter- prises in the entire world. Although many studies have been conducted on the need of decision support systems (DSSs) for small businesses, most of them adopt ex- isting solutions and approaches, which are appropriate for large-scaled enterprises, but are inadequate for small and middle-sized enterprises. Small enterprises require cheap, lightweight architec- tures and tools (hardware and software) providing on- line data analysis. In order to ensure these features, we review web-based business intelligence approaches. For real-time analysis, the traditional OLAP architecture is cumbersome and storage-costly; therefore, we also re- view in-memory processing.
- 30. Consequently, this paper discusses the existing approa- ches and tools working in main memory and/or with web interfaces (including freeware tools), relevant for small and middle-sized enterprises in decision making. 1. INTRODUCTION During the last decade, data warehouses (DWs) have become an essential component of modern de- cision support systems in most companies of the world. In order to be competitive, even small and middle-sized enterprises (SMEs) now collect large ∗ This author also works at the Kharkiv National Uni- versity of Economics, 9-a, pr.Lenina, 61001 Kharkov, Ukraine volumes of information and are interested in busi- ness intelligence (BI) systems [26]. SMEs are re- garded as significantly important on a local, na- tional or even global basis and they play an impor- tant part in the any national economy [34]. In spite of multiples advantages, existing DSSs frequently remain inaccessible or insufficient for SMEs because of the following factors: • high price; • high requirements for a hardware infrastruc- ture; • complexity for most users; • irrelevant functionality; • low flexibility to deal with a fast changing dy-
- 31. namic business environment [56]; • low attention to difference in data access ne- cessity in SMEs and large-scaled enterprises. In addition, many projects fail due to the com- plexity of the development process. Moreover, as the work philosophies of small and large-scaled en- terprises are considerably different, it is not advis- able to use tools destined to large-scaled enterprises. In short, ”one size does not fit all” [51]. Further- more, there are a lot of problems in the identifica- tion of information needs of potential users in the process of building a data warehouse [7]. Thereby, SMEs require lightweight, cheap, flexible, SIGMOD Record, June 2010 (Vol. 39, No. 2) 39 simple and efficient solutions. To aim at these fea- tures, we can take advantage of light clients with web interfaces. For instance, web technologies are utilized for data warehousing by large corporations, but there is an even greater demand of such kind of systems among small and middle-sized enterprises. Usage of web technologies provides cheap software, because it eliminates the necessity for numerous dispersed applications, the necessity of deployment and maintenance of corporate network, and reduces training time. It is simple for end-users to utilize web-based solutions. In addition, a web-based ar- chitecture requires only lightweight software clients (i.e., web browsers). Besides, there is a need for real-time data analysis, which induces memory and storage issues. Tradi-
- 32. tional OLAP (On line Analytical Processing) tools are often based on a cumbersome hardware and software architecture, so they require significant re- sources to provide a high performance. Their flex- ibility is limited by data aggregation. At the same time, in-memory databases provide significant per- formance improvements. Absence of disk I/O oper- ations permits fast query response times. In-memo- ry databases do not require indexes, recalculation and pre-aggregations, thus system becomes more flexible because analysis is possible to a detailed level without its pre-definition. Moreover, accord- ing to analyst firms, ”by 2012, 70% of Global 1000 organizations will load detailed data into memory as the primary method to optimize BI application performance” [47]. Thus, our objective is to propose an original and adapted BI solutions for SMEs. To this aim, in a first step, we review in this paper the existing re- search related to this issue. The remainder of this paper is organized as follows. In section 2, we first present and discuss web-based BI approaches, namely web data warehouses and web-based open source software for data warehous- ing. In Section 3, we review in-memory BI solutions (MOLAP, vector database-based BI software) and technologies that can support it (in-memory and vector databases). We finally conclude this paper in Section 4 and provide our view on how the re- search and technologies surveyed in this paper can be enhanced to fit SME’s BI needs. 2. WEB-POWERED BI The Web has become the platform of choice for the delivery of business applications for large-scaled
- 33. entreprises as well as for SMEs. Web warehousing is a recent approach that merges data warehous- ing and business intelligence systems with web tech- nologies [52]. In this section, we present and discuss web data warehousing approaches, their features, advantages and possibilities, as well as their neces- sity and potential for SMEs. 2.1 Web warehousing 2.1.1 General information There are two basic definitions of web warehous- ing. The first one simply states that web ware- houses use data from the Web. The second con- centrates on the use of web technologies in data warehousing. We focus on second definition in our paper. Web-data warehouses inherit a lot of characteristics from traditional data warehouses, including: data are organized around major subjects in the enter- prise; information is aggregated and validated; data is represented by times series, not by current status. Web-based data warehouses nonetheless differ from traditional DWs. Web warehouses organize and manage the stored items, but do not collect them [52]. Web-based DW technology changes the pat- tern of users accessing to the DW: instead of ac- cessing through a LAN (Local Area Network), users access via Internet/Intranet [30]. Specific issues raised by web-based DW include un- realistic user expectations, especially in terms of how much information they want to be able to ac- cess from the Web; security issues; technical imple- mentation problems related to peak demand and
- 34. load problems [42]. Eventually, web technologies make data warehouses and decision support systems friendlier to users. They are often used in data warehouses only to vi- sualize information [18]. At the same time, web technology opens up multiple information formats, such as structured data, semi-structured data and unstructured data, to end-users. This gives a lot of possibilities to users, but also creates a problem known as data heterogeneity management [19]. Another important issue is the necessity to view the Web as an enormous source of business data, with- out whose enterprises loose a lot of possibilities. Owing to the Web, business analysts can access large external to enterprise information and then study competitor’s movements by analyzing their web site content, can analyze customer preferences or emerging trends [11]. So, e-business technologies are expected to allow SMEs to gain capabilities that were once the preserve of their larger competitors [34]. However, most of the information in the Web is unstructured, heterogeneous and hence difficult to analyze [26]. 40 SIGMOD Record, June 2010 (Vol. 39, No. 2) Among web-technologies used in data warehousing, we can single out web browsers, web services and XML. Usage of web browser offers some advantages over traditional warehouse interface tools [19, 33]: • cheapness and simplicity of web browser in- stallation and use;
- 35. • reduction of system training time; • elimination of problems posed by operating systems; • low cost of deployment and maintenance; • elimination of necessity for numerous dispersed applications; • possibility to open data warehouse to business partners over an extranet. Web warehouses can be divided into two classes: XML document warehouses and XML data ware- houses. We present them in sections 2.1.2. and 2.1.3. respectively. We also introduce OLAP on XML data (XOLAP) in section 2.1.4. We finish this section by web-based paradigm known as cloud computing (section 2.1.5). Section 2.2. finally pre- sents web-based open source software for data ware- housing analysis. 2.1.2 XML document warehouses An XML document warehouse is a software frame- work for analyzing, sharing and reusing unstruc- tured data (texts, multimedia documents, etc.). Un- structured data processing takes an important place in enterprise life because unstructured data are larger in volume than structured data, are more difficult to analyze, and are an enormous source of raw in- formation. Representing unstructured or semi-structured data with traditional data models is very difficult. For example, relational models such as star and snowflake schemas are semantically poor for unstructured data. Thus, Nassis et al. utilize object-oriented concepts
- 36. to develop a conceptual model for XML document warehouses [35]. They use UML diagrams to build hierarchical conceptual views. By combination of object oriented concepts and XML Schema, they build the xFACT repository. 2.1.3 XML data warehouses In contrast to XML document warehouses, XML data warehouses focus on structured data. XML data warehouse design is possible from XML sources [3]. In this case, it is necessary to translate XML data into a relational schema by XML schema [3, 8]. Xyleme is one of the first projects aimed at XML data warehouse design [57]. It collects and archives web XML documents into a dynamic XML ware- house. Some more recent approaches are based on classical warehouse schemas. Pokorny adapts the traditional star schema with explicit dimension hierarchies for XML environments by using Document Type Def- inition (DTD) [41]. Boussäıd et al. define data warehouse schemas via XML schema in a methodol- ogy named X-Warehousing [8]. Golfarelli proposes a semi-automatic approach for building the concep- tual schema for a data mart starting directly from XML sources [15]. This work elaborates the con- cept of Dimensional Fact Model. Baril and Bellah- sene propose a View Model from XML Documents implemented in the DAWAX (Data Warehouse for XML) system [4]. View specification mechanism al- lows filtering data to be stored. Nørv̊ ag introduces a temporal XML data warehouses to query histor- ical document versions and query changes between document versions [36]. Nørv̊ ag et al. also propose
- 37. TeXOR, a temporal XML database system built on top of an object-relational database system [37]. Fi- nally, Zhang et al. propose an approach, named X- Warehouse, to materialize data warehouses based on frequent query patterns represented by Frequent Pattern Trees [58]. 2.1.4 XOLAP Some recent research attempts to perform OLAP analysis over XML data. In order to support OLAP queries and to be able to construct complex ana- lytic queries, some researches extend the XQuery language with aggregation features [5]. Wiwatwattana et al. also introduce an XQuery cube operator, Xˆ3 [55], Hachicha et al. also pro- pose a similar operator, but based on TAX (Tree Algebra for XML)[17]. 2.1.5 Cloud computing Another, increasingly popular web-based solution is cloud computing. Cloud computing provides ac- cess to large amounts of data and computational resources through a variety of interfaces [38]. It is provided as services via cloud (Internet). These ser- vices delivered through data centers are accessible anywhere. Besides, they allow the rise of cloud an- alytics [2]. The main consumers of cloud computing are small enterprises and startups that do not have a legacy of IT investments to manage [50]. Cloud computing- based BI tools are rather cheap for small and middle- sized enterprises, because they provide no need of hardware and software maintenance [1] and their
- 38. SIGMOD Record, June 2010 (Vol. 39, No. 2) 41 prices increase according to required data storages. Contrariwise, cloud computing does not allow users to physically possess their data storage. It causes user dependence on the cloud computing provider, loss of data control and data security. In conclu- sion, most cloud computing-based BI tools do not fit enterprise requirements yet. 2.1.6 Discussion Data storage and analysis interface solutions should be easily deployed in a small organization at low cost, and thus be based on web technologies such as XML and web services. Web warehousing is rather recent, but a popular direction that provides a lot of advantages, especially in data integration. Web-based tools provide light interface. Thereby, their usage by small and middle-sized enterprises is limited. Existing cloud-based BI tools are appro- priated for small and middle-sized enterprises with respect to price and flexibility. However, they are so far enterprise-friendly and are in need of data security enhancements. 2.2 Web-based open source software In this section, we focus on ETL(Extraction Trans- formation Loading) tools, OLAP servers and OLAP clients. Their characteristics are summarized in Ta- ble 1. 2.2.1 ETL
- 39. Web-based free ETL tools are in most cases RO- LAP (Relational OLAP, discussed in Section 3.1.1.)- oriented. ROLAP-oriented ETL tools allow user to define and create data transformations in Java (JasperETL) or in TL (Clover.ETL)1. Singular MO- LAP (Multidimensional OLAP, discussed in Section 3.1.1.)-oriented ETL Palo defines the ETL process either via web interfaces or via XML structures for experts. All studied ETL tools configure heteroge- neous data sources and complex file formats. They interact with differents DBMSs (DataBase Manage- ment Systems). Some of the tools can also ex- tract data from ERP (Enterprise Resource Plan- ning) and CRM (Customer Relationship Manage- ment) systems [53]. 2.2.2 OLAP In this section we review OLAP servers as well as OLAP clients. All studied OLAP severs use the MDX (Multi-Dimensional eXpression) language for aggregating tables. They parse MDX into SQL to retrieve answers to dimensional queries. All re- viewed OLAP servers exists for Java, but a Palo 1http://www.cloveretl.com exists also for .NET, PHP, and C. Moreover, Palo is an in-memory Multidimensional OLAP database server2. Mondrian schemas are represented in XML files3. Mondrian Pentaho Sever is used by different OLAP clients, e.g., FreeAnalysis. All studied OLAP clients are Java applications. They usually run on client, but tools also exist that run on web servers[53]. So far, only PocOLAP is a
- 40. lightweight, open source OLAP solution. 2.2.3 Discussion The industrial use of open source business intel- ligence tools is becoming increasingly common, but it is still not as wide- spread as for other types of software [53]. Moreover, freeware OLAP systems often propose simple web-based interfaces. In addi- tion, there are some web-based open source BI tools that work in memory. Nowadays, there are three complete solutions, in- cluding ETL and OLAP: Talend OpenStudio, Mon- drian Pentaho and Pa- lo. Among ETL tools, only Palo is MOLAP-oriented. Not all of these tools provide free graphical user in- terfaces. All three represented ETL tools support Java. They can be implemented on different plat- forms. Free web-based OLAP servers are used by different OLAP clients. The most extended and widely used is Mondrian Pentaho Server due to its function- ality. All studied OLAP clients are Java applica- tions. Most of them can be used with XMLA(XML for Analysis)-enabled sources. But they have not enough documentation. Generally, web-based studied tools provide sufficient functionality, but they remain cumbersome due to traditional OLAP usage. 3. IN-MEMORY BI SOLUTIONS In the late eighties, main memory databases were researched by numerous authors. Thereafter, it has rarely been discussed because of limits of technolo- gies at this time, but nowadays it takes back an
- 41. important place in database technologies. 3.1 MOLAP 3.1.1 OLAP and MOLAP Before studying existing MOLAP approaches, we review general OLAP principles and definitions. The OLAP concept was introduced in 1993 by Codd. OLAP is an approach to quickly answer multidi- mensional analytical queries [13]. In OLAP, a di- 2http://www.jedox.com/en/products/palo olap server 3http://mondrian.pentaho.org/ 42 SIGMOD Record, June 2010 (Vol. 39, No. 2) Tools Platform License Particular features ETL ROLAP Clover.ETL Java LGPL does not have an open source GUI; uses its own TL language for data transfor- mations JasperETL Java GPL generated code - Java or Perl; can use CRM systems as data sources MOLAP Palo ETL Server Java GPL does not have a GUI for a while; parallel jobs are not supported
- 42. OLAP servers Mondrian Java CPL ROLAP-based; data cubes via XML Palo Java GPL MOLAP-based; works in memory; data cubes via Excel add-in clients FreeAnalysis Java MPL works with servers that use XMLA, e.g., Modrian JPalo Java GPL works with the Palo server PocOLAP Java LGPL Table 1: Web-based open source software mension is a sequence of analyzed parameter val- ues. An important goal of multidimensional mod- eling is to use dimensions to provide as much con- text as possible for facts [21]. Combinations of di- mension values define a cube’s cell. A cube stores the result of different calculations and aggregations. There are three variants of OLAP: MOLAP, RO- LAP, Hybrid OLAP (HOLAP). We compare these approaches in table 2. With respect to ROLAP and HOLAP, MOLAP pro- vides faster computation time and querying [48] due to a storage of all required data in the OLAP server. Moreover, it provides more space-efficient storage [40]. Since the purpose of MOLAP is to support deci- sion making and management, data cubes must con- tain sufficient information to support decision mak- ing and reply to every user expectation. In this
- 43. context, researches try to improve three main as- pects: response time (by new aggregations algo- rithms [28], new operators [46]), query personaliza- tion, data analysis visualization [26]. 3.1.2 Storage methods Researchers interested in MOLAP focus a lot on storage techniques. In addition, most researches choose MOLAP as the most suitable among OLAP- techniques for storage [31], although MOLAP re- quires significant storage capacity. According to Kudryavcev, there are three basic types of storage methods: semantic, syntactical, approximate [23]. Syntactical approaches transform only data stor- age schemas. Semantic storage techniques trans- form cube structures. Approximate storage tech- niques compress initial data. One semantic storage technique is Quotient Cube. It consists in a se- mantic compression by partitioning the set of cells of a cube into equivalent classes, while keeping the cube’s roll-up and drill-down semantics and lattice structure [25]. The main objective of such approxi- mating storage technique such as Wavelets is range- sum query optimization [29]. In the syntactical ap- proach DWARF, a cube is compressed by deleting redundant information [49]. Data are represented as graphs with keys and pointers in graphs nodes. Data redundancy decrease is provided by an ad- dressing and data storage improvement. 3.1.3 Schema evolution There are a lot of works that bring up the prob- lem of schema evolution, because working only with
- 44. the latest version hides the existence of information that may be critical for data analysis. It is possible to classify these studies into two groups: updat- ing models (mapping data in the last version) and tracking history models (saving schema evolution). Other types of approaches look at the possibility for users to choose which presentation they want for query reponses. For instance, Body et al. proposed a novel temporal multidimensional model for sup- porting evolutions on multidimensional structures by introducing a set of temporal modes of presen- tation for dimensions in a star schema [6]. 3.1.4 Discussion Multidimensional OLAP is appropriate for de- cision making. It offers a number of advantages, including automatic aggregation, visual querying, and good query performance due to the use of pre- aggregation [39].Besides, MOLAP may be a good solution for the situations in which small to medium- sized DBs are the norm and application software SIGMOD Record, June 2010 (Vol. 39, No. 2) 43 Table 2: Comparison of OLAP technologies MOLAP ROLAP HOLAP Data storage Multidimensional database Relational database Uses MOLAP technology to store higher-level summary data, a RO- LAP system to store detailed data
- 45. Results sets Stores in a MOLAP cube Stores no results sets Stores results sets, but not all Capacity Requires singificant ca- pacity Requires the least stor- age capacity Performance The fastest perfor- mance The slowest perfor- mance Dimensions Minimum number Maximum number Compromise between performance, capacity, and permutations of dimensions available to a user Vulnerability Provides poor storage utilization, especially when the data set is sparse Database design rec- ommended by ER di- agrams are inappropri- ate for decision sup- port systems Advantages Fast query perfor-
- 46. mance; automated computation of higher level aggregates of the data; array model pro- vides natural indexing No limitation on data volume; leverage func- tionalities inherent in relational databases Fast access at all levels of aggrega- tion; compact aggregate storage; dy- namically updated dimensions; easy aggregate maintenance Disadvantages Data redundancy; querying models with dimensions of high cardinality is difficult Slow performance Complexity - a HOLAP server must support MOLAP and ROLAP en- gines, tools to combine storage en- gines and operations. Functionality overlap - between storage and opti- mization techniques in ROLAP and MOLAP engines. speed is critical [45], because loading all data to the multidimensional format does not require sig- nificant time nor disk space. Nevertheless, MOLAP systems have different problems due to the complex- ity, time-consuming and necessity of an expert for cube rebuilding. If the user wants to change di- mensions, the whole deployment process need to be
- 47. redone (datamart schema, ETL process, etc.) [56]. However, the cost of MOLAP tools does not fit the needs of small and middle-sized enterprises. In ad- dition, MOLAP-based systems may encounter sig- nificant scalability problems. Moreover, MOLAP requires a cumbersome architecture, i.e., important software and hardware needs, the necessity of signif- icant changes in work process to generate substan- tial benefits [32], and a considerable deployment time. 3.2 Main Memory Databases 3.2.1 General information Main Memory Databases (MMDBs) entirely re- side in main memory [14] and only use a disk sub- system for backup [16]. The concept of managing an entire database in main memory has been re- searched for over twenty years, and the benefits of such approaches have been well-understood in cer- tain domains, such as telecommunications, security trading, applications handling high traffic of data, e.g., routers; real-time applications. However, it is only recently, with decreasing memory prices and the availability of 64-bit operating systems, that the size restrictions on in-memory databases have been removed and in-memory data management has be- come available for many applications [27, 54]. When the assumption of disk-residency is removed, com- plexity is dramatically reduced. The number of ma- chine instructions drops, buffer pool management disappears, extra data copies are not needed, in- dex pages shrink, and their structure is simplified. Design becomes simpler and more compact, and queries are executed faster [54]. Consequently, us-
- 48. age of main memory databases become advanta- geous in many cases: for hot data (frequently ac- 44 SIGMOD Record, June 2010 (Vol. 39, No. 2) cess, low data volume), for cold data (scarce access, in the case of voluminous data), in application re- quiring a short access/response time. A second wave of applications using MMDB is cur- rently appearing, e.g., FastDB, Dali from AT&T Bell lab, TimesTen from Oracle. These systems are widely used in many applications such as HP intellect web flat already, Cisco VoIP call Proxy, the telecom system of Alcatel and Ericsson and so on [12]. The high demand of MMDBs is provoked by the necessity of high reliability, high real-time capacity, high quantity of information throughput [20]. MMDBs have some advantages, including short re- sponse time, good transaction throughputs. MMDBs also leverage the decreasing cost of main memory. Contrariwise, MMDB size is limited by size of RAM (Random Access Memory). Moreover, since data in main memory can be directly accessed by the pro- cessor, MMDBs suffer from data vulnerability, i.e., risk of data loss because of unintended accident due to software errors[14], hardware failure or other haz- ards. 3.2.2 MMDB issues Although in-memory technologies provide high performance, scalability and flexibility to BI tools, they are still some open issues. MMDBs work in
- 49. memory, therefore the main problems and challenges are recovery, commit processing, access methods and storage. There is no doubt that backups of memory resident databa- ses must be maintained on other storage than main memory in order to insure data integrity. In order to protect against failures, it is necessary to have a backup copy and to keep a log of transac- tion activity [14]. In addition, recovery processing is usually the only MMDB component that deals with disk I/O, so it must be designed carefully [20]. Ex- isting research works do not share a common view of this problem. Some authors propose to use a part of stable main memory to hold the log. It pro- vides short response time, but it causes a problem when logs are large. So, it is used for the precom- mit transactions. Group commits (e.g., a casual commit protocol [27]) allow accumulating several transactions in memory before flushing them to the log disk. Nowadays, commit processing is especially important in distributed database systems because it is slow due to the fact that disk logging takes place at several sites [27]. Several different approaches of data storage exist for MMDBs. Initially, there have been a lot of attempts to use database partitioning techniques developed earlier for other types of databases. Gruenwald and Eich divide existing techniques as following: hori- zontal partitioning, group partitioning, single ver- tical partitioning, group vertical partitioning, and mixed partitioning [16]. Only horizontal and single vertical partitioning are suitable for MMDBs and, as a result of this study, single vertical partitioning was chosen as the most efficient [10]. B-trees and hashing are identified also as appropriate storage
- 50. techniques for MMDBs. Hashing is not as space ef- ficient as a tree, so it is rarely used [43]. Finally, most researches agree to choose T-trees (a balanced index tree data structure optimized for cases where both the index and the actual data are fully kept in memory) as the main storage technique [12, 14, 44]. T-trees indeed require less memory space and fewer CPU cycles than B-trees, so indexes are more economical. Above-mentioned issues are important for BI envi- ronment: data coherence is strategic, performance is fundamental for on-line operations like OLAP. Choices of right storage and recovering techniques are crucial as it can damage data security and data integrity. 3.2.3 MMDB Systems In this section we give an overview of MMDB sys- tems. We particularly focus our discussion on the most recent systems such as Dali, FastDB, Kdb, IBM Cognos TM1 and TimesTen. Among studied systems, we can distinguish a stor- age manager (the Dali system [20]) and complete main memory data- base systems (FastDB, Kdb, TM1, TimesTen). Interfaces can be based on zero- footprint Web (IBM Cognos TM14), standard SQL (TimesTen)[54] or C++ (FastDB)[22]. Most MMDBS feature SQL or SQL-like query language (FastDB, TimesTen). Kdb system uses its own language ”q” for programming and querying [24]. IBM Cognos 8 BI and TimesTen are aimed at de- cision making in large corporations. Main MMDB disadvantages are interprocess communication ab- sence and high storage requirements (Dali system) [9], limitation of server memory (TimesTen), client-
- 51. server architecture is unsupportable (FastDB). 3.2.4 Discussion The main benefit of using MMDBs is short ac- cess/reponse time and good transaction through- put. But MMDBs are hampered by data vulnera- bility and security problems. Memory is not persis- tent, which means data loss in case of failure on the server. Security problems come from unauthorized 4www-01.ibm.com/software/data/cognos/products/tm1 SIGMOD Record, June 2010 (Vol. 39, No. 2) 45 access to data aimed at data corruption …