Download as PDF, PPTX


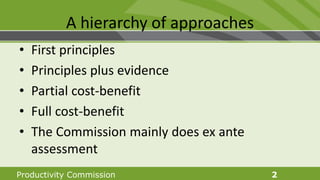
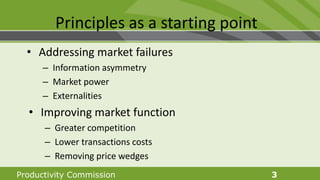
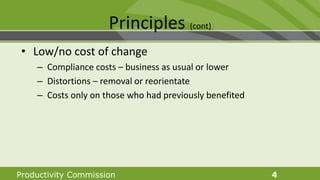
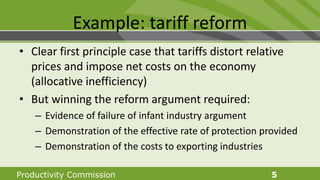


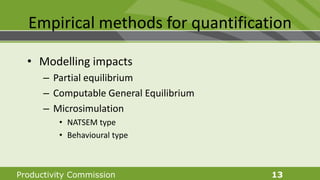
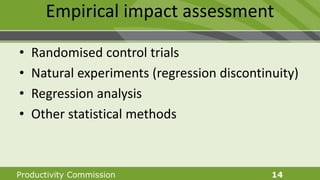

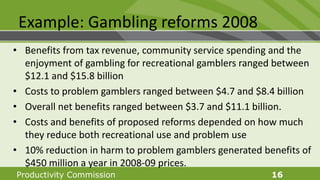
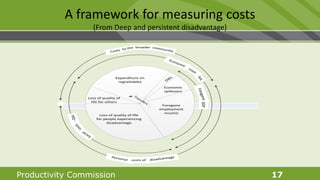

The document discusses various approaches to assess the gains from better regulation, emphasizing the importance of principles and evidence in decision-making. It highlights examples such as tariff reform and minimum wages, exploring the benefits and costs associated with reforms. Additionally, it outlines methodologies for cost-benefit analysis, empirical impact assessment, and tools to quantify non-market outcomes.


