
Recommended
Recommended
More Related Content
Similar to Artifical_intiligence_worksheet-exp-9.docx
Similar to Artifical_intiligence_worksheet-exp-9.docx (20)
Recently uploaded
Recently uploaded (20)
Artifical_intiligence_worksheet-exp-9.docx
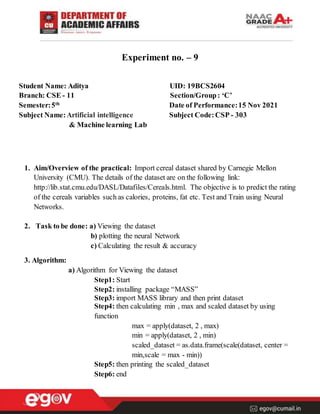
- 1. Experiment no. – 9 Student Name: Aditya UID: 19BCS2604 Branch: CSE - 11 Section/Group: ‘C’ Semester:5th Date of Performance:15 Nov 2021 Subject Name:Artificial intelligence Subject Code: CSP - 303 & Machine learning Lab 1. Aim/Overview of the practical: Import cereal dataset shared by Carnegie Mellon University (CMU). The details of the dataset are on the following link: http://lib.stat.cmu.edu/DASL/Datafiles/Cereals.html. The objective is to predict the rating of the cereals variables such as calories, proteins, fat etc. Test and Train using Neural Networks. 2. Task to be done: a) Viewing the dataset b) plotting the neural Network c) Calculating the result & accuracy 3. Algorithm: a) Algorithm for Viewing the dataset Step1: Start Step2: installing package “MASS” Step3: import MASS library and then print dataset Step4: then calculating min , max and scaled dataset by using function max = apply(dataset, 2 , max) min = apply(dataset, 2 , min) scaled_dataset = as.data.frame(scale(dataset, center = min,scale = max - min)) Step5: then printing the scaled_dataset Step6: end
- 2. b) Algorithms for plotting the neural Network Step1: Start Step2: installing packages “catools”and import the library Step3: then initialising “neuralnet” and import the library Step4: then defining the allvars and printing the allvars Step5: then defining predictorvars by using function predictorvars=paste(predictorvars,collapse="+"); Step6: printing the predictorvars Step7: then defining form by using function form=as.formula(paste("medv~",predictorvars,collapse="+")) Step8: printing the form Step9: then defining nm by using function nn=neuralnet(formula =form,data =training_set,hidden =c(4,2),threshold=0.01) Step10:plotting nm Step11:end c) Algorithms for Calculating the result & accuracy Step1: Start Step2: then defining results by using function results<- data.frame(actual = test_set$medv, prediction = nn.results$net.result); Step3: printing the results Step4: then calculating predicted by using function predicted=(results$prediction * (max(dataset$medv) - min(dataset$medv))) + min(dataset$medv) Step5: then calculating acutal by using function actual=(results$actual * (max(dataset$medv) - min(dataset$medv))) + min(dataset$medv) Step6: then calculating comparision and deviation co by using function comparison=data.frame(predicted,actual) deviation=((actual-predicted)/actual); Step7: printing the deviation
- 3. Step8: calculating accuracy of dataset by using function comparison=data.frame(predicted,actual,deviation) accuracy=1-abs(mean(deviation)) Step9: printing the accuracy Step10:end 4. Programming Code: a) Code for Viewing the dataset install.packages("MASS") library("MASS") dataset=Boston; print(dataset) View(dataset) max = apply(dataset, 2 , max) min = apply(dataset, 2 , min) scaled_dataset = as.data.frame(scale(dataset, center = min,scale = max - min)) print(scaled_dataset) b) Code for plotting the neural Network install.packages("caTools") library(caTools) set.seed(123) sample = sample.split(scaled_dataset$medv, SplitRatio = 0.6) training_set = subset(scaled_dataset, sample==TRUE) test_set = subset(scaled_dataset, sample==FALSE) install.packages("neuralnet") library(neuralnet) set.seed(2) allvars=colnames(dataset); print(allvars) predictorvars=allvars[!allvars%in%"medv"];
- 4. print(predictorvars) predictorvars=paste(predictorvars,collapse="+"); print(predictorvars) form=as.formula(paste("medv~",predictorvars,collapse="+")) print(form) nn=neuralnet(formula =form,data =training_set,hidden =c(4,2),threshold=0.01) plot(nn) c) Code for Calculating the result & accuracy nn.results=compute(nn,test_set[,1:13]) results<- data.frame(actual = test_set$medv, prediction = nn.results$net.result); print(results) predicted=(results$prediction * (max(dataset$medv) -min(dataset$medv))) + min(dataset$medv) actual=(results$actual * (max(dataset$medv) - min(dataset$medv))) + min(dataset$medv) comparison=data.frame(predicted,actual) deviation=((actual-predicted)/actual); print(deviation) comparison=data.frame(predicted,actual,deviation) accuracy=1-abs(mean(deviation)) print(accuracy)
- 5. 5. Output: a) Output for Viewing the dataset
- 6. b) Output for plotting the neural Network
- 7. c) Output for Calculating the result & accuracy
- 8. 6. Learning outcomes (What I have learnt): 1. I have learnt about the R studio. 2. I have learnt about the R programming language. 3. Got to know about Neural Networks. 4. I have learnt how to use library files used to create Neural Networks in R. 5. I have learnt about calculating the Accuracy for a Neural Network. 7. valuation Grid (To be created as per the SOP and Assessment guidelines by the faculty): Sr. No. Parameters Marks Obtained Maximum Marks 1. 2. 3.