Download as PDF, PPTX
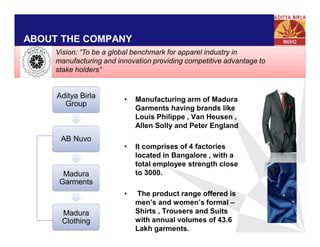
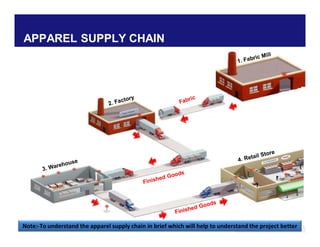
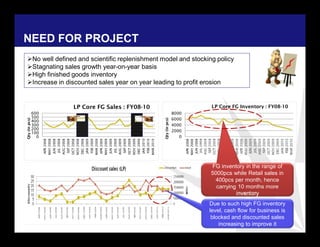
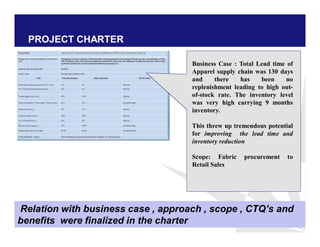
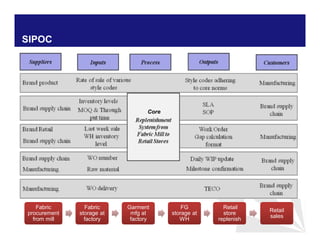
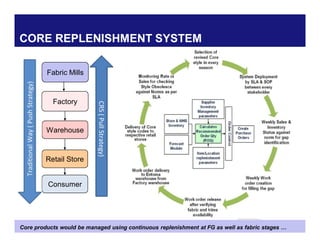
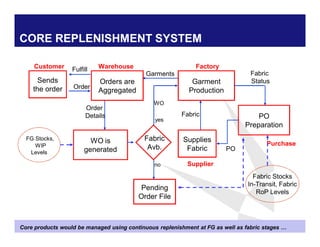
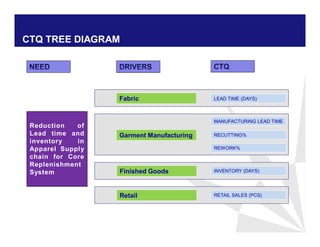
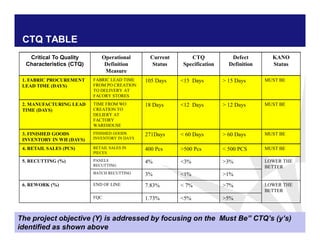
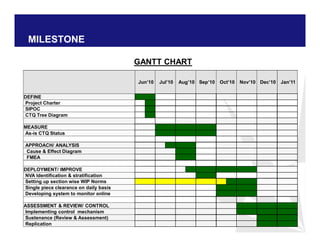
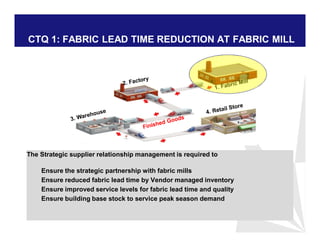

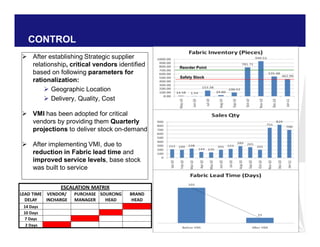


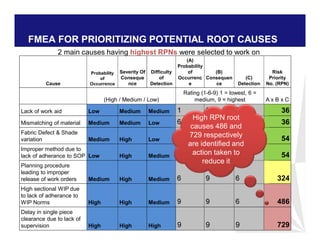
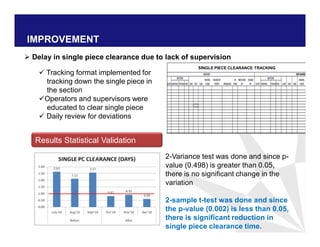
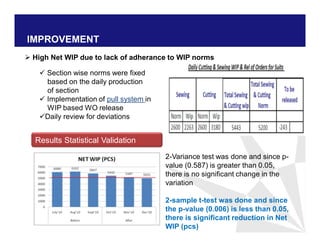
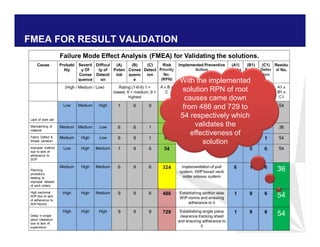
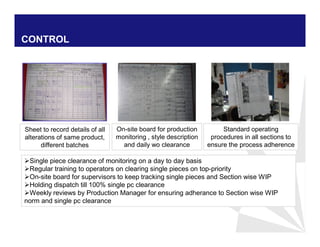
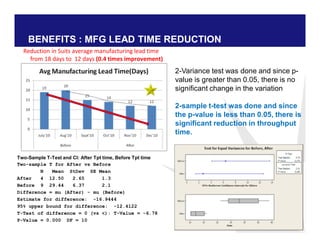
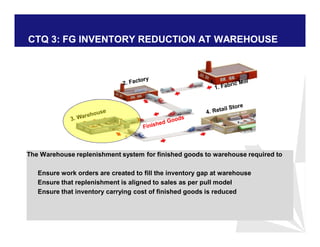
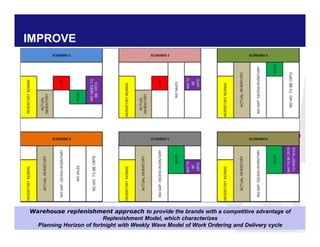
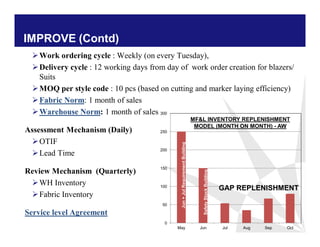
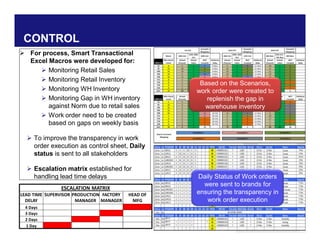
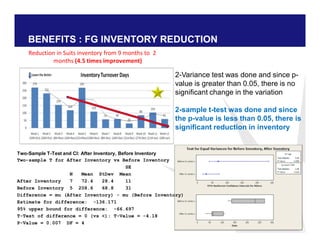
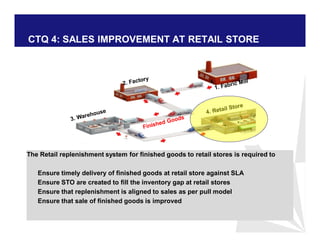
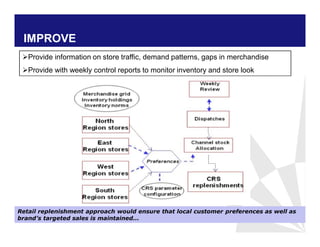
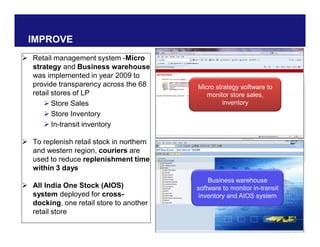
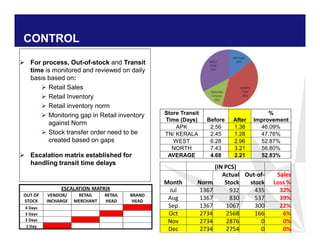
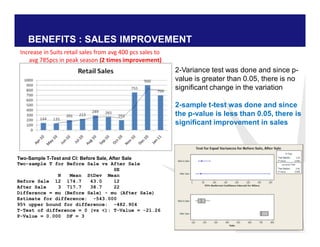
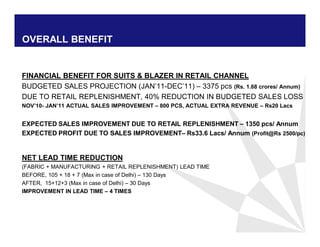
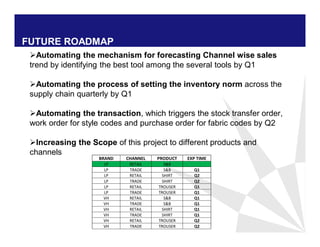


The document discusses reducing lead time and inventory in the apparel supply chain of Madura Clothing. It identifies high finished goods inventory and long lead times as issues. To address this, the team developed a Core Replenishment System using a pull strategy. This focuses on continuous replenishment at the fabric and finished goods stages for core products. The team defined Critical to Quality metrics like fabric lead time, manufacturing lead time, and finished goods inventory. Through analysis and improvements like setting work-in-progress norms and single piece clearance tracking, manufacturing lead time was reduced significantly. A warehouse replenishment approach with weekly work ordering and delivery cycles was also implemented to reduce finished goods inventory levels at the warehouse.


